When comparing different option strategies, it can be hard to determine how different the risk and reward of each strategy differs. Sometimes a picture is worth 1000 words. On this page, I will compare buying 100 shares of stock with different option strategies at different risk levels. To keep the complexity somewhat under control, each strategy will be bullish. I’ll start with comparing covered options on the 100 shares to just owning stock, then we’ll look at using equal amounts of capital in the four different levels of risk strategies, and finally look at the different outcomes of using options to be equivalent to buying 100 shares of stock. For each comparison, we’ll look at capital required, buying power used, impact of assignment, maximum profit and loss, and profit and loss differences for potential changes in price.
For each example we use, we will be evaluating trades on a hypothetical stock currently priced at $200 per share. The 30 day volatility or IVx is currently 18%. Keep in mind that our stock could just as easily be an exchange traded fund (ETF)- for simplicity of discussion, we’ll say that this is a stock.
The base case- buying 100 shares of stock
We’ll start with our simple base case that all of our other examples will be compared to. At $200 per share, 100 shares will cost us $20,000 to buy. Since we have 100 shares, every dollar that the stock price goes up, our position will increase by $100. Likewise, our position will decrease $100 for every dollar the price goes down. There is no limit to the upside or the downside, other than the price hitting zero. However, we know that the likely outcome is that the price won’t move more than 18% in the next year, based on current option implied volatility measures. So let’s look at this on a chart of profit and loss, based on stock price movement.

For stock, if the price goes up 5% or $10, to $210 per share, the position has a 5% profit, or $1000. Likewise if the price goes down by 20% or $40, to $160 per share, the position has a 20% loss, or a loss of $4000. What you see is what you get- the chart could go up forever, and down all the way to zero, where the loss would be $20,000. The point is that owning stock means that profits and losses are directly tied to movement in price. The only exception to this would be a dividend that would be provided to the owner of the stock and be a gain that isn’t apparent in the stock price. But generally, profit and price move up and down together. It’s really simple. As we move to option strategies, risks and rewards aren’t so straight-forward.
Level 0- Covered calls and case secured puts
As discussed in our risk overview, covered or secured option strategies are the lowest risk strategies available to traders. That’s because all risk in these strategies is covered by either stock or cash in the trader’s account and there is zero risk to the broker, and the risk to the trader is the same as stock to the downside. Let’s look at some examples and see how this works.
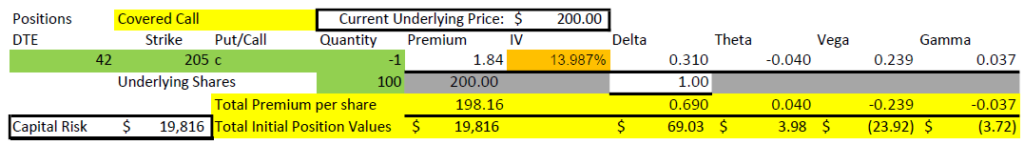
A trader selling a covered call is collecting a premium equal to just under 1% of the value of the stock in exchange for giving up any gains beyond 2.5% price increases in the next 42 days. There is the same risk down to zero, but with a little reduction because the call premium cushions a fall. So, the trade will now be profitable if the stock doesn’t fall more than the $1.84 collected in the sale of the option. This strategy will make money if the price doesn’t change.
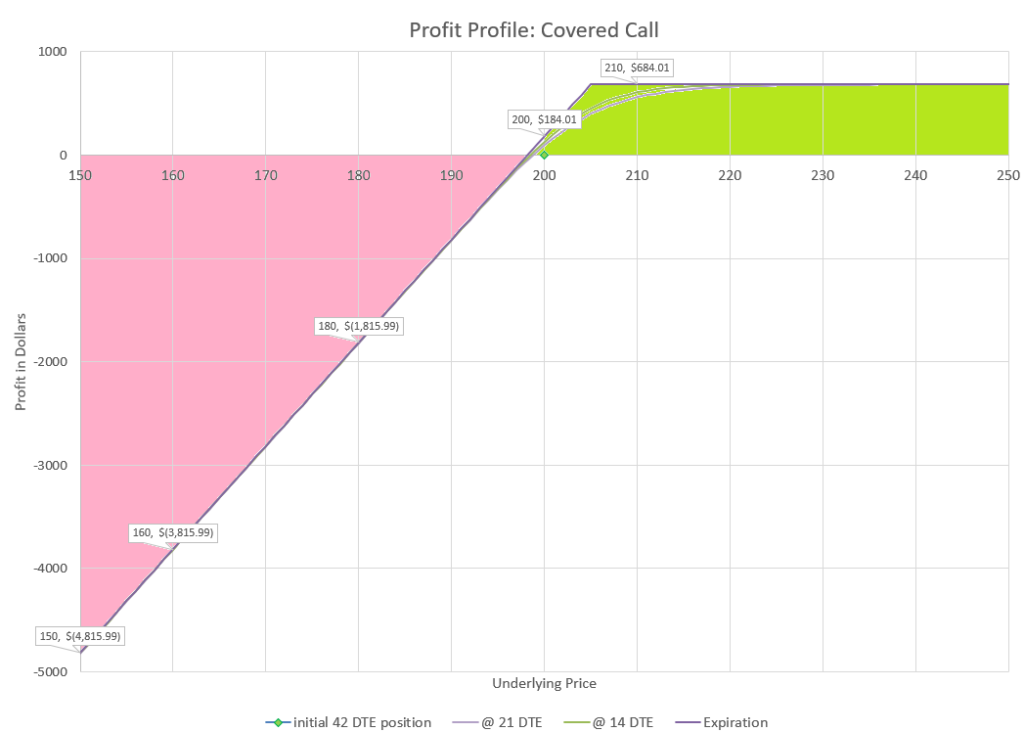
The one negative aspect to this trade is that the upside is capped at a 2.5% increase in price at expiration. The position is being purchased for $19,816 ($20,000 minus the $184 call premium). If the stock price goes above the call strike price of $205, the stock will be sold for $20,500- a total profit of $684, or about 3.4%. Since the option is expiring in 42 days, most people would be happy to make a 3.4% return in less than that amount of time, but there is a possibility that the stock may go up way more, and that gain won’t be available. But how often will that happen? The expected move in 42 days is about +/-6%, so it is likely that we will see this happen regularly. The delta value of the call is 31, meaning that theoretically, the option will expire in the money 31% of the time.
Another interesting point is that with options, price movements initially move in relation to delta, and over time move to the expiration values as the option loses time value. On the profit chart, notice the lines for profit at 21 DTE and 14 DTE. These lines represent the profit values at the mid-point of the trade and a week later. Initially, the position will move 69 cents per share, up or down, for every dollar up or down the share price moves. So, much of the profit near the current price of $200 has until close to expiration to be realized, while movements much further up or down will have less time value, as it is unlikely that time will reverse the move in price. On all option charts for this comparison, I’ll show these mid-trade values, and when we eventually discuss trade management, these values will lead to choices around exiting trades early to manage profits and risk. For now, just realize that values of options decay and this is shown for information on all the profit charts.
A final consideration is assignment risk. Since this strategy sells an option, there is the risk that the buyer could exercise the option. What is the impact? Well, the call that was sold is covered by stock, so if the call is exercised, the shares will be “called” away. Since the call option was a 205 strike, the 100 shares would sell for $20,500. And because the initial position was purchased for $19,816, the net profit would be $684, or 3.5%. So, because the 100 shares were there to be sold when the call was exercised, the assignment was no big deal to the trader or to the brokerage.
Moving on the the cash secured put:
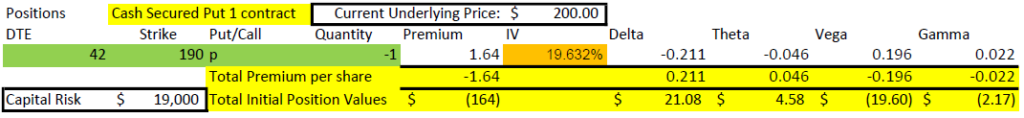
When selling this cash secured put, the broker will reserve $19,000 in the trader’s account that can be used to buy 100 shares for $190 per share. As can be seen from the chart, risk of loss is to the downside, but only after prices drop below the strike price of the put at expiration.
So the difference with stock is that we’ve eliminated losses for small moves down. In fact, we can sustain a 5% down move before being forced to buy stock, and if we have to buy it will be for $10 per share less than the price we are opening the trade at. Many people think of selling cash secured puts as getting paid to buy stocks at a discount.
However, we are putting up $19,000 capital to collect $164. That’s 0.8% for 42 days of waiting. With a delta of 21, there is a 21% chance theoretically that we will be assigned stock and potentially lose money. And if the stock drops a lot, we will lose a lot.
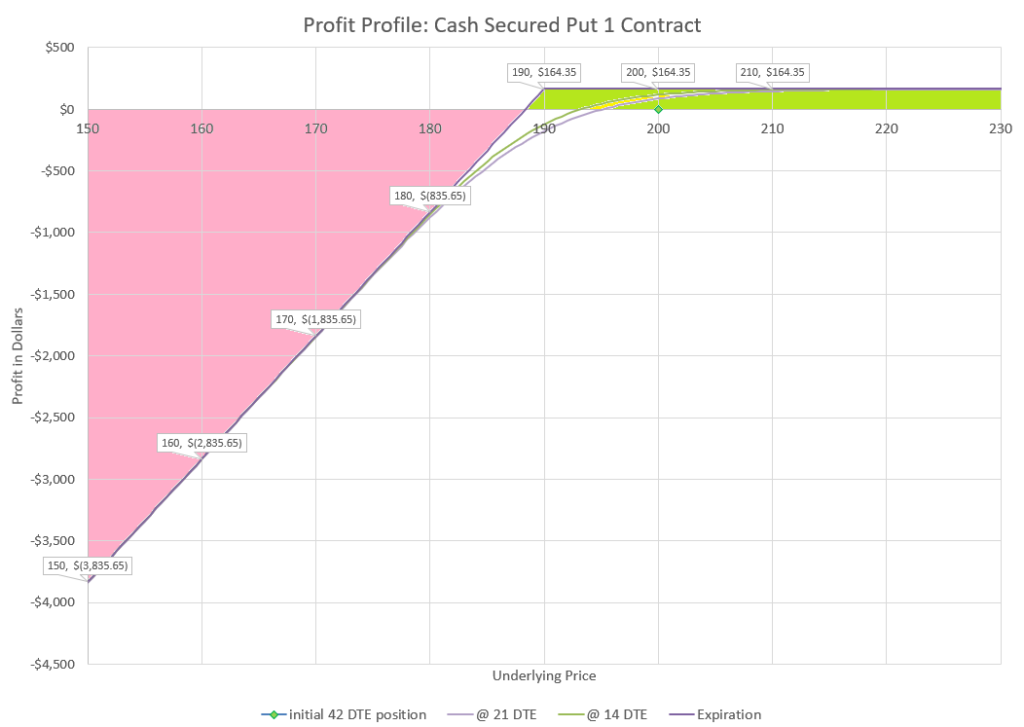
How exactly does assignment work with a cash secured put? If the buyer of the option exercises the option, the seller will be forced to buy 100 shares at $190 per share, or $19,000, no matter what the stock is trading for at the time. But the put option is secured with $19,000 just for this purpose. The broker uses the $19,000 that was reserved to secure the put to buy the shares, and the put seller becomes the owner of the 100 shares “put” to them. Because the money was securing the shares, the assignment is not an issue for the broker, and the put seller will own shares for a net cost of $188.36, based on $190 per share to buy the stock and the $1.64 paid upfront when the puts were sold. Considering that the stock was trading at $200 when the put option was sold, buying for $188.36 might be considered a bargain. So again, assignment is no big deal, and slightly less risk than owning stock.
Notice that the cash secured put and covered call charts have very similar profiles. If the price goes up, there is a defined maximum profit. If price goes down there is slightly less downside than simply owning shares. In both cases, the probability of making a profit is better selling the option than simply owning shares. The only trade-off is that profit is limited, and a big move up move is no better than a small one for the option seller. And in both cases, assignment is no big deal because the possibility is covered or secured at the beginning of the trade.
Level 1- Buying options
For an example of buying options, we will look at one of the most common strategies of option buyers, buying out of the money calls. Since we are comparing strategies, let’s use roughly the same amount of capital, $20,000, to buy calls. In this case, we’ll buy the same strike price as the calls that we sold for the covered call example. But now, we have enough capital to buy 108 option contracts.
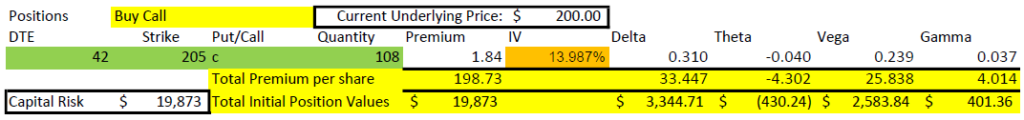
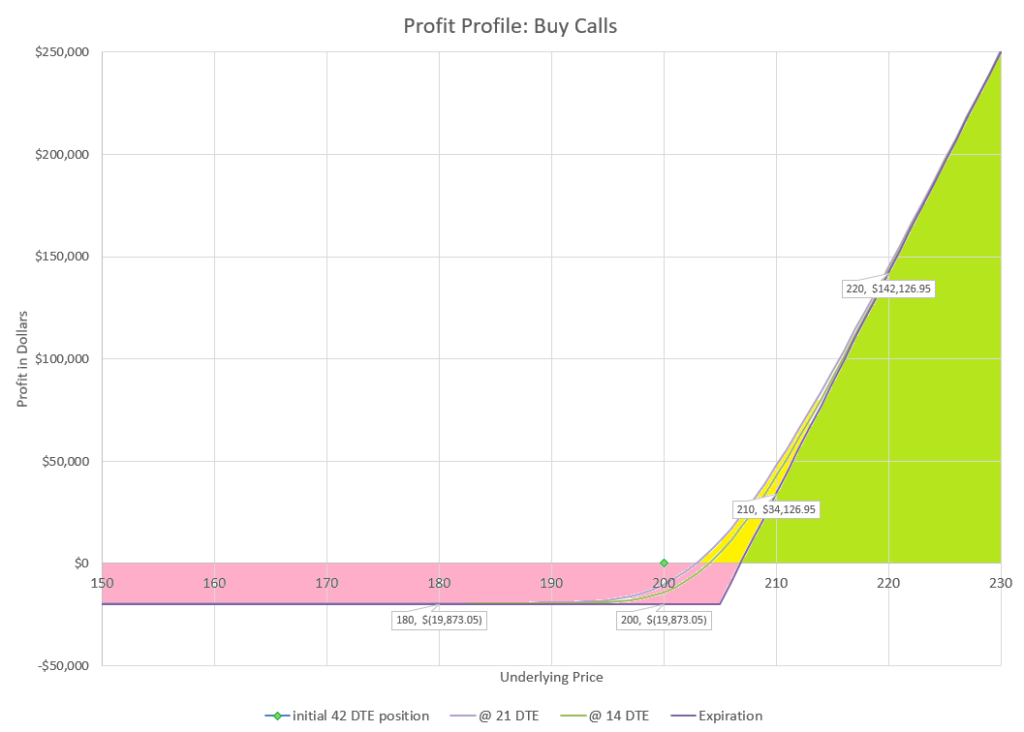
Notice the difference in the scale of the profit chart. In the level 0 examples, the profit and losses were hundreds to at most a few thousand dollars. In this example of using the same capital, the results are tens of thousands of dollars up or down, and with a fairly small movement in stock price.
The first thing to notice is that unless the price gets up above 205 at expiration, the trade will be a TOTAL loss of $19,873. And because the option cost $1.84, the price has to get to 206.84 to break even. With a delta of 31, there is only a 31% theoretical chance of the option doing better than max loss, and even less of making a profit. Said another way, there is a 69% chance of a max loss. Why would anyone want to do this trade?
If we look at the profit side of the trade, look at the result if the stock goes up 10% to 220. The option profit will be $142,127, or 715% return on a 10% move. If we only get a 5% price move up to 210, our profit will be $34,127, a 172% return from a 5% move. The potential profit is theoretically unlimited. However, if we go back to our expected move based on implied volatility, we shouldn’t expect the price to move more that 6% up or down in 42 days. So, to get the really big win, we need a move well beyond what the option market is expecting.
Since this trade is likely to lose everything over 2/3 of the time, we need to make 300% returns on average when we win to break even if we do this trade over and over again and want to come out ahead. The probability of that happening is slim, even in a bull market.
What about assignment risk? As an option buyer, we have the option to exercise the option or not, no one will force us to exercise. Most brokers will automatically exercise options for a buyer at expiration if the option is in the money. But to exercise, the option buyer has to have enough cash to buy all the shares that they have the option to buy. In this case, we have bought 108 contracts, each with the option to buy 100 shares at $205. The cost to do this would be $2,214,000 for 10,800 shares. Only multi-millionaires could even have the potential to have that kind of cash in an account available to make the purchase. More likely, the call buyer would sell the calls back to the market and just keep the profit if the contracts were in the money as expiration was approaching.
If this trade seems really risky and unwise, you may wonder how this is a level 1 risk, compared to level 0, which had less downside risk than owning stock. The answer gets into the issue of where the risk is in relation to the broker and the risk of assignment. When an option is bought, the risk capital is spent up front. The purchase price is the risk. If a buyer wants to spend $20,000 to buy 108 call option contracts, the most they can lose is the $20,000 spent to buy the option. The broker doesn’t have to worry whether the buyer can afford the trade because the buyer has to have money to open the trade- whatever happens after that is no risk to the broker, only to the buyer. If the option buyer wants to exercise the options and doesn’t have enough money, the options can’t be exercised, so again no issue for the broker. The call buyer can sell winning options for cash, so they can make money even if they don’t have the money to exercise an option. Buying options has a limited defined risk and theoretically unlimited reward.
Level 2- Option Spreads
For option spreads, we will look at my favorite strategy, selling an out of the money put spread. Again, we will use $20,000 capital in the strategy for comparison. We will sell the same strikes as we did with the earlier cash secured put example. But, we’ll buy a long strike further out of the money to define risk and use less capital per contract, so we can sell more contracts. In fact, we can sell 40 contracts.
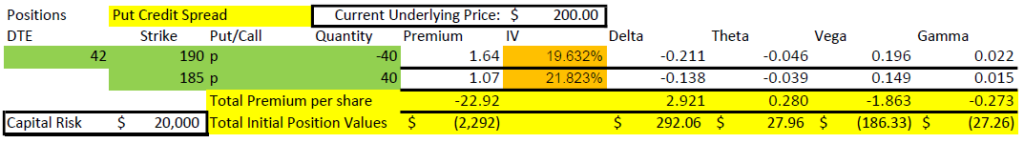
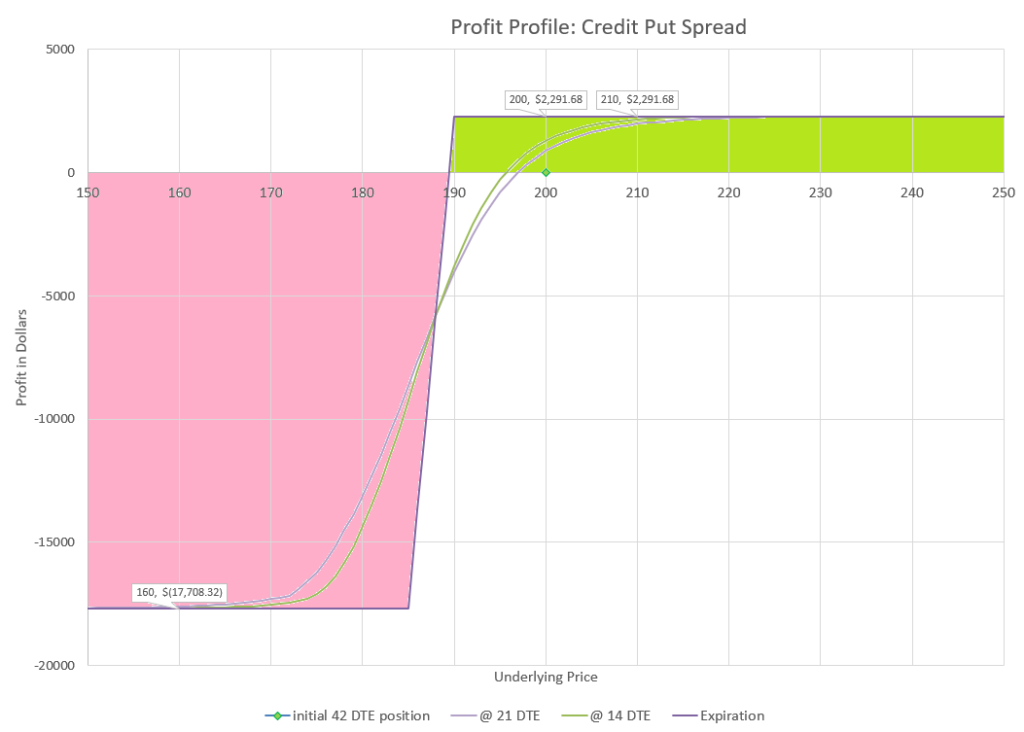
Spread trades have both defined risk and defined reward. Going into a trade, there is a known maximum loss if the trade goes bad, and also a maximum profit if the trade goes well. Looking at the profit chart, the underlying price difference between maximum profit and maximum loss is fairly small. The risk of a credit spread is defined by the difference in values of the strikes. In order to open the trade, the broker requires that the trader have the maximum loss amount available in cash and reserves that amount until the trade is closed.
In this example, the spread width is $5, which is only 2.5% of the underlying value. Because the strikes are well out of the money, the delta value of the short strike is 21, so there is a 79% theoretical probability of reaching max profit at expiration. The long strike that limits the maximum loss has a delta of 14, so there is only a 14% theoretical chance of maximum loss. But that is still a significant risk, and is not far beyond the expected move.
Traders that sell put credit spreads therefore have a high probability of success, but have to be prepared to manage the risk if the trade in the event the market moves too close to the strikes. Trade management to limit losses can be critical to long term success in spread trades.
Spreads can be used in a variety of ways beyond this example of out of the money credit put spreads. Many traders will buy debit spreads, where the long option is worth more than the short option, or sell spreads closer to the money, where the risk is less compared to the reward, but probabilities of profit are lower. And many traders use combinations of spreads to create many common strategies, such as condors and butterflies. Debit spreads generally have maximum risk equal to the premium paid, with a maximum reward equal to the width of the spread less the purchase price. However, all spreads have a defined maximum risk, and a defined maximum reward.
So, if risk is defined by the width of the spread, and can be easily set to a maximum value, why is this strategy a higher level of risk than simply buying an option? Well there are a couple of factors that make this strategy a higher level of risk, the issues associated with assignment, plus the narrow difference between max profit and maximum loss. We’ve already discussed the narrow difference between maximum profit and loss, so let’s dig into assignment issues.
Each option spread has a short option that was sold, and a long option that was bought. The short option has a risk of being assigned at any time. In the event that a short option is assigned, the seller has to come up with cash or shares that might not be available in the account. In our example of 40 short contracts at a 190 strike, assignment would mean being forced to buy 4000 shares at $190 each for a total cost of $760,000. What if the account doesn’t have that much cash? Most brokers require traders with level 2 option permission to be approved for option margin trades, where in the event of assignment of a short option assignment, the broker will buy or sell shares on margin- the brokerage’s money loaned to the trader. The broker knows that the trader still has the long options that protect from a loss exceeding the width of the original spread and the cash reserved for that maximum loss, so loaning the money or shares to satisfy the assignment isn’t a big stretch, but it does add some complexity.
In this example, imagine waking up one morning and finding that your $25,000 account has a cash balance of negative $760,000! At first this may be very scary, until you realize that you also now have 4000 new shares of stock. But what if the stock price is now $180 per share, so the shares are only worth $720,000? If you sell the shares, you are still left with a $40,000 deficit. I’ve been in a similar situation and had to quickly figure out a solution. One infamous novice trader had this happen in early 2021, and the trader thought he had actually lost over $600,000 on a $20,000 account- and sadly committed suicide. He didn’t understand that the cash he owed had bought a bunch of stock that he could use to get out of the situation. What how can this situation be fixed?
Let’s say that we find ourselves with 4000 shares of stock valued at $180 a share and also still have 40 long put contracts with a strike price of $185. We could exercise our puts and force someone to buy our shares for $185, which would lock in our $20,000 loss, less the $2292 we collected at the start of the trade. Or we could sell our shares and sell our long options at the same time. If there is time left until expiration, the long puts will have some time value left and we won’t take the maximum loss. For example, let’s say our long options have a value of $6. If we sell the shares and the puts, we’ll collect $186 per share, or $744,000. It’s less than the $760,000 we had to pay, but only a $16,000 difference and well within the $20,000 cash that the broker has reserved from when the trade was opened.
Generally, brokers are not very patient in these kinds of scenarios. If an account has a negative cash value, expect a call from the broker within a few hours of the market opening asking you to fix the situation. If you don’t act, the broker has the right to take whatever action they think is appropriate to get your cash balance back to positive. They may sell the shares at a big loss and not do anything with the long option, just before a rebound, leaving you with a loss actually bigger than the “maximum” loss.
From this example, hopefully it is clear that the risk can get a little more complex than what is obvious at first and needs a higher level of understanding and management ability than lower levels of option risk. Many of the worst case scenarios can be avoided with attention to the risk at the start of the trade and taking action when needed as time progresses. But unexpected market moves can ruin even the best plans, so spread traders have to always be prepared for maximum loss situations.
While our example was a put spread, if a call spread has a short call exercised, the trader may have to sell shares they don’t have. In that case, the account ends up short shares with a new big cash balance that is less than the cost to buy the short shares. Similar to the puts, the trade will need to be unwound using the long call to provide the funds needed to keep losses within the spread width.
Even debit spreads can have short options assigned, so always be prepared for the risk of assignment with spread strategies.
Level 3- Selling Naked Options
For our naked option example, we will look at selling a naked put. Again we will use $20,000 capital. With naked options, brokers initially require a reduction of buying power to cover a move down to around a 20% reduction in stock price. The broker can adjust this amount if the price goes down, but the requirement is much less than being fully cash secured. Because of this, traders can sell more contracts with the same capital than selling a cash secured put. If we sell the same put strike as our earlier examples, we can sell 7 contracts with our $20,000 capital.
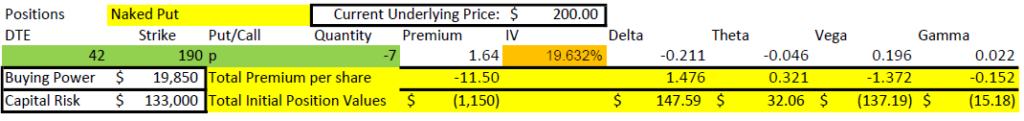
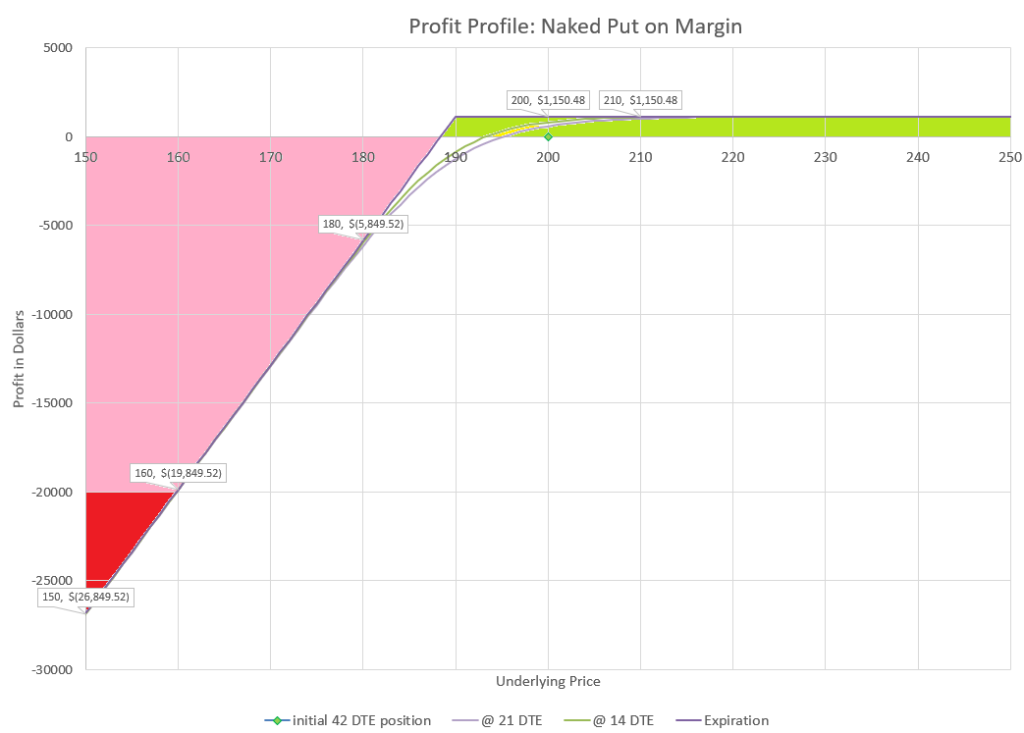
Selling naked options can lead to virtually unlimited losses in worst case scenarios. The probability of these types of moves are low, but are definitely possible. In the chart above, I’ve highlighted where price moves would cause a loss greater than the initial capital required to enter the trade. While there is an actual limit that share prices stop going down at zero, the loss in this example would be over six times the buying power required initially if the stock went to zero.
For naked calls, there truly is no limit. In early 2021 several so-called “meme” stocks shot up several times their value in a matter of days. Call options multiplied dozens or hundreds of times their initial value. Losses for holders of short calls were outlandish. Selling naked calls has truly infinite risk, as there is no limit to how high a stock’s price can go.
If maximum losses are undefined, why would anyone want to do this trade? Let’s compare this profit profile to the put spread we just reviewed. Notice that the premium collected is about half as much with the 7 naked puts as with the 40 put spreads, but it would take a 20% decline to lose $20,000 with the naked put example, compared to only a 7.5% decline with the put spread. This is true for this example and different strikes will have different max loss and different premium available per amount of buying power used, but generally it takes bigger price moves to lose as high of amount in a naked sold option as a spread.
Naked options also have an easier time to roll out for a credit than spreads when options end in the money. Since rolling tested strikes is my top go-to trade management strategy, this is a significant consideration.
What about assignment risk for naked options? It’s pretty simple- the short options can be replaced with stock anytime the options get into the money and then have the same risk profile as the option. However, because the options aren’t covered with nearly enough cash, a trader assigned shares will likely be stuck with a deeply negative cash balance and no choice but to close out the trade at a big loss. In our example above, if the 7 put options were assigned, the cost would be $133,000 to buy 700 shares at $190. If the option seller didn’t have enough, the broker would buy the shares on margin and expect the account owner to resolve immediately. Since this strategy has no coverage or hedge, the account owner is left naked to come up with a solution.
Getting a short naked call exercised can be even worse. The call seller will be required to sell shares they don’t have, and have to borrow shares from the broker. Often shares in stocks that are getting calls exercised are considered “hard to borrow” and require the account owner to pay extra fees and interest to borrow the stock they are selling short. This adds insult to injury and just increases the losses.
$20,000 Capital Risk Comparison Summary
Now that we’ve looked at all these different strategies, let’s summarize the difference in potential outcomes for different levels of option risk. Here’s a table that shows key points from each strategy example we discussed.
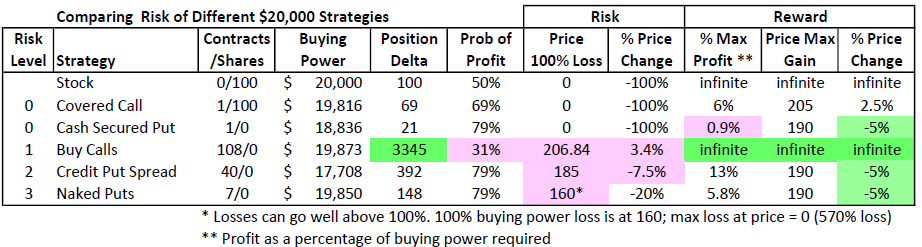
There’s a lot of difference in how underlying price changes will impact different strategies with options. Other than the level 0 strategies, options can reach maximum loss with much smaller moves than the underlying stock. Our example of buying out of the money calls will reach max loss unless the market goes up 3.4% or more, and that is a fairly big move to hope for in most situations. On the other side, all of our short put strategies will reach max profit most of the time, even when the market goes down a little. As long as the stock doesn’t drop more than 5% before expiration, we can keep all of the put premium that was collected.
I don’t think there is anyone that would suggest trading their entire capital allocation in a single option strategy in place of the same amount in stock. As these examples show, fairly small moves can lead to a full loss. From a risk standpoint, naked puts have a very interesting profit/loss chart. While relatively small moves aren’t as likely to take down all of the capital allocated, a really big move could multiply losses to very large losses.
Comparing buying calls to selling puts in our examples shows a big contrast in risk and reward. Selling puts has a high probability of profits, although profits are limited to the premium collected. Buying calls is more of a lottery ticket, likely to lose it all, but having the potential to provide enormous gains for the money when the stock has big up moves.
Another point to notice is differences in leverage that define performance near the current price. Look at the position delta for each strategy. 100 shares of stock is our baseline with 100 delta. Each delta point is equivalent to 1 share of stock. Notice that the level 0 strategies reduce delta and the equivalent share numbers, while the other strategies increase the delta levels. In fact the call buying strategy equates to 33 times as much stock as buying shares, which is why a really big move up can make huge gains, even if it is unlikely.
Finally, remember that for all these examples, we looked at 42 days to expiration option contracts with the stock having an Implied Volatility index of 18. These values would suggest that the options market is expecting the stock to move no more than 6% up or down in 42 days. Use that expected move along with the probabilities of maximum profit or maximum loss to get a sense for what is most likely to happen over the 42 day life of the option contracts and the ending values.
Comparing risk of equal amounts of capital in option strategies is an interesting theoretical exercise, but maybe a better comparison is to look at looking at equal stock equivalent strategies, which we will look at next.
Compare 100 share equivalent strategy risks
As discussed in our review of the Greek value Delta, Delta of a position is a good representation of the equivalent amount of stock that an option position represents. As prices of the stock move up and down, the delta value represents how much an option will move in value. For example, two option contracts with a delta value of 50 will have a combined delta value of 100, which would represent the same price movement as 100 shares of stock. Each option position would move 50 cents a share when the stock moves one dollar, so two 50 delta contracts representing 200 shares would move $100, just as 100 shares of stock would move $100 on a one dollar per share move.
As time passes, and prices change, the delta value will change as well, so this equivalent value is valid only in the immediate timeframe of the evaluation. Even so, it still makes a good point of reference of how an option strategy compares to stock in the short term.
For our next set of comparisons, we will look at replacing 100 shares of stock with an option quantity to match approximately the same equivalent movement. 100 shares of stock always has a delta of 100, the value is static because no options are involved and this is the stock that underlies all of its options that we are comparing.
I won’t repeat the 100 share of stock profit chart or the covered call set-up here, although we will compare them to the other strategies. 100 shares of stock is still 100 shares of stock, and that is our baseline for comparison. Our covered call example is a little trickier, because it had a position delta of 69. If I increased to two contracts, we would have a delta of 138, which is further away from 100 than just one contract, so the example we used already is as close as I can get without changing strikes. If you’d like to review the one contract covered call, just look back to that point in this discussion.
100 share equivalent Cash Secured Put
Recall that our cash secured put strategy had a delta of 21, so we will sell 5 contracts to get to a delta of 105, just above our objective of 100 shares delta equivalent.
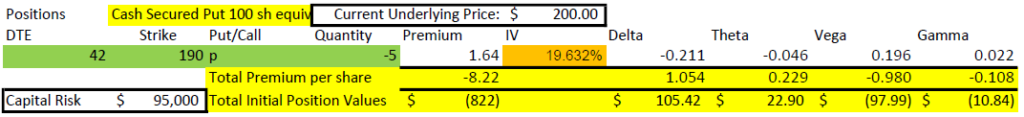
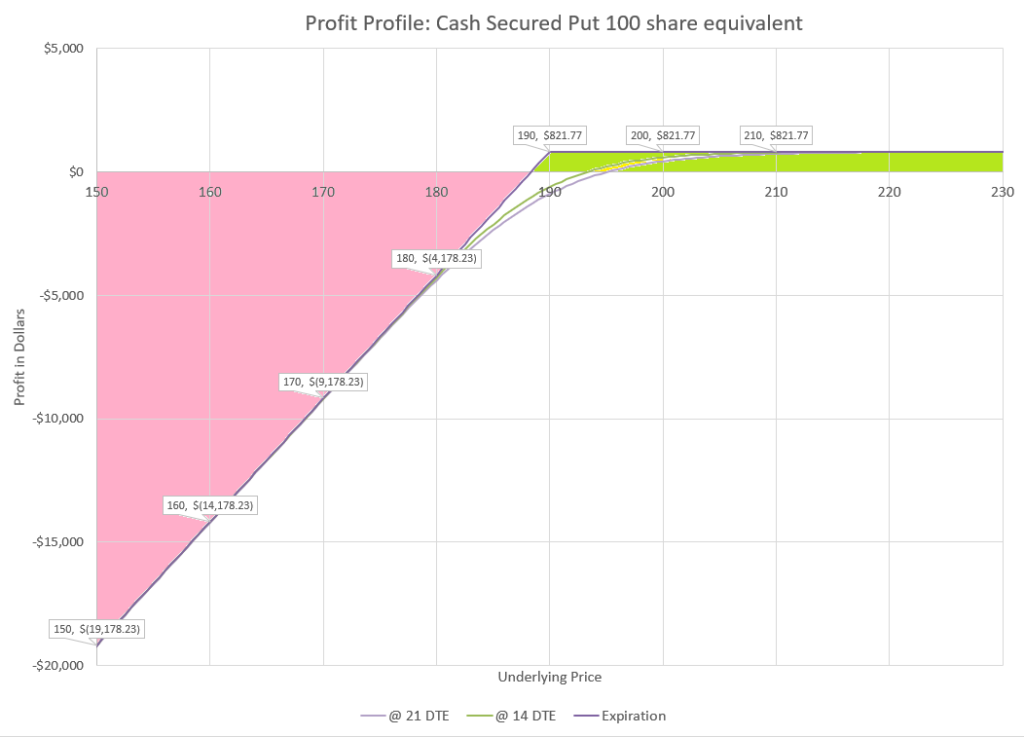
To get the equivalent of 100 shares in short puts, we need to put up 5 times as much capital using cash secured puts. That’s because to the downside we have almost 5 times the risk. 100 shares cost $20,000 while we need to set aside $95,000 in case we need to buy 500 shares for $190 per share.
On the upside, we’ll make $822 if the stock stays above 190 at expiration, and that is 5% below our current price. For stock to make that much, it would need to go up $8.22 or 4.1% in the next 42 days. Since we collect $1.64 premium for selling the 190 strike, the position doesn’t lose money until the price goes below $188.36. Since 100 shares would lose money at any value below $200, the short put strategy beats long stock down to almost a price of $185. Below that the puts lose $5 for every $1 the stock loses. Since it takes 5 times as much capital to get this performance, this might be a hard position to put on for most traders. Perhaps we should skip ahead to a very similar strategy for a better comparison.
100 share equivalent Naked Put
While we are discussing selling puts, I think we should discuss our risk level 3 strategy of selling naked puts on margin. This is exactly the same trade, except that as a trader approved for level 3 trading, the brokerage will require only a fraction of the capital to be used for buying power, because it knows that the probability of a loss of over 20% in stock price is very low. So, let’s look at this trade and compare.
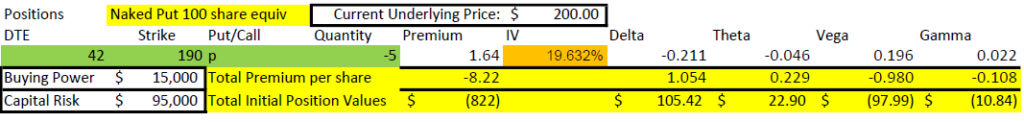
In this example, the same trade only requires $15,000 buying power. So, we can get the equivalent of 100 shares price movement in short puts for less than the cost of 100 shares of stock. We get the same profit and risk profile as we did when the account was cash secured, but we don’t have to come up with the cash up front that a cash secured account required.
Even though the broker isn’t requiring as much capital for this trade, the risk for a far out of the money move down is still the same. As prices drop below $185, further losses on the puts are five times as much as 100 shares of stock because we have 5 contracts representing 500 shares. At expiration those contracts will either have a delta of 100 or zero, depending on whether they are in or out of the money.
Either way we allocate capital to this trade, our initial position will go up and down in value approximately equal to the amount 100 shares move. However, we will have theta working for us, initially making us approximately $22 a day. Our most likely outcome is that we will end up being able to keep our $822 in premium. If we did this trade using margin in a level 3 option permission account, we would have a return on capital of 5.5%. If this was a cash secured trade, we would have made 0.9%. Either way, that isn’t bad for 42 days of waiting.
Buying calls equivalent to 100 shares
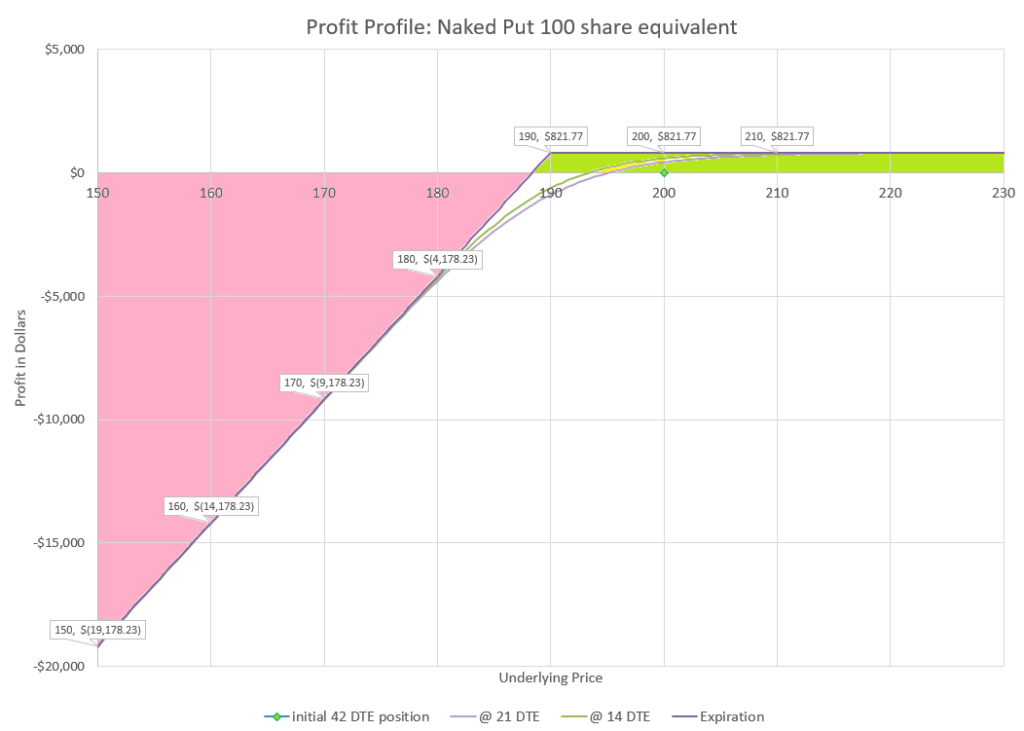
I decided to change strikes for buying calls to 204.50, so that I would have a delta of 33. That way, 3 contracts would be 99 delta, getting very close to our goal of being equivalent to 100 shares.

Probably the best part of buying calls in our example is that we pay only $809, instead of $20,000 to have the equivalent of 100 shares at opening of this trade. That’s the most this trade can lose, so a price move down more than $8.09 would be a bigger loss with shares, while a move up over $10 would be bigger profits for the call strategy. However, any place in between, a better outcome would be owning shares on a dollar basis.
If we consider return on capital, we lose 100% if the price doesn’t go up at least 2.5%, and we make over 100% if the price goes up over 5%. So, the difference between a total loss and doubling our money on the trade is not much, although price needs to go up to even have a chance to keep any of the money spent on this trade.
The yellow highlighted area of the profit chart shows where there is profit prior to expiration beyond what will be available at expiration at that price. Time decay significantly works against this position. It may make sense to have a trade management strategy to take earnings off the table and reduce risk when price moves up early in this trade.
Whether we put a large amount of capital or small into this trade, the key risk is the low probability of profit. Buying out of the money calls is something of a gamble. There are mostly two types of outcomes, a total loss, and an occasional big win.
Put credit spread equivalent to 100 shares
Using the same strikes that we used in our earlier put credit spread, one contract is only 7 delta, the difference between our short strike of 21 delta and the long strike of 14 delta. So, we will need to sell 14 contracts to have approximately the equivalent of 100 shares of stock.
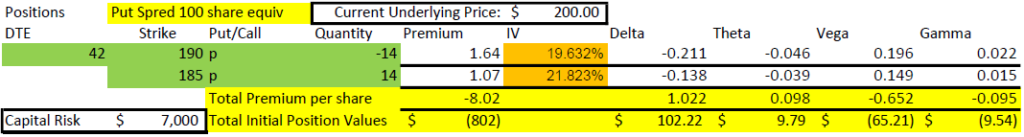
Selling this put spread takes more capital than the example of buying a call, but less than the examples of selling puts (either naked or cash secured). For less than one third the capital requirement of buying shares, we can have a position that has a theoretical 80% probability of making a 13% return in 42 days. On the risk side, we would theoretically lose all of our capital 14% of the time.
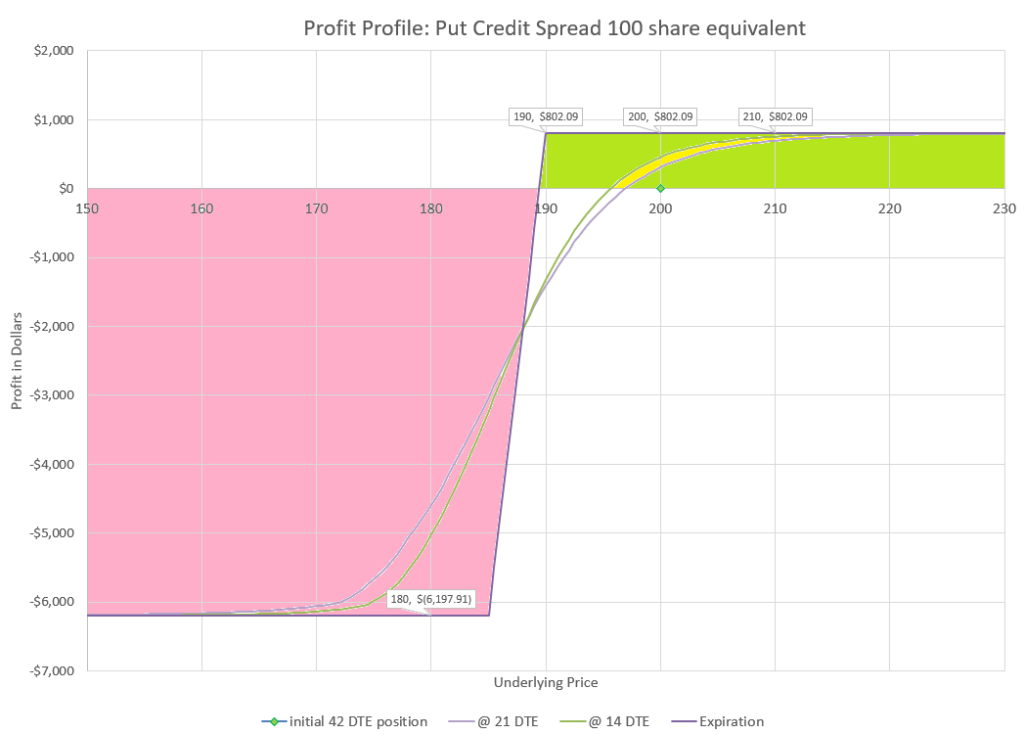
The outcomes of this trade are almost exactly opposite of the call buy example we just looked at, in terms of where the trade outperforms and underperforms owning stock. Since we are receiving $802 premium at the start of the trade, the stock owner would need a prices to rise to 208.02 to outperform this trade to the upside. If the stock goes down, our spread starts losing more if the price drops below $189. While our risk is defined, the stock would have to drop $62 in share price to lose more than the maximum loss of this put spread, which is extremely unlikely. If stock price movement is less than expected, this trade wins outright, as well as in comparison to all other strategies we’ve looked at including owning stock.
The big risk is that a move down beyond the expected move can cause a total loss of capital, which is much more significant than the losses of the other strategies we’ve looked at. Other strategies either have less to lose, or would need a much bigger move down of the stock price to lose as much. Having a trade management strategy to control losses becomes a priority to preserve capital with this strategy.
100 share strategy comparison summary
Using delta we can approximate equivalent shares for the different strategies we have reviewed. Following is a table summarizing the comparison.
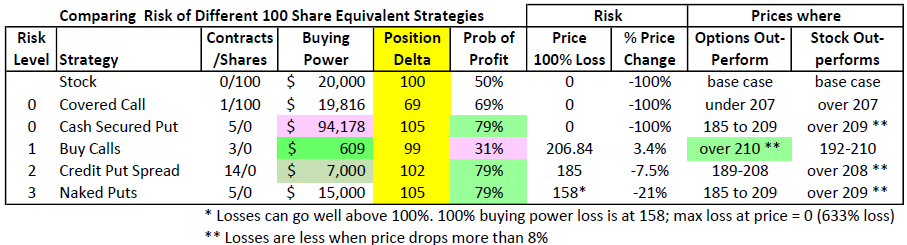
While each different strategies fares better in different scenarios, some of the strategies have very different requirements. Notice that buying calls requires much less capital than cash secured puts for the same equivalent price movement. That is the most stark difference between strategies and is highlighted above.
The profit percentage comparisons are essentially the same for equivalent shares as equal capital, so I didn’t include them in this summary table to save space. Look back at the first table if you want to make those comparisons again.
Keep in mind that the share equivalence of these examples are only equivalent when the trade is opened. If the underlying stock goes up one dollar the first day of the trade, each example position will profit approximately $100. The measure of equivalence is useful to understand how leveraged a portfolio of options is at any given time. It also can be used as a short term method for substituting options for stocks. However, as expiration arrives the options move to delta values of zero or 100 per contract, so equivalence is ever changing.
There are strategies that better maintain share equivalence, but that wasn’t the point of this exercise, so I’ll save that discussion for another post. The point of this post was to compare risk, reward, and capital requirements of different strategies.
Final thoughts
These examples of different option risk levels are only a single sample of outcomes possible from trading options. I have attempted to illustrate commonly used versions of each type of risk. Choosing different strikes, different expirations, and different volatility environments will significantly change the possible outcomes. This comparison is meant to give readers an idea of how risk can be controlled or magnified in one or both directions by choice of strategy and explain reasons why one might want to take on more or less risk.
I’d like to share your content with my followers. I’ve been trading options since the last century and I keep trading size modest and live very comfortably. My own site, while the domain is owned by a dear friend and fellow trader, was rather randomly conceived. He told me about owning the domain name and had not done anything with it, so would I like to do something. I said “like what?”. He said ” What about a trade every week”. I said “you’re nuts nobody does that”. Here we are 320+ weeks later and yes a real trade published each Saturday using real prices. I keep it very basic and share knowledge such as yours, when permitted to do so. My content is free, genuine and hopefully encourages people to get into trading, though barriers to entry are substantial in the UK. Options are a passion, my livelihood for many many years and I do not want to see the demise of the retail trader in the UK, while the horrible gambling sites and CFD platforms seem to attract millions. Of losers.
@TerrapinTrader, yes, please do share this content with your readers. I appreciate the vote of confidence.
Interesting that you choose to use the term “options investing” for a site. Just last week I was at a party and got into a discussion regarding options with an old friend that I hadn’t seen in years. He started by saying how he thought options were risky, and then made a number of points, frequently saying that he was “an investor, not a trader.” I explained that the level of risk in options can be less than owning stock outright, but it all depends on how options are used. Throughout this site, I often refer to options as a way to leverage or de-leverage positions. So, from that standpoint, options can definitely support long-term investing. And in a broader sense, option trading when managed in a risk-balanced portfolio, is truly just a different way of investing. I generally have avoided describing options as an investment due to the short durations and the potential controversy in making an assertion that options can be an investment. But with much of my capital consistently tied to options, I can’t deny that options are how I invest. Cheers!