This post lists recent additions and changes to the website. For frequent users, this change log might be helpful to see what has changed from past visits.
The following is a listing of recent additions and changes to the site. For frequent users, this change log might be helpful to see what has been added new or changed.
April 13, 2026: Added a new page on rolling Daily Double Diagonal trades. A four legged trade with calls and puts, long and short. A very high risk, high reward trade.
January 13,2026: Added a new post on using a household balance sheet. Slightly off the topic of options, but something every trader should use in some form or another.
December 1, 2025: Added a new page on Best Option Order Entry Practices. Sometimes, it’s good to get into the nuts and bolts of trading a bit.
October 14, 2025: Added a new page on Rolling Credit Put Spreads. While I’ve written about this before, this is a more thorough version explaining how rolling works mechanically with put spreads.
September 17, 2025: Added a short post explaining that the site was back up after a week down. I appreciate the patience of all who had to wait, and the persistence of those who found ways to reach out to help get the site back up.
August 2, 2025: Added a page comparing the 111 and 112 put ratio trades. It’s been a year since the Implied Volatility blow-up that crashed so many naked traders, so it seemed like a good time to re-visit.
June 26,2025: Based on popular demand, I’ve added a page on selling covered call spreads. This strategy allows a trader to collect premium on existing shares without giving up all the upside potential if the stock goes up a lot.
March 13, 2025: Added an update to the Very Long and Very Short Diagonal Put Trade. This trade becomes truly unmanageable during extended down markets, making it an interesting concept to study and test, but not viable as an ongoing practical strategy.
February 9, 2025: Added a page with an updated write-up of the Delta Neutral Back Ratio Call Spread, as featured in the new YouTube video interview with John Einer Sandvand from ThetaProfits.com. This is an updated analysis from an earlier page on the same topic.
January 14, 2025: Added a new page on the Daily Diagonal Covered Put trade. This is similar to the earlier Very Long Very Short Diagonal, but with much shorter duration and less capital required. I even included a backtest.
December 16,2024: Added a new page for the Very Long Very Short Put Diagonal Trade. This trade, also a version of a “Poor Man’s Covered Put” has much more to than what one would expect at first glance. However, this trade has elements of almost every aspect of options there is, so a lot to study for every option trader.
October 2024: Lots of new comments from readers and responses on various pages of the site. Keep those questions and ideas coming!
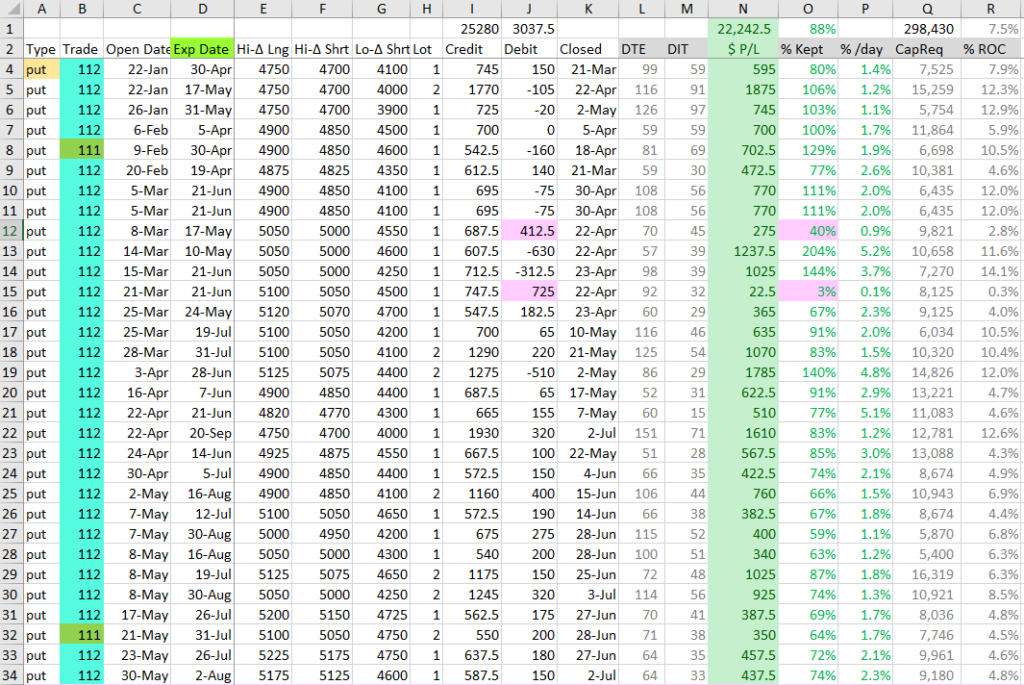
August 24, 2014: Added an update to the page about 100% success in the 112 trade to highlight the issues with the August 5 volatility debacle that did wiped out many 112 traders.
July 23, 2024: Added a new post sharing results from the 112 trade in the first half of 2024. 100% success.
July 2,2024: I added a new page contrasting debit vs credit option trading strategies. It’s one of a few considerations traders should consider when picking strategies that work best for their style of trading.
May-June 2024: Lots of new comments and replies came in from readers. Always good to hear from folks with their questions and comments.
December 30, 2023: I added a couple more books to the Resources page. I also updated Tasty links for their new TastyLive.com URL.
December 20, 2023: Made a number of changes and additions to the home page of the site. With all the new content, it seemed like it was time to highlight some of the content that isn’t as obvious.
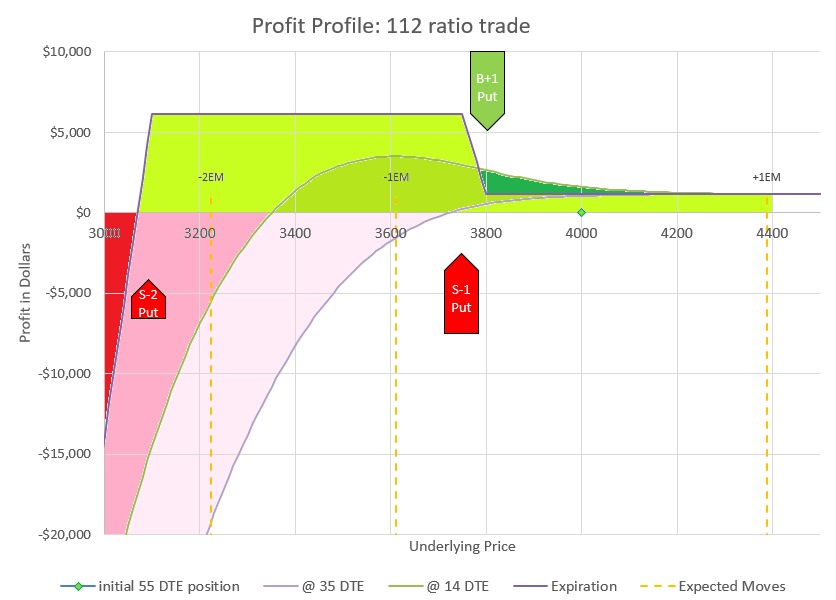
November 22, 2023: Added a duplicate post on the 1-1-2 Put Ratio Trade. I did this to capture the search engine traffic from the numbers of traders looking for information. So, whether it’s 112 or 1-1-2, there’s a write-up. Just read one or the other- they are the same.
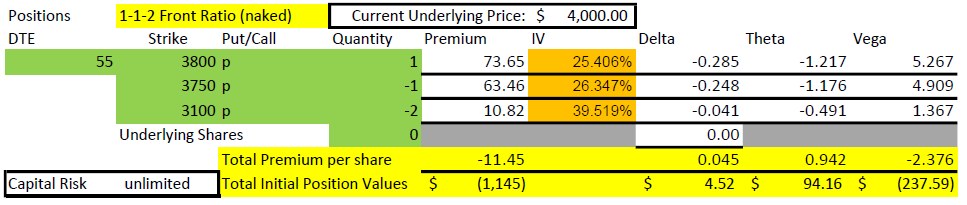
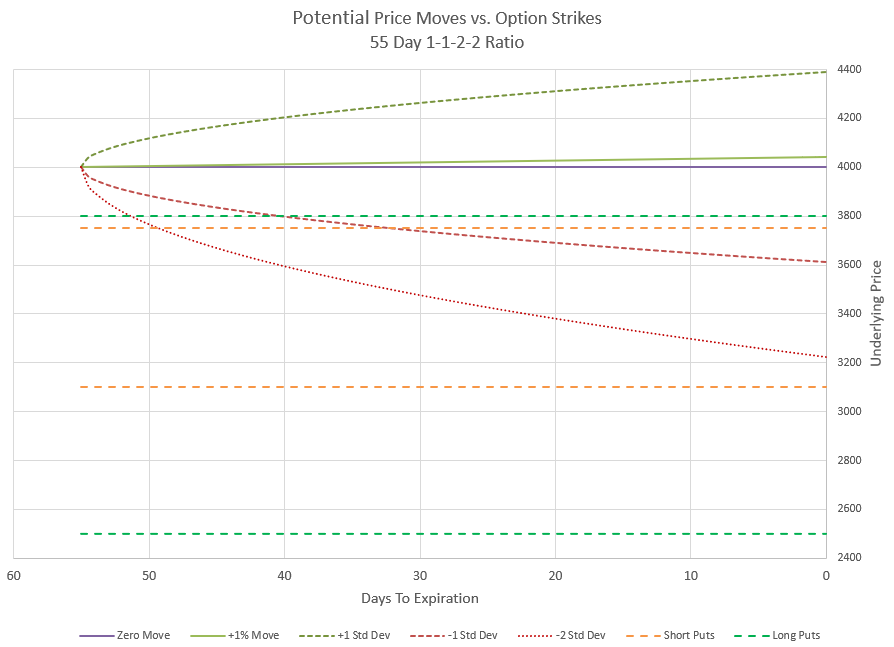
November 14, 2023: Added a page on the 112 Put Ratio Trade. While I mentioned it a bit in the post on the 1112 Put Ratio Trade, I decided the naked option version deserved a write-up of its own.
September 19, 2023: Added a page on Covered Calls. Yes, I know I just wrote a post on the same subject. (Secret note: the write-ups are exactly the same. This is actually a test to see if pages do better than posts in getting search engine connections. Universally, my most read articles are always pages, but maybe that’s just a coincidence. Most readers would never recognize the difference between a page and a post, but posts are supposed to be part of an ongoing blog, while pages are more “permanent.” I’ve used them interchangeably, and I want to make a data-driven decision on what the impact of that choice is.)
September 18, 2023: Added a post on 5 Bullish Call Trades. This is the culmination of a series of trades that I felt like I had overlooked regarding data driven ways to utilize calls in a bull market without absorbing too much time decay. With the market in what appears to be a bull market, it was time to focus in on this topic. 4 of 5 of these trades have recent extensive write-ups that were completed in the past 3 months.
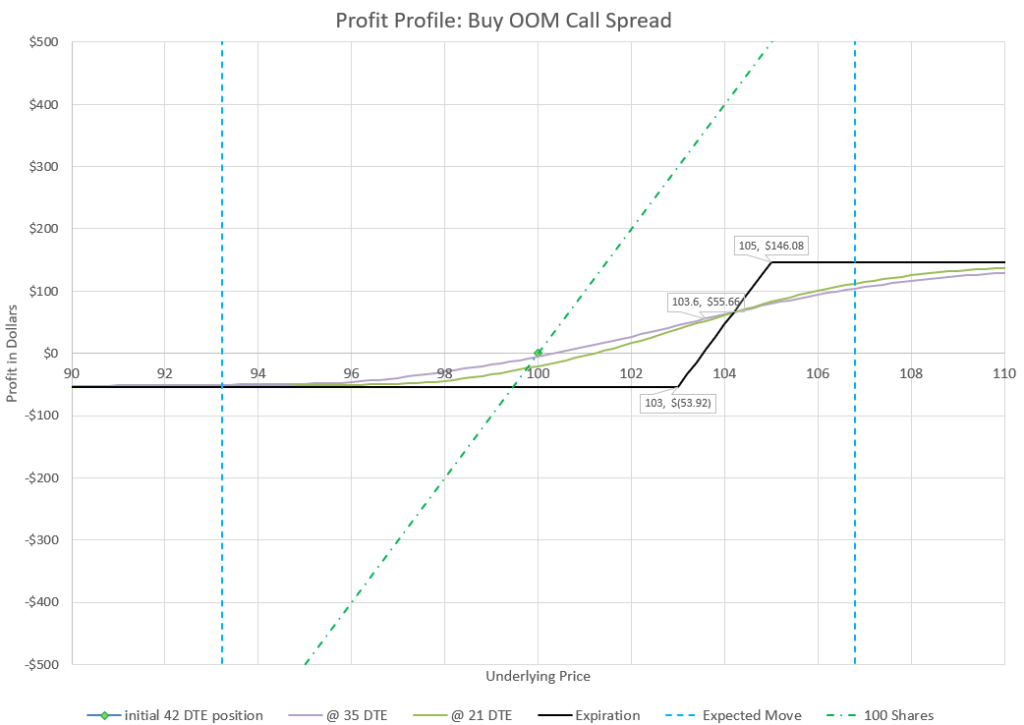
August 4, 2023: Added a post on Buying Out of the Money Call Spreads. This is a strategy that would appear to most option traders who mostly sell options to be a sure loser, but back-testing shows it to be quite profitable over time.
July 26, 2023: Added a post on the Poor Man’s Covered Call, a low cost variation of a Covered Call, based on selling a call against an in the money long call that acts as a replacement for stock. So, a bit of a cross combination of the two most recent previous write-ups.
July 25, 2023: Added a post on Covered Calls. Not sure why I never wrote one before, but given it is one of the most popular option trades around, I thought it was time to weigh in on it with a level of detail that isn’t available many places.
July 5, 2023: Added a post on Replacing Stock with a Call Option. When markets are going up and IV is low, buying calls can be a good way to get in at a low cost. This post goes into more detail.
June 19, 2023: Added a post on Underlying Security vs Risk Permission. There are a lot of factors to picking the type of security to buy or sell options for a specific type of trade. This post digs into what to consider and why some approaches may be better than others.
May 24, 2023: Added a post on Trading Options while working a Full Time Job. I went back to work this year and changed my trading routine. I know many readers can relate, even if they just want to make better use of their time.
May 20, 2023: Added a chart to the 1 DTE Straddle post to show profit and loss at various times of the day.
May 17, 2023: Added a post on Covered Strangles, a conservative options trade that reduces volatility with higher probability of profit than owning an equivalent amount of stock outright. It’s my first deep dive into Level 0 option trades, something I’ve had a number of requests to address.
February 27, 2023: Added a new Phone Stock Charts page with stock price charts formatted for a smart phone, and potentially screen-cast onto a monitor or TV. Not for everybody, but if this is something you are looking for, like I was, you’ve found it.
February 27, 2023: Updated the Current Prices page with more interactive charts, replacing those from a previous provider that had security flaws.
February 26, 2023: Added a post on the topic of 0 DTE trades.
January 16, 2023: Provided responses to a couple of great reader comments and questions regarding the 1-1-2-2 trade.
January 13, 2023: Added a new post on my 2022 learnings.
December 23, 2022: Added a post regarding the best Delta for ROLLING put spreads. This is a new topic that I had curiosity about from years of observing that some rolls do better than others, and I couldn’t figure out why.
November 28, 2022: Accepted an extended comment to the page Rolling Iron Condors and added a response. Comments are always welcome and appreciated. Note that comments from first time commenters must be reviewed and accepted to keep those crazy spammers from ruining the site.
November 9, 2022: Response added to a comment about how to roll a back ratio call spread up or down to get back to Delta neutral.
November 3, 2022: Added a new page on Options Margin Usage. In this page, I compare different types of margin available for option traders and the benefits and risk of each.
October 15, 2022: Worked with the ad provider to reduce the number of ads on the site and make them less obnoxious. Should be no more pop up adds when changing pages, and less ads per page.
September 30, 2020: Added a new page explaining how brokers permit different levels of risk in option trading.
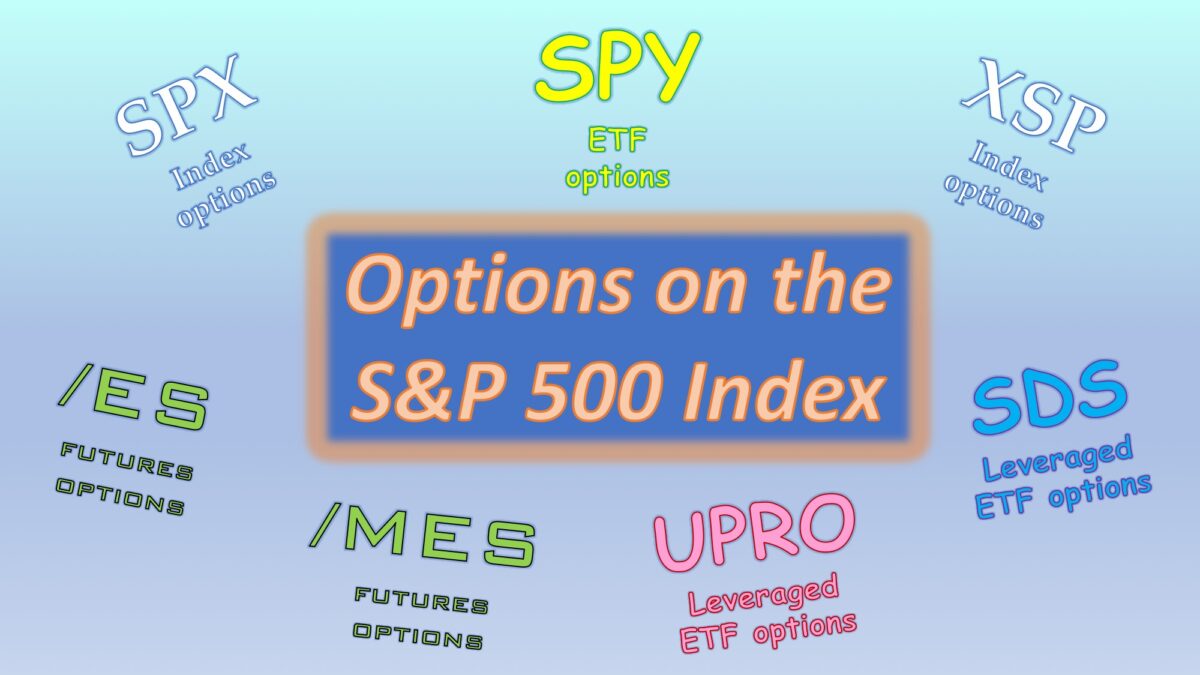
the S&P 500 index is very appealing but most traders don’t know there are at least 7 different great choices for options tied to the index
For many new options traders, trading the S&P 500 index is very appealing for a number of reasons. But most new traders are not aware that there are at least 7 different great choices for options tied to the index. Most have multiple expirations each week and are very liquid. Each choice has unique differences from the others that may make it appealing in certain circumstances. For a long time I was only aware of one way, and when I now tell others about these additional choices for options, it’s usually a pleasant surprise.
Background
The S&P 500 index is the most quoted benchmark of the stock market for good reason. It is made up of the 500 largest US publicly traded companies. The index is weighted by market capitalization of each firm, so the largest companies have more impact on the index than smaller ones. In fact, as of this writing, the seven largest firms are responsible for 30% of weight of the index. While the news media often leads market reports by sharing the Dow Jones Industrial Average, most traders and asset managers pay little to no attention to the Dow because it only includes 30 stocks and has a bizarre price weighted averaging system that gives the most weight to companies with the highest price per share.
If a trader can choose only one investment to own, some form of the S&P 500 index would be the most logical choice. When selling options, unexpected moves outside of expectations can lead to large losses. Many studies have shown that the S&P 500 index is much less likely to have an outsized move than individual stocks or even other indexes. TastyTrade has done numerous studies on this that are free to review. So options on the S&P 500 index can be a large part of a trader’s strategy. Understanding the variety of choices for trading options on the S&P 500 can be very helpful for traders of all experience levels.
Mutual Funds?
Almost every employee retirement account offers a mutual fund that mimics the S&P 500 index. While mutual funds are great for retirement accounts that rarely change holdings, they aren’t that useful for trading in general, and specifically not for options. There are literally dozens of mutual funds based on the S&P 500, but they share the same trading issues- they only trade at the closing price of the day which isn’t known until after a trade is submitted, and there aren’t options on any of them. Active traders want to be able to buy and sell at any point in the trading day and have options for hedging or amplifying returns, so mutual funds just won’t cut it.
Exchange Traded Funds
In recent years, exchange traded funds (ETFs) have grown in popularity. These funds are structured to match the holdings of underlying indexes or other trading strategies. The funds actually hold shares in the index that they are matching performance with. By far the largest ETF is the SPDR S&P 500 ETF Trust, which goes by ticker symbol SPY, and follows the S&P 500 index. It is priced at approximately 1/10 the price of the index per share. So, if the S&P 500 index is priced at 4500, the SPY ETF will be priced around 450. The SPY price isn’t exactly 1/10 of the S&P 500 index price, but slightly less by varying amounts. The variations are due to fees that come out of the ETF, and the impact of dividend payouts. SPY pays dividends once a quarter, and the price of SPY gets closer to 1/10 of the S&P 500 index as the dividend payment approaches and then drops after the dividend is allocated. Generally, the variation is less than one dollar in SPY, so if the S&P 500 index is trading 4500, SPY is likely to actually trade at somewhere between 449 and 449.50. For most traders, this difference isn’t a big deal, but just a minor factor to be aware of when comparing SPY to the S&P 500 index. Because of its name and ticker, SPY is often referred to as the “Spiders.”
SPY option contracts are based on 100 shares of SPY. If an option is exercised or assigned, the option seller will either be forced to buy or sell 100 shares of the SPY ETF. Because SPY pays a quarterly dividend, traders who sell calls on SPY need to be aware of the risk of having the call option exercised on dividend day. If a trader has a call near expiration that is at the money or in the money, it will likely be exercised because the dividend can be captured by the owner of the stock. If the call seller doesn’t have shares to be called away, and the option is executed, not only will the seller be short shares of SPY, but the seller will have to pay the dividend to the broker that they are borrowing the shares from. Only call sellers have to worry about this, but it is a real consideration four times a year.
Both SPY and options on SPY are extremely liquid with bid-ask spreads normally at one penny. I’ve found option trades that include four legs, can usually be filled immediately for two cents away from the mid price of the combined bid-ask spreads of all the legs. Options are priced in increments of one cent, so pricing can be fairly precise. SPY options have 3 expirations per week, with contracts for every Monday, Wednesday, and Friday. Adjustments are made for holidays when markets are closed. Every expiration has dozens of strikes, going several expected moves above and below the current price of SPY.
While SPY isn’t the only ETF to track the S&P 500 index, it is the predominant one, and really the only ETF to really consider for trying to match the performance of the actual index. There are a couple of other ETFs to consider that are designed to magnify or reverse the performance of the S&P 500 index. For some strategies, these might be helpful.
UPRO is an ETF from ProShares that is leveraged to deliver 3x the performance of the S&P 500 index. Officially, it is called the ProShares UltraPro S&P 500 ETF. So, if the S&P 500 index goes up 1% in a day, UPRO will go up 3%. However, the reverse is also true- if the S&P 500 index goes down 1% in a day, UPRO will go down 3%. To keep this relationship working, the holding in the ETF are adjusted each night, so over time the ETF won’t exactly keep pace at 3x the performance. The ETF relationship is more precise day by day than longer term, but will be relatively close to 3x. UPRO has options expiring every Friday and is somewhat liquid with wider bid-ask spreads than SPY. Because of large swings in price, the ETF has occasional splits to keep the share price reasonable, and the daily adjustment of holdings can alter the precision of the leverage factor, so the share price isn’t consistently convertible to a multiple of the S&P 500 index.
The opposite effect is achieved from the SDS, or Proshares Ultrashort S&P 500 ETF. SDS is set up to delivery -2x the performance of the S&P 500 index. So, if SPY goes up 1%, SDS goes down 2%. Over time the price of SDS tends to get lower and lower, and a reverse split is needed to get the price up to a reasonable level. Options on SDS also expire weekly. Both SDS and UPRO options are based on 100 shares of the corresponding ETF.
Options on leveraged ETFs are much more volatile than on non-leveraged ETFs. Because traders of these options know that there is multiple times price movement, options are priced accordingly. Because of this, strategies with options can perform very differently than with options based on the non-overaged SPY. The switch from SPY options to UPRO or SDS options is not as simple as it might appear, so research thoroughly before jumping in to these unique options.
There are other ETFs that follow the S&P 500 index as well as others that leverage the S&P 500, but they don’t trade with as much volume, and their options trade less frequently. Why trade a product that is less liquid, with fewer options, and much lower option volume when a better choice is available? I see no reason to use anything but SPY, UPRO, and SDS.
There are also ETFs that represent sectors or portions of the S&P 5oo, or weight the 500 stocks of the index equally. So, for value vs. growth, or Finance stocks or Utilities, there’s are ETFs with options of every flavor. But none of those represent trading the full S&P 500 index, so we won’t dig in any further into those products, because the point of this discussion is ways to trade the benchmark index.
For most traders, SPY options are the only options on the S&P 500 index they use, and many traders aren’t aware of any other choices for trading options on the index. But, we’ve only just begun.
Index Options
Why trade options on an ETF based on an index when you can simply trade options on the actual index? Index options remove the ETF from the mix and link options directly to the index. For the S&P 500, there are two index options available, SPX and XSP. SPX is literally the S&P 500 Index, and XSP is the Mini S&P 500 Index.
Traders are often not aware of these ticker symbols or the fact that options are available for these two indexes. There are a couple of reasons for this. There is no way to actually buy or sell the actual S&P 500 index directly, a trader can’t buy or sell shares of SPX. Additionally, since SPX is an index and not a stock or ETF, many brokerages don’t show it as SPX. For example, Schwab lists it as $SPX. Other sites may show it as ^SPX or .SPX. The point is that you have to know what you are looking for to even find it. Since SPX is literally the S&P 500 Index, it is priced at the full price of the index. So, if the S&P 500 Index is at 4500, SPX is at 4500. They are exactly the same.
Okay, SPX is the S&P 500 index. But, what is the Mini S&P 500 index, you may ask? XSP, or the Mini S&P 500 is simply an index that is 1/10 of the S&P 500. However, unlike SPY, which is approximately 1/10 of the S&P 500 index, XSP is exactly 1/10 of the S&P 500 index. Why do we need an index that is 1/10 of another index? It’s all because of options and sizing of positions.
Options on SPX don’t represent 100 shares in SPX because SPX doesn’t have shares. Instead, SPX options represent a value of 100 times the value of SPX. Think of it as if SPX had shares and the options represented 100 shares, even though there aren’t any shares. XSP options represent 100 times the value of the XSP. So, in both cases we still have a multiplier of 100 as we do with ETF options. This is where the similarity in options end.
One difference is that dividends are not part of the S&P 500 index. Many of the 500 stocks in the index pay dividends at various times throughout each quarter, and those payments have an impact on the individual stock price, which will then impact the price of the index. But the index has no mechanism to pay dividends because it is just an average of the prices of the 500 stocks it tracks and isn’t tradable itself. So, option buyers and sellers of SPX and XSP don’t have to consider dividends as an event, like traders in the SPY ETF.
Since index options can’t be settled in shares, they settle in cash when they expire. In many ways, this can be a lot easier. If an option expires $5 in the money, a call buyer will receive $500 from the account of the call seller at expiration because of the 100 multiplier. If an option expires out of the money, it is worthless and there is nothing to settle.
Cash settlement can be a bit confusing at first, so just realize that there is nothing to actually buy or sell from assignment- a put seller that is assigned doesn’t have to buy 100 shares, they just have to pay the difference in the current price at expiration from the strike price of the option. If the trader sold a put on a stock or ETF, they would be assigned shares that they would buy for more than the current price, which they could turn around and sell at a loss. Index options eliminate the step of buying and selling shares, and just settles the difference in price with cash.
Index options use European style option assignment, while stock and ETF options use American style options. American style options can be executed at any time by the option buyer, and this becomes a consideration for option sellers that have positions in the money before expiration. However, European style options can only be executed at expiration. So, sellers of index options don’t have to worry about having an early assignment before expiration, and buyers don’t have that option. And since index options are cash settled, there really isn’t an “option” at all. In the money index options are simply “settled” at expiration.
SPX options have lots of different expirations. Originally, these options only had expirations once a month on the third Friday of the month. Later, month end and quarter end expirations were added. Then weekly expirations every Friday were added. And now there are Monday and Wednesday expirations. Soon, maybe by the time you read this, there will be options expiring every trading weekday when Tuesday and Thursday are added.
One holdover from the original monthly expiration is that monthly index option expirations are different than all the other expirations in a couple of ways. First, and most importantly, monthly index options expire in the morning (AM) of expiration, while all other expirations expire at the close (PM) of trading. For SPX, there are actually two option expirations on the third Friday of the month, the monthly AM expiration, and the Friday PM weekly expiration. The settlement price for AM expirations of SPX is based on the opening trade price of each of the 500 stocks of the S&P 500 index. After each of the 500 stocks has traded on expiration morning, the prices are calculated to determine a settlement price for expiration. However, trading on the expiring option is stopped at the close of trading the day before. So, SPX option sellers and buyers are stuck with their positions from Thursday afternoon until Friday morning not knowing what the index price will be for settlement until the market actually opens and sets the price. For PM expirations, it is simpler, when the market closes, option trading stops and expiration settlement is based on the price of each of the 500 stocks in their last trade of the day. If you watch the price at the closing bell, you will see it change slightly by several cents after the close as all the different orders that execute at the market close get accounted for. The second way that AM and PM expirations vary with index options is that when the option contract is listed, monthly contracts use the ticker symbol SPX, while all other expirations use SPXW. The W is for weekly, even though the expirations may be quarterly, monthly, Monday, or Wednesday, and soon Tuesday or Thursday. So for S&P 500 Index options, just know that SPX listed options expire in the morning (AM) and SPXW listed options expire in the afternoon (PM). Either way, when you are searching for option listings, most brokers list SPX and SPXW options together under SPX.
XSP options are a more recent creation, and only have PM expirations. There aren’t different naming conventions either. Settlement works the same, with prices set by the final trade of each of the 500 stocks of the index when the market closes.
Another difference between SPX and SPY options is that SPX options are traded in increments of 5 cents. Since SPX is 10 times the price of SPY or XSP, trading increments or tick size is actually more precise on a percentage basis for SPX. XSP trades in increments of one cent like SPY. SPX options are also very liquid and orders can usually be filled 5 cents away from the mid price, even in multi-leg orders. There is a little difference based on trade volume of different expirations. Monthly expirations typically have the most volume, followed by Friday PM expirations and month-end expirations. Monday and Wednesday expirations have the least volume and can sometimes be slightly harder to fill, especially for strikes away from the money with more than a week until expiration.
XSP have a lot less volume than SPX or even SPY options, so they can be a little less liquid. Because of their pricing, they trade very similar to SPY, but with a little less liquidity. Since XSP is an index option, there is no worry of assignment, and dividends are not a consideration.
Some brokers don’t allow trading of index options in their accounts, and some strategies are not allowed with index options in certain types of accounts. Some brokers charge higher commissions and fees for index options than for stock and ETF options, so watch out!
Finally, index options get a different tax treatment and have a different accounting treatment at the end of the calendar year. Index options fall under Section 1256 of the tax code which allows a trader to classify 60% of the gains from trading index options as long term, while only 40% are short term. For taxable accounts of traders in mid to high tax brackets, this can be a significant advantage! It doesn’t matter if the option was held for a minute or six months, the 60/40 tax assignment applies. The other part of 1256 treatment is that index option positions are “marked to market” at the end of the year, meaning that a trader considers the option to be a profit or a loss at the end of the year even if the position is still open based on the price at the end of the year of open positions. In stocks and stock options, only positions that have been closed are evaluated for a profit or loss. Using mark to market can be a bit confusing the first time around, but most brokers do all the calculations and provide them in a year end tax statement.
The CBOE has announced another index option on the S&P 500 index to start trading very soon, call Nano options. This index will be 1/1000 of the SPX, or 1/100 of XSP, to allow very small option trades on the S&P 500. Supposedly the ticker symbol will be NANOS. Stay tuned for more details.
Futures Options
There are two futures contracts on the S&P 500 index that offer options. The primary one is called the E-Mini S&P 500 Futures, which uses the symbol /ES at most brokers. In listings of futures contracts and futures options the symbol will be followed by a letter to designate the month the future expires and a number for the year of expiration- for example /ESH2 represents the future contract expiring in April of 2022. The other futures contract is called Micro E-Mini S&P 500 Futures, and uses the symbol /MES. Some brokers may use other characters to designate futures instead of the forward slash, and some may require approval of futures to even see the ticker symbols. Consult with each broker for details.
Futures are tradable contracts based on the price of the underlying index at the expiration of the contract. Futures contracts in general expire at a variety of times in the month with /ES and /MES expiring on Wednesday mornings and settling to opening prices of the S&P 500 index. Since the futures contract is based on what the market expects the price to be at expiration, the price of the future is usually a little less or sometimes a little more than the current value of the S&P 500 index. However, it generally doesn’t vary that much because the current price is one of the best indicators of what the future price might be and futures buyers and sellers won’t let the prices to diverge that much because it presents an opportunity for arbitrage between the different values, knowing that at expiration they will converge. At any given time, there are many different contract expirations available to trade, going months out in time. The contract month closest to expiration is called the front month. Buying a front month futures contract is as close to directly owning the S&P 500 index as you can get. The value of the futures contract goes up and down with the index.
A single /ES contract is valued at 50 times the S&P 500 index. One might think of it as owning 50 shares of the S&P 500 index if the index price were the price of a share. A single /MES contract is valued at 5 times the S&P 500 index. These values are known as the notional value. However, futures contracts are priced at prices similar to the actual S&P 500 index, regardless of the notional multiplier.
Let’s take an example. Let’s say that the S&P 500 index is currently at 5010, and front month futures contracts for both /ES and /MES are trading at 5000 as they are slightly less. The /ES contract would have a notional value of $250,000, and the /MES would have a notional value of $25,000. If the market went up 100 points on the S&P 500, and both /ES and /MES went up to 5100, the owner of one contract of /ES would make $5000, and the owner of /MES would make $500. For most people $250,000 for one contract is too expensive, but futures contract owners aren’t required to have the full amount in their account, but just a fraction due to the assumption that the price will only move within a small percentage of the index price. If the price moves more than expected against a contract owner or seller, additional capital will be required. This practice is called span margining, and can be very helpful to allow traders to leverage a position, but also very dangerous if over-used and the market moves against a position. For example, if a trader buys an /ES contract priced at 5000 and has $50,000 in their account, a 20% decline in the market to 4000 would wipe out the account. While /MES is one tenth the size, the problem can be the same for a trader with a smaller account.
So far we’ve talked just about the futures contracts themselves. The topic of this post is trading options on the S&P 500 index, not trading futures on the S&P 500 index. So, let’s talk about how options on futures work. In particular let’s look at options on /ES and /MES. One key difference from other options we’ve looked at is that /ES and /MES options don’t use a 100 multiplier, like stocks or index options. Instead, futures options are an option to buy or sell one single futures contract. Which futures contract is the option associated with? Typically, it is the futures contract that is next to expire after the option expires. So, an option on /MES expiring on the first Friday in March is tied to the March futures contract, which will still have time remaining when the option expires.
So, buying an /ES call gives the buyer the option to buy one /ES futures contract at option expiration, and buying a /MES put gives the buyer the option to sell one /MES futures contract at option expiration. So, settlement of the option at expiration doesn’t settle in stock or in cash, but in a futures contract. The price paid for the futures contract is the strike price of the option. For example, if a trader buys a call option for /ES with a strike price of 5000, they would get to buy an /ES futures contract at options expiration for $5000, multiplied times the /ES futures multiplier of 50, or a total of $250,000, assuming that /ES is trading above 5000, making the option in the money. On the other hand if the price of /ES is below the strike price of the call option, the option would expire worthless. Similarly, if a /MES 5000 put expired in the money, the settlement would be to sell a /MES futures contract for $5000 multiplied times the futures multiplier of 5, for a total of $25,000.
There are futures options for /ES and /MES that expire every Monday, Wednesday, and Friday, so there are plenty of expirations to choose from. And futures and futures options trade virtually around the clock, from Sunday afternoon until Friday afternoon. In fact, the price of /ES in the overnight hours moves around quite a bit based on news and as the opening of the market approaches, it is a fairly accurate indicator of where the market will open. Meanwhile the S&P 500 index stays the same during the overnight, because it is based on a calculation from the trading of the 500 stocks in the index, which don’t broadly trade at night.
The span margining ability to trade using the buying power associated only with a calculated expected move applies to futures options as well as futures contracts. As a result, traders can put on highly leveraged trades without consuming a lot of buying power. With this capability comes significant risk. Traders have to be very aware at all times of the true total risk that comes with trades in futures options. With futures options, the buying power used is not a good indicator of the capital at risk in the case of a very large move of the market up or down. Some brokers allow selling of naked futures options for very little buying power, where selling the same notional value of SPX or SPY could easily require ten times more capital even though the true risk is the same. Many trading strategies with futures options may seem very safe because they are high probability trades- perhaps they win 90% of the time- the problem is when the losing 10% happens and the trader is not prepared for the damage that occurs to the account. Risk management is critical in all options trades, but particularly in futures options using span margin. Stops and hedges become the difference between staying solvent and going broke.
Like index options, futures and futures options also use section 1256 tax treatment with 60% long term gains and 40% short term gains, and are marked to market at the end of the year. There are no dividend risk issues.
One final unique advantage to futures options is that they are exempt from the Pattern Day Trade rule. For accounts under $25,000 where trades are opened and closed the same day, a trader can have severe limitations placed on an account. Generally, the limit is five day trades in a rolling seven day week. This can be stocks or options. Futures and futures options are governed by different regulations, so many day traders favor futures.
Many brokers have significant approval processes to be allowed to trade futures or futures options. Some limit them only to standard taxable margin accounts. Other brokers don’t allow them at all. Go to the office of your broker and see if anyone there has any experience trading futures or futures options- it is likely no one there has a clue and they will tell you not to do it. If you have friends that trade in the market, chances are that almost none have ever traded a future or futures option, so you are likely on your own. Your best source for help will be specialist from your broker’s headquarters, specialized training materials, or online resources from your trading community as I discussed in an earlier post.
If trading futures options is so complex, hard to understand, and risky, why do it? For many strategies, futures options can fill in gaps at a low capital requirement. Some hedging strategies can be too expensive with stock or index options, but more affordable with index options. Because of the unique multipliers, futures options for the S&P 500 index may be just the right size for a particular need. And finally, because the futures prices move and trade all night, futures and futures options allow trading on that information at some brokers.
Review of choices
After a lot of discussion and explanation, we have come up with seven choices for trading options on the S&P 500 index. Five of these are directly correlated to the index, and two are leveraged. Remember that the UPRO ETF moves up and down with the S&P 500 index, but three times as much each day. SDS, the UltraShort ETF not only moves the opposite direction of the S&P 500 index, but twice as much in the opposite direction on a percentage basis each day. Because of this leverage, the options on these two ETFs behave in unique ways which can be helpful for some strategies. However, most traders are more likely to want options that are based on underlying entities that move on a 1:1 basis with the S&P 500 index. So let’s review those choices.
Ticker
Type
Index vs Strikes
# of Shares or Multiplier
Notional Value @ SPX = 4000
Settle as
Tax Treatment
SPX
index
1 : 1
100
$400,000
cash
60/40
/ES
futures
1 : 1
50
$200,000
one contract
60/40
SPY
ETF
1/10
100
$40,000
100 shares
short term
XSP
index
1/10
100
$40,000
cash
60/40
/MES
futures
1 : 1
5
$20,000
one contract
60/40
This table lists key differences in the five main choices for options on the S&P 500 index, listed in order of notional size. In this table notional value refers to the amount of capital controlled by a single option with a strike tied to the S&P 500 index being at 4000 (SPY and XSP would have strikes at 400, while SPX, /ES, and /MES would have strikes at 4000).
While SPY is the simplest choice because it is most readily available, there are reasons to consider each of the other listed choices to best meet the needs of a specific account or strategy. From biggest to smallest, SPX controls 20 times as much capital as /MES, and the other choices provide increments in between. I was personally reluctant to trade futures options at first, but for no good reason other than I wasn’t familiar with their nuance. As I write this, I currently have at least one contract of each of these five choices open amongst the various accounts I manage.
For all of our choices, we currently have the ability to select expirations three days a week, and potentially five days a week in the near future. Each choice has an extensive selection of strikes available at each expiration, although one can expect Friday expirations and month end expirations to have more choices and more trading volume than Mondays and Wednesdays. We expect third Friday (monthly expirations) to have more choices and trading volume than any other expiration in the month.
My personal preference in most situations is SPX due to its large size. Even though commissions and fees are more on a per contract basis, the fact that SPX is 10 times bigger than SPY or XSP makes commissions and fees almost negligible in most trades of SPX, where they can be a substantial consideration with SPY and XSP in some strategies that deliver narrow profits. For futures, I like /ES over /MES for the same reasons. However, when I’m trying out a new strategy or working with a small account, I often have no choice but to use SPY, XSP, or /MES. For most new traders, SPY is the first and easiest choice, but eventually there may be a need to use another choice. For example, if you start trading 10 option contracts at a time, it might make sense to use SPX. If SPY is too big, you may want to get approval to trade futures and trade options on /MES. If you have a taxable account and are in a higher tax bracket, XSP may be a good alternative to SPY to reduce short term capital gains. So, learn the differences and make the choice that makes the most sense for the situation.
If you want to investigate strategies for trading options on the S&P 500 index, take a look at some of my favorite strategies. You may also want to read my page on how different option strategies have very different risk profiles.
Traders need access to other traders to share, learn, and teach each other. Online social media groups can provide that type of community.
Let’s face it. Trading options can be a lonely task. It’s just a trader and the computer screen. Whom can a trader turn to with questions, for encouragement, or to share success and failure? Virtually every person who I dare to tell that I trade options as a primary activity either have no idea what I’m talking about, think I’m crazy, or both. Most people who do a lot of their own investing don’t even know what a put or call is. Traders need a community of other traders to keep their sanity and keep moving forward.
When I stop and think about it, I personally know seven option traders that I have met in person. Only seven. Four of them I met through one of the others. And only a few of them regularly do the same kinds of trades as me. And I feel lucky to know that many. So, personal connections can only help so much.
There are lots of online services that traders can pay a small fortune to join to help learn to trade options. Some are follow the leader- buy or sell what the guru says and exit when the guru says. I tried a few of those and found it hard to time it right and even then I didn’t get the results that were promised. So, I’m not a big fan of spending a lot to watch others trade.
If you do a Google search about any topic concerning options, you’ll be bombarded with ads for paid services, but then below them will be lots of YouTube.com videos, and other sites, maybe even this one. There are lots of quality YouTube videos on options, but many that are dubious at best. I first discovered TastyTrade.com through watching some of their YouTube videos. Tastytrade has their own channel on YouTube, and I’d encourage subscribing. One TastyTrader that I enjoy watching is “Sweet Bobby” Gaines. He has a “Sweet Bobby” channel on YouTube. Look around and search YouTube for option trading, and find your own favorites to follow.
But even watching others still doesn’t give you community. There’s nothing like interacting with others. This is where social media actually can be a help. A feature on Facebook.com that you may not be aware of is “Groups.” Just click on the Groups icon and either use the “Discover” icon or the search magnifying glass to look for groups that specialize in option trading. Some are more active than others. Most are private and require you to apply for membership- this is generally to keep out spammers and robots who will ruin the experience. I’ve joined a number of groups- some I’m active in and others not so much. For groups that don’t have members doing strategies I have in interest in, I simply drop my membership. I now have a number of virtual friends from these groups. Some of them message with me on an almost daily basis. I’ve discovered numerous trading strategies to try from posts in these groups, and the banter from members gives the members a wide variety of opinions about different trading scenarios, positive, negative, pointing out risk, ways to manage, and success stories.
Another social site that gained a lot of traction in early 2021 was Reddit.com. Reddit became an overnight sensation for traders when a little-known group on the site called “Wall Street Bets” essentially cornered the market on the stock of GameStop, an almost bankrupt video game store chain. By realizing that there was a huge amount of short interest in the stock and a small float of tradable shares, the group started buying up cheap shares of stock, and bigger buyers followed, driving up the price. Many short sellers, including some large hedge funds were caught flat-footed and had to buy back their short positions at huge losses, further driving up stock prices, a classic short squeeze. Call option buyers joined in as well and market makers hedged by buying increasing numbers of shares also driving up prices. By the time the craziness ended the stock was up over 100 times the price when the buying started. This crazy action drew attention to Reddit and the “Wall Street Bets” group. Like many, I joined both for the first time to see what the fuss was all about. The group membership ballooned to an enormous number and the content turned to mush- just a lot of nonsense posts slamming each other and promoting hundreds of other crazy schemes. I dropped my Wall Street Bets membership after less than a week.
However, Reddit has a feature that suggests posts from other groups that it thinks a reader might like. I found some other groups that I started commenting on that were more serious and in line with my view of trading. Again, I met a number of new virtual friends and engaged in both public and private dialogs about trading strategies. Groups on Reddit are public to read and join, so there can be a lot of spamming behavior and many users delight in being very foul-mouthed in their responses. Rudeness is tolerated a bit much, in my opinion. However, I’ve found that if I stay on the high road in my posts and stay factual and data focused, people generally engage back with me in a respectful way. It’s kind of a what goes around, comes around. In fact, the site has a measure called karma that is based on how well your posts are received by others. People who are mean and overly negative end up with negative karma and many of their comments get deleted by moderators.
Another social site that I’ve found helpful is Discord.com. Discord was started as a way for gamers to chat with each other in private rooms, and have discussions in groups on a private “server.” Once you join Discord, you can set up your own server, or join public servers set up by others. As it applies to traders, individuals will set up and organize a server and invite others to join. Many people have private servers by invitation only. Some of my local friends set up a server like this and invited me- I like the familiarity of the small group and we get along well with each other. I’m also a member of a number of other groups. A nice feature is that anytime someone posts a response to a server, I can have a notification pop up on my phone, or I can choose not to- the choice can vary from server to server. So, I have notifications on for some servers and off for others. The idea is that like-minded people can have an ongoing private dialog about their trading. Some conversations are based on users posting each of their trades for comparison and comment. So, a group of 0 DTE traders might each post their opening and closing trades, and then discuss what went right and what went wrong, critiquing themselves and other members on strategy. A Discord server can be very busy, or not busy at all- it depends on the number of users and how active they all want to be.
Twitter.com can be another source for information on trading. There are lots of famous and not so famous traders and information sources that tweet out information on a regular basis. I personally don’t have the bandwidth for it at the moment and don’t use it much. However, I know lots of traders love it. TastyTrade has a daily show, the Liz and Jenny show, where much of their discussion is based whatever Twitter posts use the hashtag #LizJny, which has fostered a community feel. Other shows on trading networks and CNBC have similar features and hashtags. Many high profile traders will respond to personal tweets or tweets that use an @ reference for them. However, the format really doesn’t lend itself to in-depth discussions. Often, it just allows tweeters to refer followers to content that the tweeter thinks is interesting.
I used to be a big fan of LinkedIn.com and its groups. Now, I think other social media resources have taken the lead in being sources of interaction with like-minded traders. I joined a few trading groups, and I have to say that I’ve been disappointed so far. Maybe new groups will emerge that will be better for the trading community, but I’m still waiting.
I know TikTok.com is gaining ground in this space as well. Similar to YouTube, TikTok offers videos, generally short in duration, and based on your reaction, the site steers you to similar content that might be appealing. As I write this, it seems a bit of an immature community currently, but by the time you read this in the future, TikTok could be the greatest resource available. We’ll see.
This is just a start. Feel free to leave your favorite way to get involved in the trading community in the comments below. New forums and sites are emerging all the time and providing new opportunities to connect with other traders. I’ll refrain from naming any specific groups on any particular site, because if you are reading this years from now because I haven’t updated it, there will likely be many new groups and sites to join and find community.
From my website Analytics, I can see that over half the hits to my site come from people clicking on a link to this site from a post someone referenced on a social media site. It used to be just me that did that on occasion, but lately others are finding this site and sharing it with their groups and trading friends. I really appreciate it when readers of this site find it helpful enough to copy a link from this site and share it with others. People seem to like the pages I have on my favorite trading strategies. I hope that you find some community here as well and find content worth sharing. Your comments are always appreciated, even it is a pain to leave them. It’s a challenge to have a site like this that doesn’t get nailed by spammers and hackers, so I have to put up some hurdles to allow comments.
Remember, the whole point of this post is to give you ideas about connecting with other people who understand the kinds of struggles you face as a trader, and give you a chance to give back to newer traders. Discussing trades on social media is the only place where I can discuss the merits of 20 delta short strike on a wide put spread, and know that most of the people reading will not only understand, but have an opinion to share back with me. That won’t happen at the next neighborhood block party. You aren’t crazy. There are people out there that get what you are trying to do and will be happy to have a discussion about it. You just have to know where to look. That’s the power of community, even when your community is spread around the world.
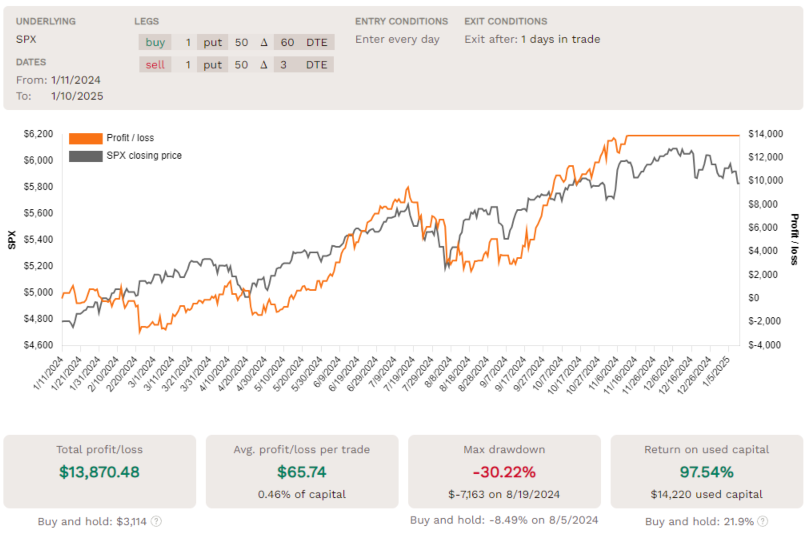
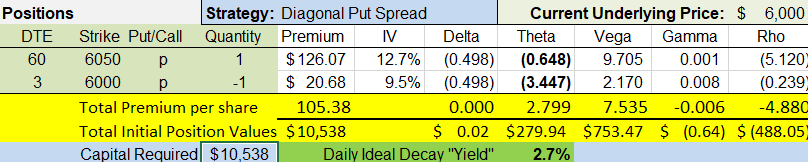
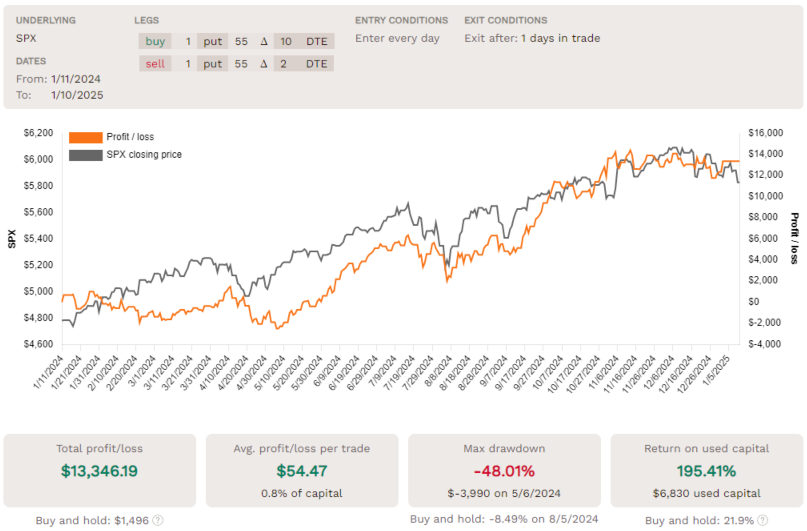
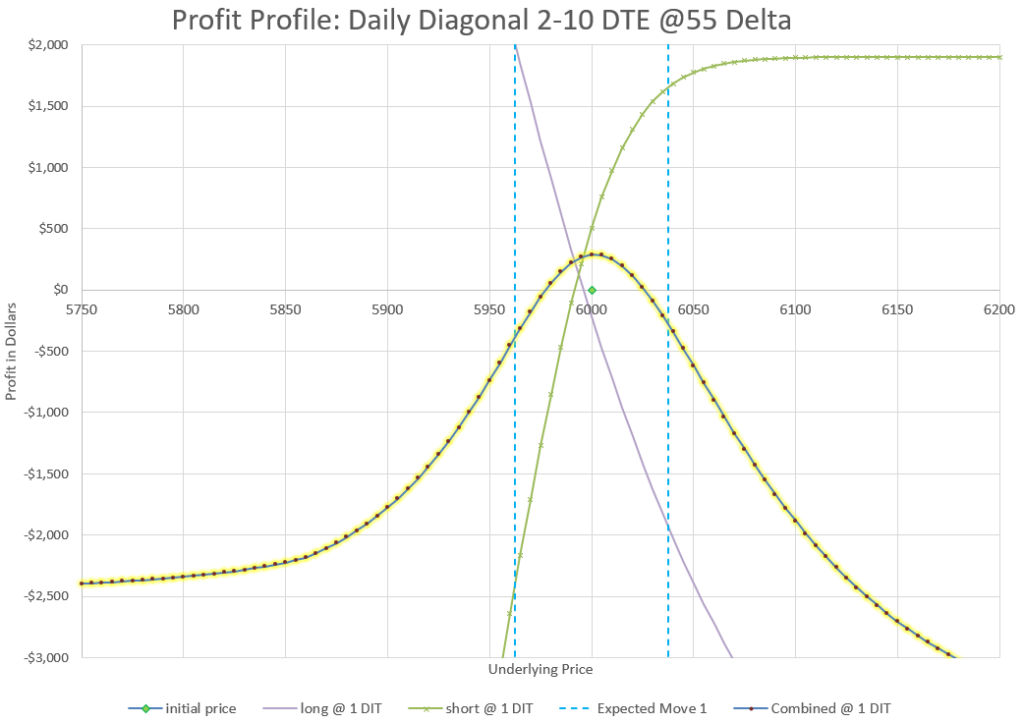
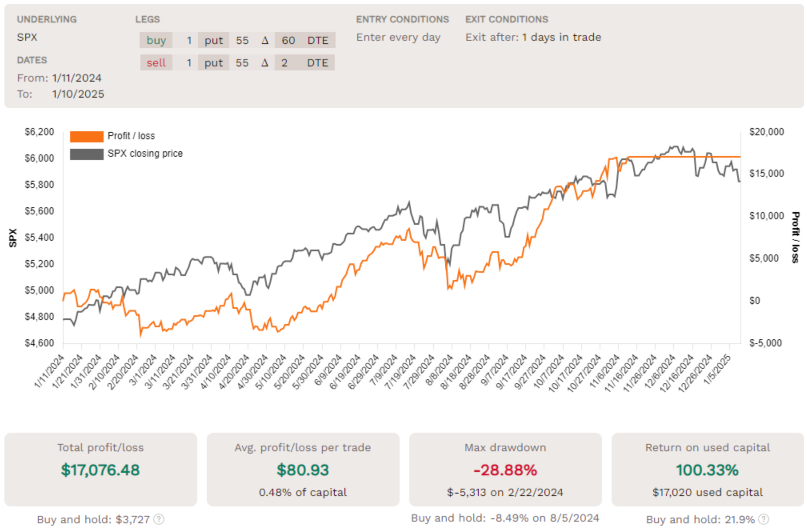
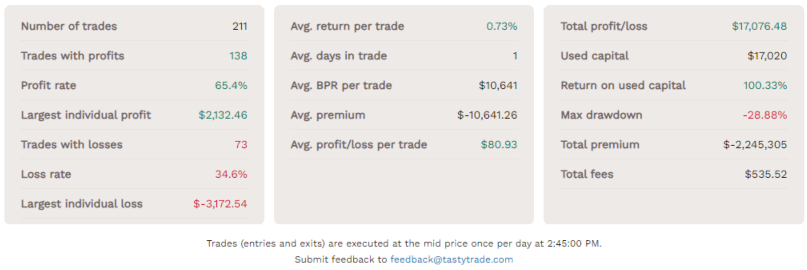
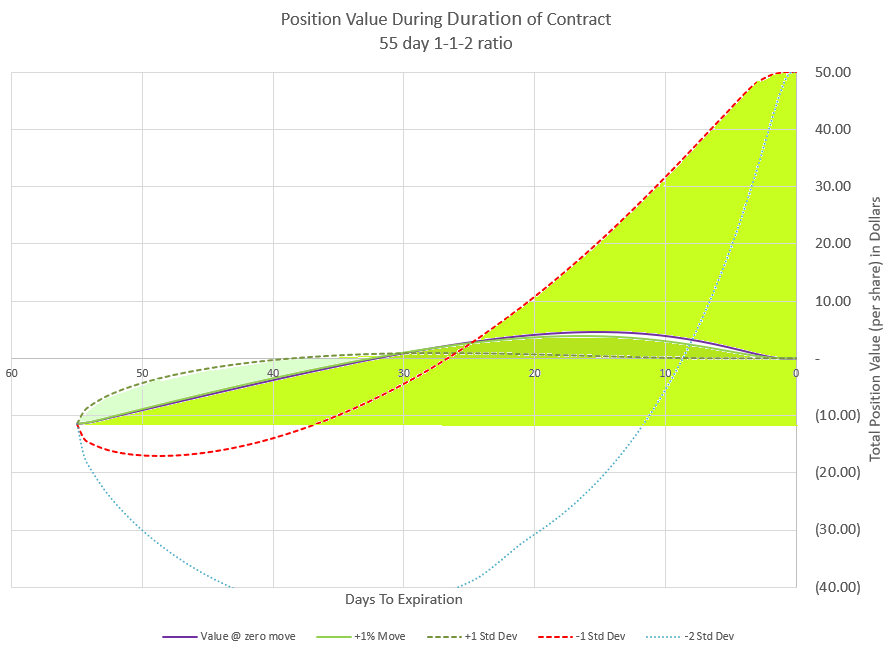
I’ve been trading variations of a Double Diagonal option position, rolling daily for 14 months. It’s been a bumpy ride, but overall very positive. For this trade I used SPX index options, the most liquid option on the S&P 500 Index. The trade requires four options- a short and long put, and a short and long call. For a single contract 4-leg position, the total capital requirement is usually a bit less than $10,000, without the use of any margin, but varies day to day. I’ve averaged just over $3000 profit a month per each single contract position, or 30% return per month. This is without any compounding.
I’ve written about this strategy in my article, Daily Double Diagonal Trade. I spent over a year previously testing and trading Daily Diagonal Puts of various expirations, and there are several write-ups on those topics on this website. However, this post is intended to focus in on results, and what I learned along the way.
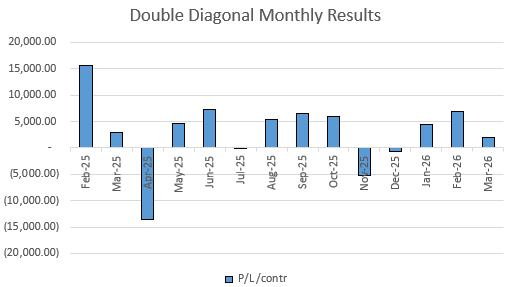
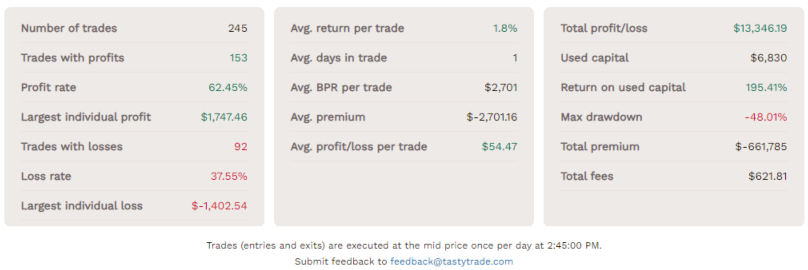
Let’s take a look at results broken down month by month. I’ve split out the results for each leg of the contract, as well as the total return for the month. Note that the results are in dollars per contract, and as mentioned above the total position usually requires a little less than $10,000 of capital on any given day.
If you look closely and do the math, you may see that on many months the four individual legs don’t add up to the total. This is because I didn’t always have a 1:1:1:1 ratio. As described in my strategy write-up, I sometimes reduced the amount of short option exposure, trying to find better ways, particularly in higher volatility environments. These results are averages per contract for the idividual legs and average per contract position for the total. So, if I had 3 longs and 2 shorts, I took the total P/L and divided by 3.
Some people have asked me why I chose to add calls to the earlier Diagonal Put strategy. From the results, you can see that the calls have actually made more than the puts when you add the long and short positions together. I noticed this early on in my data, so I just kept going. Initially, this was just a trial, but it started so well, I just kept going.
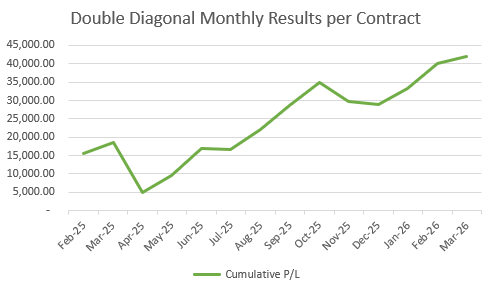
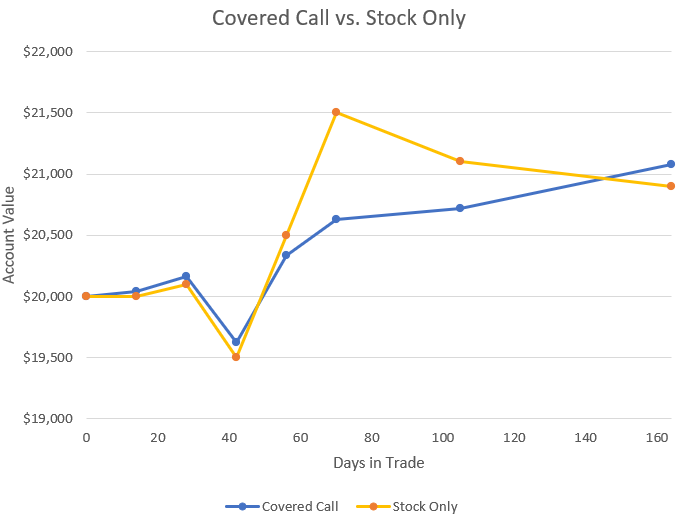
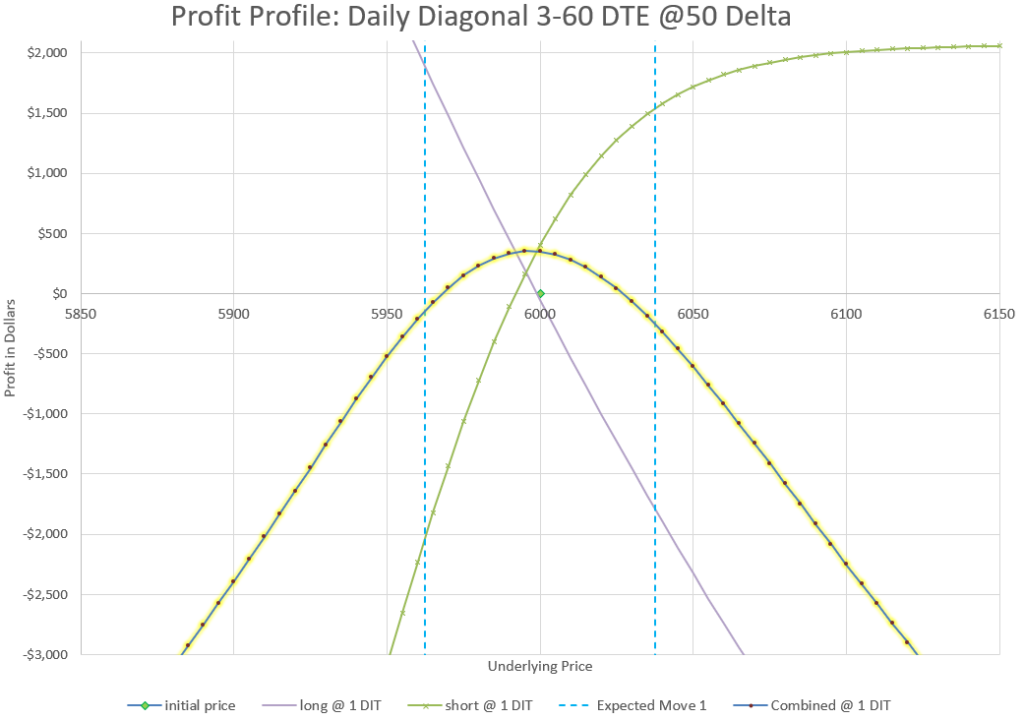
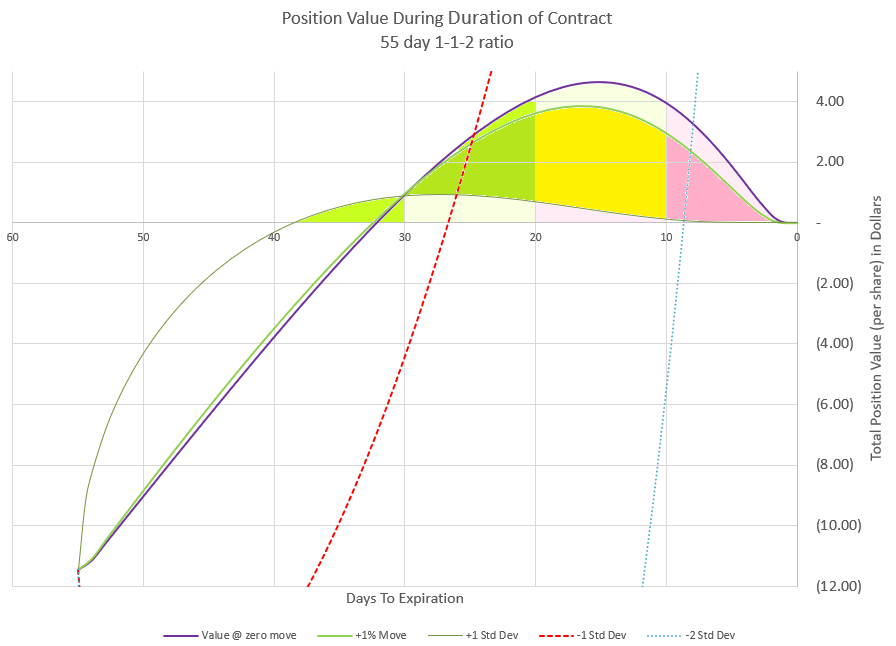
We can also look at this as a graph, which makes the numbers more obvious.
You might notice a few things that pop out from the graph. First, the best month of all was the first one I traded this- February 2025. The month was a fairly calm month with almost every day staying within the daily expected move. I also traded with mostly 2 DTE short option positions, maximizing short gains. I thought I had found the best trade ever.
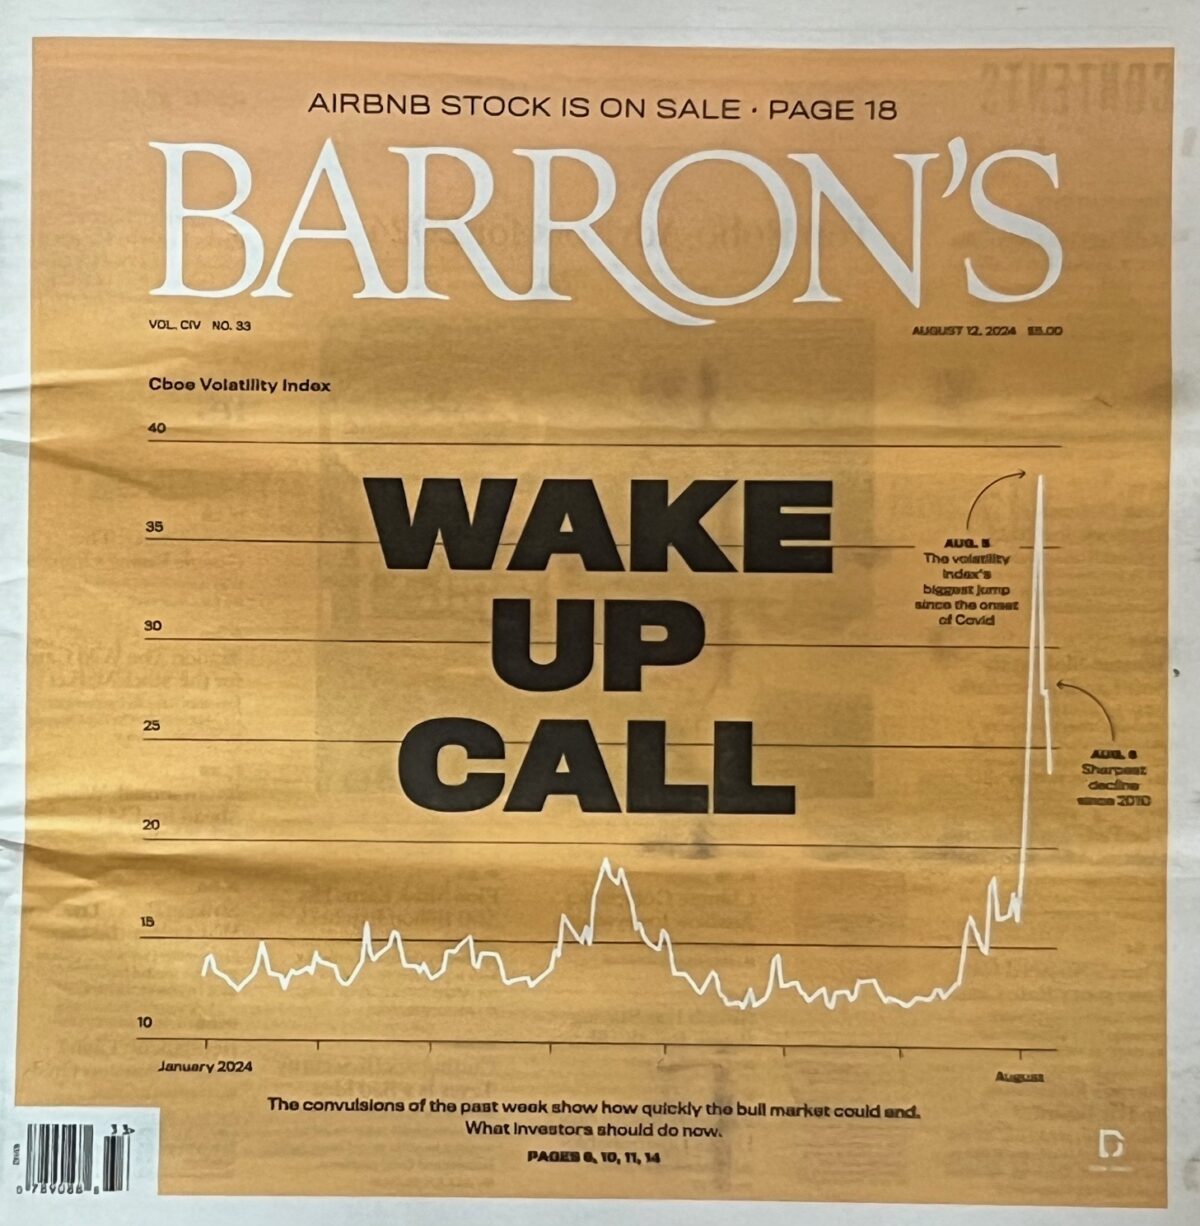
The worst month was just two months later, April 2025, which started with President Trump’s “Liberation Day,” where he announced 200% tariffs on most of the world. The market dropped almost 20%, often in chunks. I took hit after hit with each big down day. Then near the end of the month, the president announced that he was delaying tariffs for a month and the market went up 10% in a single day, the largest one day gain ever for the stock market. My short call position got obliterated. I realized that this trade wasn’t as easy as I had thought.
Over time, I adjusted my approach, with a goal to reduce the losses in worst case scenarios while trying not to give up too much upside. I tried lots of adjustments, both in real trades in dozens of different back-tests. Since that April debacle, I’ve had two negative months, November and December, which I chalk up to getting too cute in trying to set up a robust trade for big moves that didn’t happen as I expected. In March of 2026, I was on track for a month that could have been the best one yet, despite the war in Iran, until the cease fire at the end of the month caused a huge one day market gain that wiped out most of the month’s gains.
But, to a large extent, much of what has happened is just how this trade goes. Most of the time, the market is fairly quiet and this trade does well. But some of the time the market gets volatile and there is only so much you can do to avoid losses. I like to think that the changes I’ve made to my mechanics would let me do better in another situation like April of 2025, but I’m not sure I’d have the discipline to stick to a plan.
Overall, this trade has done extremely well for me.
For every 4-legged contract position I’ve made over $40,000 in 14 months. Assuming that each contract position required $10,000, the trade has turned $10,000 into $50,000. As in all trading results, it goes without saying that past performance is no guarantee of future results, so take all of this as just one piece of data.
I resisted the urge to try scaling up to compound by earnings. I’ve tried to mostly just keep much of my earnings in cash to build my buffer. I’ve spent some of my gains, and also used some to fund other trade strategies in my diversified accounts. I fully expect to see future drawdowns of over $10,000 a contract, but I take some comfort that the longest period of negative results from peak to peak is four months so far. At any point in the cumulative profit graph, the total is higher 5 months later. Given the length of time for these results, it’s safe to say that I can’t draw statistical significance from that observation, only that this is true for this data set.
Finally, I’d love to claim that I quintupled the size of my accounts because of this trade, but I didn’t because this was only a part of my overall position. Other positions didn’t do nearly as well, and much of my portfolio is in cash equivalents like BIL, the T-bill ETF, that I can quickly switch to/from cash. And if I had put all my money in this trade, I would have gone broke last April, so that’s why I only do a portion with this trade and keep lots of cash for tough times.
The way to bring the volatility of the trade down is to mix it with positions that are very stable, so that its volatility is muted by steady results elsewhere. Mix this trade with 5, 10 or even 20x of other positions that just earn basic interest, and you can have a mix with nice upside and not that much downside. That’s how I can do a trade like this without getting stressed out.
This trade is about as close to day trading as I get. I make a rolling trade of my positions each day, but I don’t spend much time the rest of the day watching the markets. With several days until expiration, there isn’t much that happens during a trading day to require any kind of action.
Can this trade keep averaging 30% return on risk capital per month? Only time will tell.
Build an annual financial balance sheet to track net worth, assets, liabilities, income, and insurance. A simple year‑end snapshot for smarter personal finance planning
Most people think of balance sheets as something only businesses use. But the truth is simple: every household benefits from taking a yearly financial snapshot. Every January, I like to hit pause and take a clean snapshot of my financial life. Not in a stressful way — more like stepping on a scale once a year just to see where things stand. It’s amazing how grounding it feels to look at everything in one place: what you own, what you owe, what you earned, and how protected you are.
If you’ve never built a personal balance sheet before, don’t worry. It’s simpler than it sounds, and once you set it up, updating it each year becomes a quick ritual that pays off in clarity. I’ve found that creating this snapshot at the start of each year is one of the most powerful ways to track progress, spot risks early, and make better long‑term decisions.
What does this have to do trading options, the focus of this site? A trader’s use of options is part of their overall investment plan, as well as a wealth creation and preservation strategy. Once in a while it’s useful to step back and look at the bigger picture. If I’ve made particularly wise or foolish trades, they may have a substantial impact on my overall financial condition, so I use this tool to put my trading into perspective.
Why an Annual Balance Sheet Matters
Life moves fast. Bank accounts change, investments grow or shrink, loans get paid down, and new obligations appear. Without a structured review, it’s easy to lose track of the big picture.
A yearly balance sheet helps you:
Measure progress by comparing this year’s numbers to last year’s
Spot trends in savings, debt reduction, and investment growth
Prepare for conversations with your spouse, financial advisor, or accountant
Organize key information for emergencies or estate planning
Stay intentional about your financial direction instead of drifting
Think of it as your household’s annual financial report—simple, honest, and incredibly useful.
Start With Your Assets (What You Own)
Think of this as your “everything that has value” list. You don’t need to overthink it — just gather the numbers from your year‑end statements. I like to also track what I’ve contributed or withdrawn from each type of asset or account to separate what is growth or decline from my cash flow impacts.
Typical Categories and where to find the data
Home value: Zillow, Redfin, or your latest appraisal
Record the value of each item as of January 1 (or whatever date you choose). This becomes your baseline for the year.
I think it is also a good practice to regularly deep dive into the make-up of stock and options portfolios. I look at that as a separate exercise which I’ve discussed in some detail in my write up on portfolio management. For that reason, I won’t discuss that as part of this household balance sheet.
List Your Liabilities (What You Owe)
This part is just as important — and often more motivating — because you can literally watch your debts shrink year after year.
Since I’m paying interest on all the money I owe, I like to list the interest rate on each debt. Maybe you want to also track what each monthly payment is. Keeping that out front can help in prioritizing debts to attack first.
Typical Categories and where to find the data
Mortgage: Your lender’s year‑end statement
Auto loans: Loan servicer statement
Student loans: Loan portal
Credit cards: December statement
Personal loans: Lender portal or statement
Just like with assets, use the balance as of your snapshot date, or as close as you can get.
Calculate Your Net Worth
Once you’ve listed everything, the magic moment arrives:
This number is your financial “you are here” marker. It doesn’t define you — it just gives you a baseline to compare against next year. Your net worth is the single best high‑level indicator of your financial health. Tracking it year over year shows whether you’re moving in the right direction—and by how much.
Even if the number isn’t where you want it to be, having clarity is the first step toward improvement.
Add Your Income Snapshot
This isn’t part of a traditional balance sheet, but it adds helpful context. It shows how your earning power and investment income support your financial progress.
Where to find the data
Work income: W‑2, pay stubs, or payroll portal
Side income: 1099s or your own records
Investment income: Year‑end brokerage statements (look for dividends, interest, and realized gains)
Rental income: Your bookkeeping or tax prep records
You don’t need to break it down to the penny — just capture the big picture.
While income isn’t part of a traditional balance sheet, including it gives you a fuller picture of your financial ecosystem. This section helps you understand how your cash flow supports (or limits) your financial goals.
Another related addition I like to add later to this section is my income taxes for the year. Since I likely won’t know that until after I do taxes, it will probably have to wait.
Document Your Insurance Coverage
Insurance is one of the most overlooked parts of a financial plan. Listing your policies in one place makes it easy to review coverage, compare premiums, and ensure your family knows what exists if something unexpected happens.
This is one of those “future you will be grateful” sections. “Present you” may find that it is time to add or subtract coverage, or find a new carrier.
Where to find the data
Policy documents
Insurance provider portals
Renewal statements
Include:
Auto insurance
Homeowners or renters insurance
Health insurance
Life insurance
Disability insurance
Long‑term care insurance
Umbrella liability policies
You don’t need to list every detail—just the provider, policy type, and key coverage notes. Where it makes sense to list, add coverage amounts, premiums and/or policy numbers. I recommend keeping it simple to start with and add more details that you think are important over time.
Why a Spreadsheet Makes This So Much Easier
A simple spreadsheet turns this into a living document you can update each year. It also makes comparisons effortless:
Update values each year without rebuilding anything
Automatically calculate totals and percentage changes
Add charts if you want a visual snapshot
Print a clean copy for discussions with your spouse or advisor
Store a version in a safe place for emergencies
It becomes a living document — part financial checkup, part family preparedness tool. This becomes a clean, printable document you can review privately, discuss with your spouse, or bring to a financial advisor.
Add Year‑Over‑Year Percentage Changes
This is where your spreadsheet becomes really insightful. Instead of just seeing that your net worth went from $X to $Y, you can see the percentage change, which puts everything into perspective.
How to calculate it
Use this formula in your spreadsheet:
Then format it as a percentage.
Example
Last year’s net worth: $500,000
This year’s net worth: $550,000
Suddenly, you’re not just “up $50k” — you’re “up 10%,” which is a much more meaningful way to track progress.
You can apply this to:
Net worth
Individual asset categories
Debt balances
Investment accounts
Income changes
It turns your balance sheet into a year‑over‑year dashboard.
Example Document
Your sheet might look something like this. There is no set standard format for this, so make it work for you.
Store It Somewhere Safe
Your annual balance sheet is more than a planning tool—it’s also a critical reference document for emergencies.
Keep a copy:
In a secure digital folder
On an encrypted drive
In a safe or lockbox
With other estate‑planning documents
If something happens to you or your home, your family will have a clear roadmap of accounts, assets, debts, and insurance policies—saving everyone enormous stress and confusion.
Final Thoughts
Creating an annual financial balance sheet isn’t about being perfect with money. It’s about being aware. It’s about giving yourself a clear picture of where you stand so you can make better decisions going forward.
Once you build the first version, updating it each year becomes quick and almost effortless. And over time, you’ll have a powerful record of your financial journey—one that helps you stay grounded, confident, and prepared.
Once you do it the first time, you’ll wonder how you ever lived without it.
A big shout out to those of you who reached out to John Einar Sandvand to ask about this site. We had a week of no DataDrivenOptions.com.
Thank you for your patience! We had a week of no DataDrivenOptions.com. It didn’t help that I was on vacation and wasn’t doing any content for the site, so I didn’t know there was a problem.
A big shout out to those of you who reached out to John Einar Sandvand of ThetaProfits.com to ask about this site. He reached out to me through another communication channel to see what was going on, which is how I found out the site was down. John Einer and his videos are a great resource and I’m grateful that he has chosen to feature trades from this site a few times. He’s also a great guy. He said he had several questions from concerned traders.
If you’ve tried to reach this site in the past week, you probably got an error. It turns out that my domain registration expired, and somehow I didn’t get the message. My email for the site is also tied to the URL domain registration, so it went down as well. I thought I had registration set for auto renew, but something went wrong. It is fixed now and hopefully that won’t happen again.
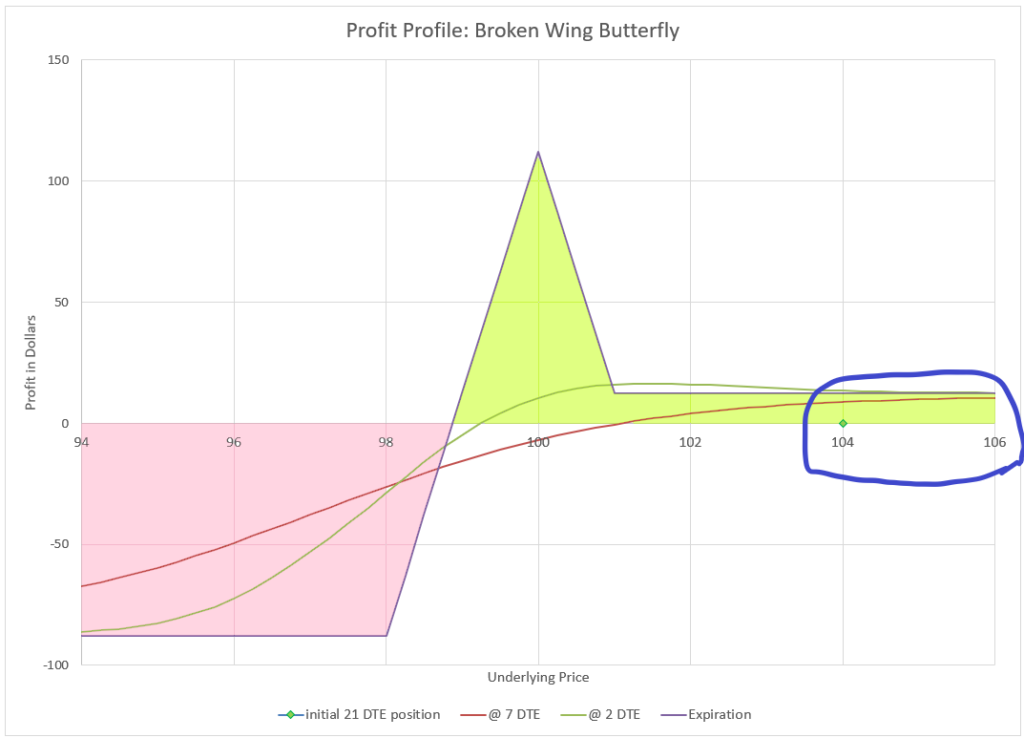
In March 2025, I was interviewed by John Einer Sandvand for his ThetaProfits.com YouTube channel. This 21 Day Broken Wing Butterfly video is the second video I’ve done with him. He’s done really well with his channel and has interviewed some amazing guests, and I am honored that he included me.
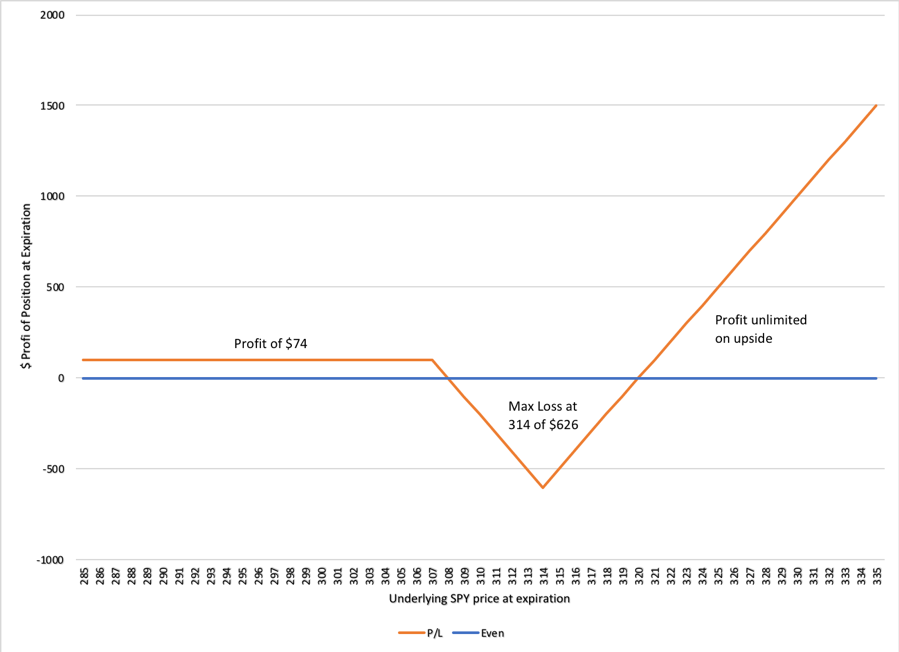
Those pages have the details of the trade, and I’ll let them speak for themselves. But as a brief refresher, here is the profit profile of the trade:
The profit curve of the 21 day Broken Wing Butterfly, highlighting the starting point of the trade.
Thanks to all who have watched the video and come to look around at this site as a result. As I mentioned in the video, the pages on the 21 Day Broken Wing Butterfly trade are consistently the most popular pages on this website- I’ve never understood why, considering that I have written content on so many more common option trading strategies.
I’ve received a few questions about the use of stop losses that I mentioned in the video along with probabilities. If you read the original write-up, you’ll see that I’m not generally a big fan of stop losses but they can be a useful tool. Over time, this trade actually wins greater than 80% of the time if allowed to continue. However, during extended bear markets like in 2022, the win rates were less, especially if stop losses were employed. For those trying to figure out how different management strategies compare, one thing that many analyzing traders forget is that this trade doesn’t always end at max profit or max loss. Sometimes it ends up in between, and that doesn’t make for easy calculations.
What I can say is that this trade does very well in bull markets, and does poorly in true bear markets. So, the majority of the time, this trade can get great returns. But always have a plan for how to manage when the market turns.
I like to roll covered calls almost no matter what, even when my rolls are deep in the money. There are advantages to this strategy, particularly in bear markets.
When I sell options, my favorite management strategy is to roll the option out and collect a credit. I like to do this win, lose, or draw. With a covered call, I like to roll almost no matter what, even when my rolls are deep in the money. Over time, I’ve found there are some advantages to this strategy, particularly in bear markets.
If you read a lot of my explanations on selling calls, you’ll see that I have not been a big fan of call selling in general. That goes for call credit spreads, the wheel, and selling covered calls. My general complaint is that because the market goes up much more often than it goes down, short calls tend to lose money. I’ve seen it in my trading and I’ve seen it in back tests. But covered calls are one of the most popular trades out there- so why are there so many fans?
What is a covered call?
A covered call is a combination of buying or owning 100 shares of stock, and selling a call on that stock. Selling a call obligates the option seller to sell 100 shares of stock at the strike price of the option at any time the option buyer wants to exercise the option. Since the option seller owns 100 shares of stock, those shares cover the exercise risk of the call option- the call seller has 100 shares that can be sold if the the call buyer wants to exercise the option. But the option seller collects a premium when selling which decays in value over time. At option expiration, the option expires worthless if the stock is under the strike price, or it will likely be “called away” by the option buyer if the stock is greater than the strike price. Many traders sell calls against their stock positions to collect premium as extra income.
Let’s look at a typical set up of a covered call:
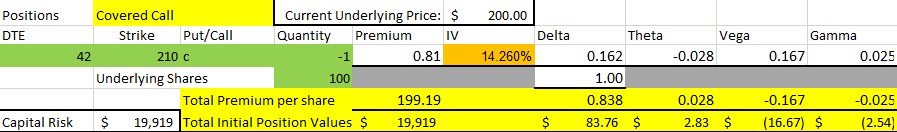
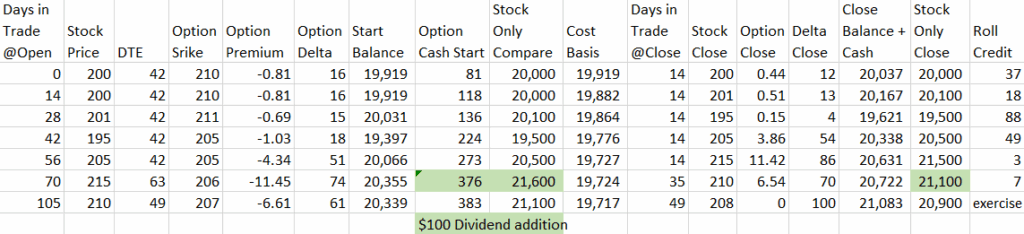
set up of a covered call with 42 days to expiration on a $200 stock
Here we are buying 100 shares of stock at $200 per share and selling a call with a strike price of $210 with 42 days to expiration (DTE). We collect a premium of $0.81, or a total of approximately $81 for the contract. So, our net cost per share to start is $199.19, instead of $200. This lowered “cost basis” is a benefit of selling a covered call- we’ll work to continually lower this further over time.
Throughout this article, we use this example position to demonstrate how rolling a covered call works. Each example transaction will be highlighted to differentiate it from the rest of the text.
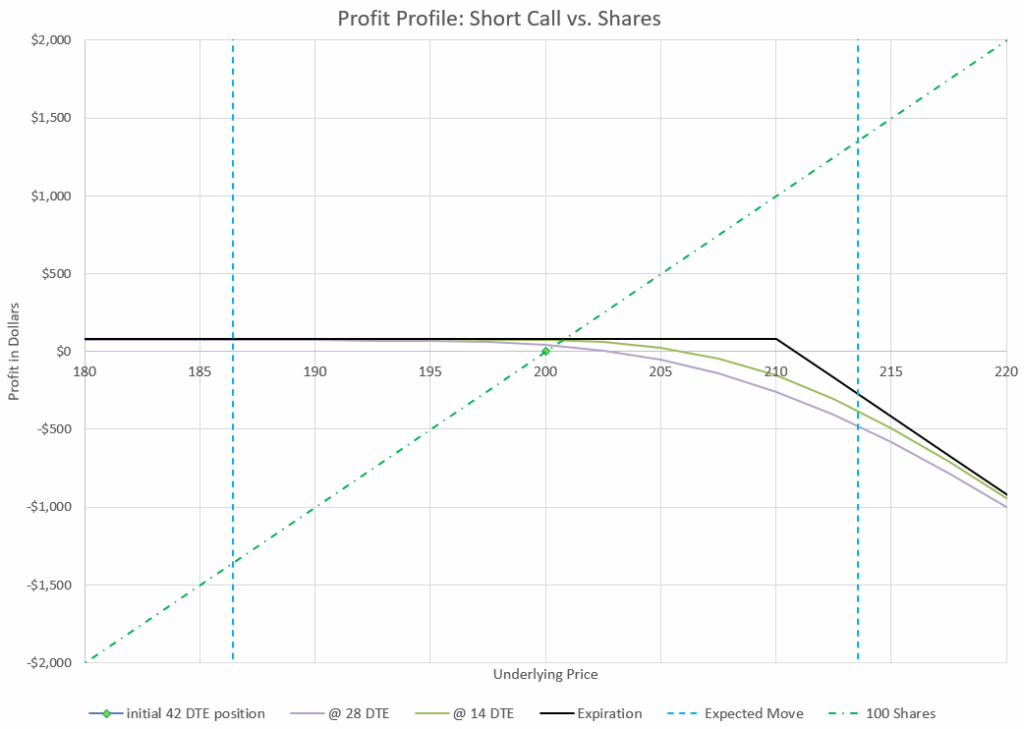
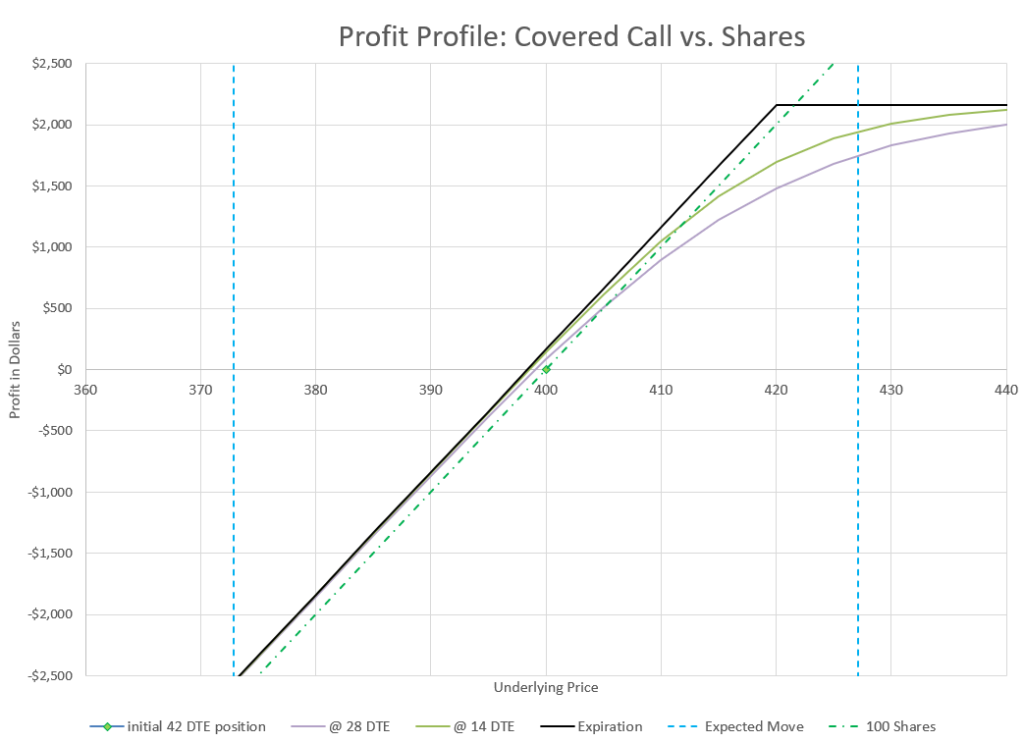
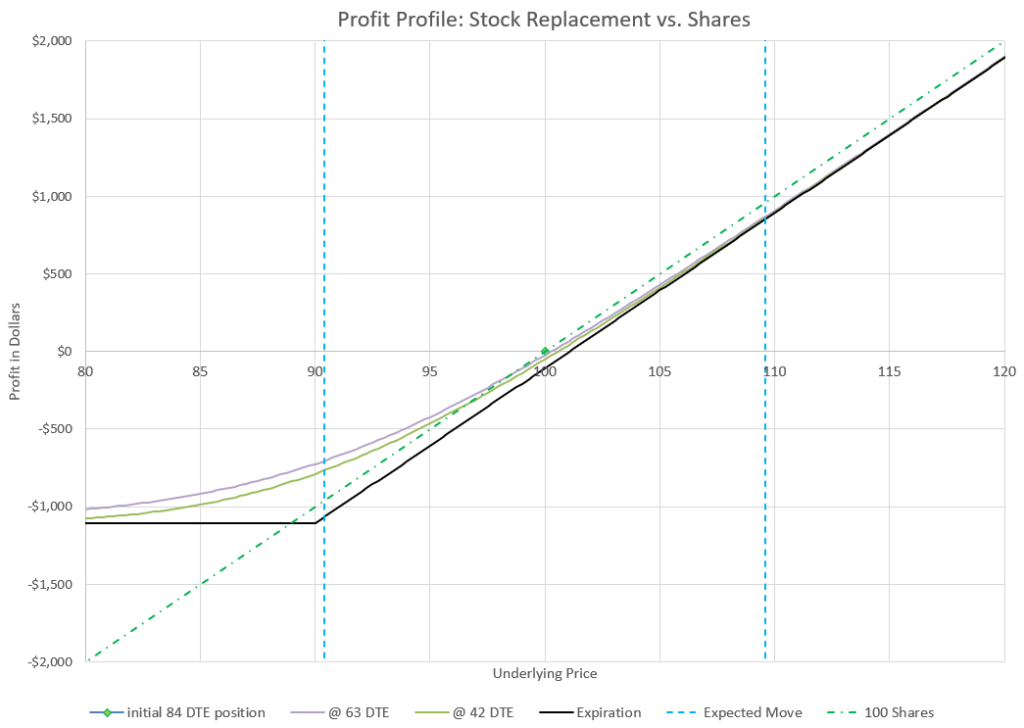
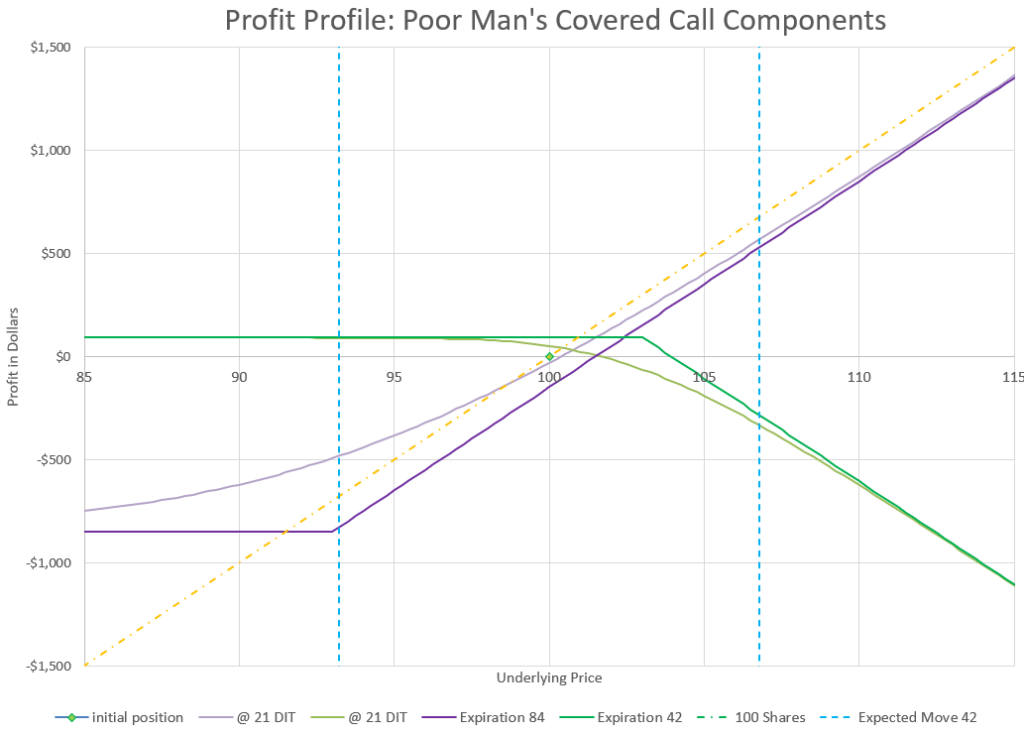
To see how this strategy works, let’s look at a chart of the profit profile of each component plotted separately:
profit of a short call vs shares- the two elements of a covered call strategy
The call makes a small profit at any outcome up to the 210 strike price, and the stock goes up and down. Above the 210 strike price, the two elements of the covered call go in opposite directions, cancelling each other out at expiration. Now, let’s combine the two profit lines into one and see what the outcome looks like:
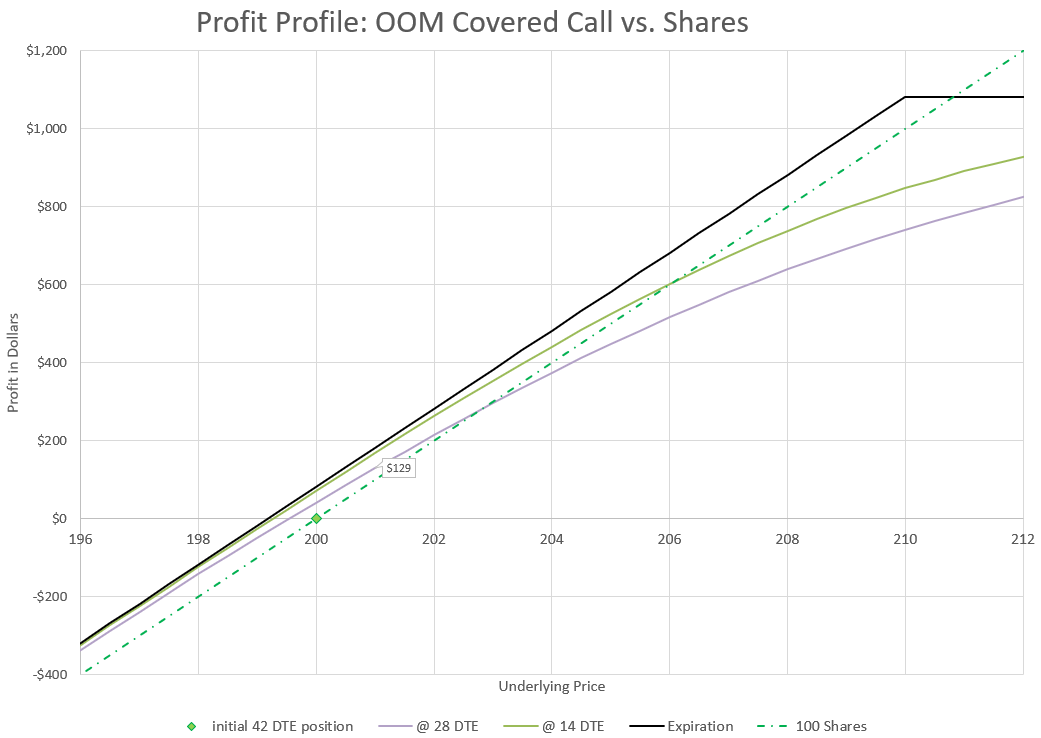
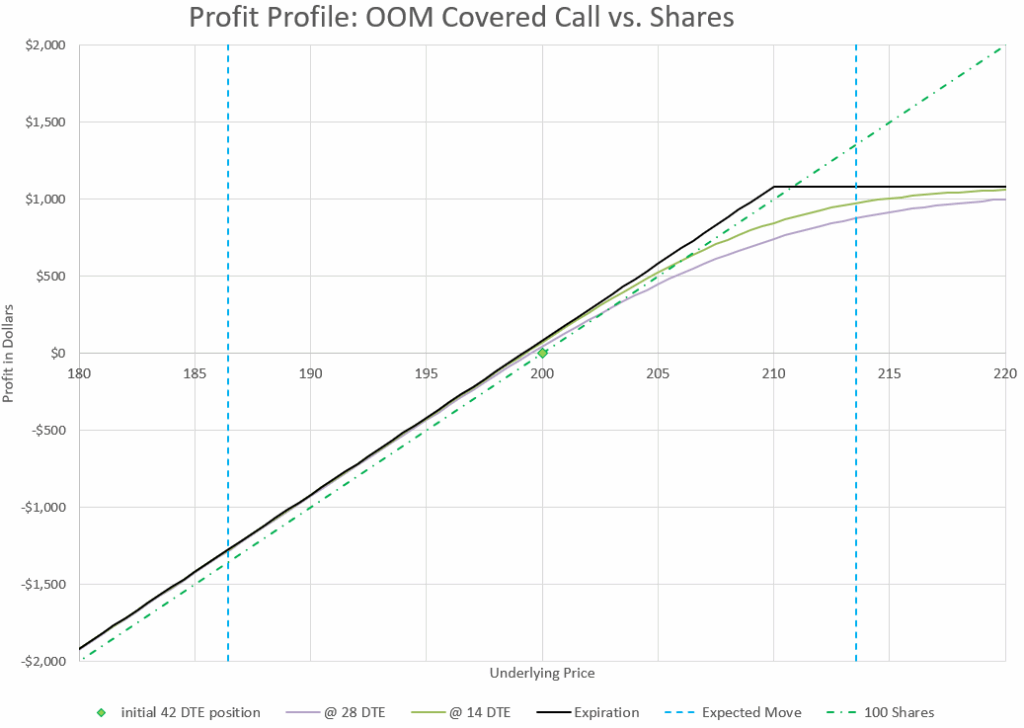
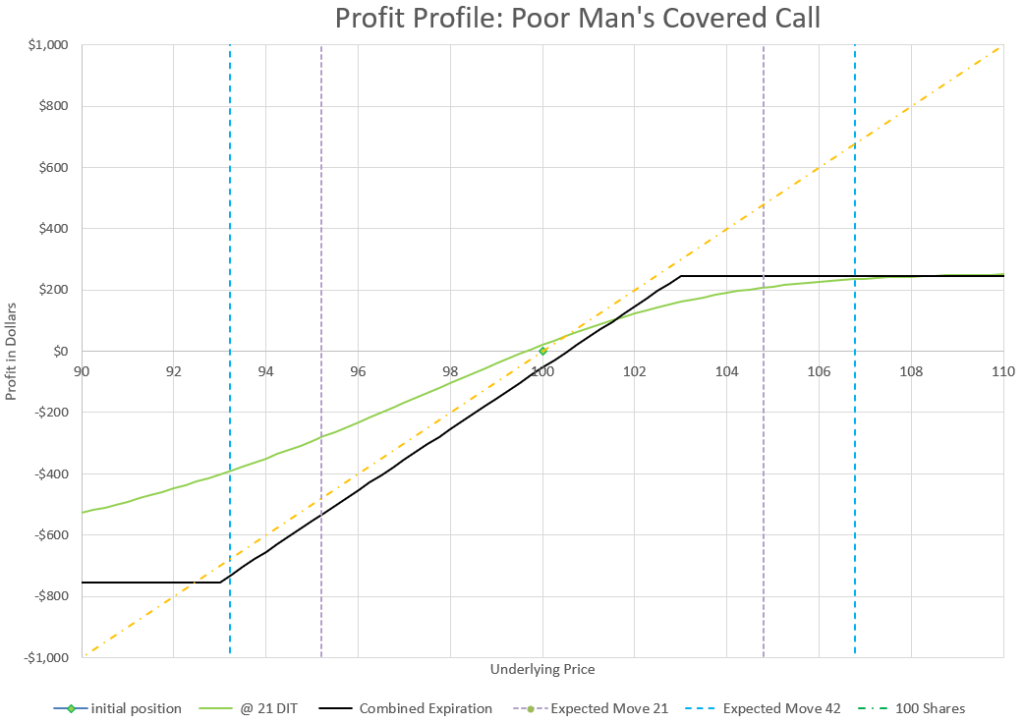
covered call profit profile- at expiration and at selected times before expiration
Through most of the expected move, the covered call profit is a little better than just owning stock alone. Recall that the expected move is what is implied by one standard deviation of the implied volatility of the option chain-see the article on expected moves for a refresher. Only as the price movement gets close to the upper range of the expected move will the covered call profit be less than stock alone. But even in that situation, the profit of the covered call is substantial. The covered call limits maximum profit in exchange for better outcomes at every other point in the profit curve below the strike price.
Ultimately, covered calls are bullish strategy- the long stock always has more positive Delta than the short call has negative Delta, so covered call owners make money when the stock price goes up.
There are several outcomes possible from selling a covered call. The only sure thing is that time is always on the side of the call seller, eating away at the extrinsic or time value of the call option. However, price movements in the underlying stock will move the total position up or down the same direction as the price movement. When price goes up, the stock obviously goes up, while the call option gets more negative premium. The option premium change counters the stock price change, but the stock move is always more than the option premium move. The same is true on down moves, the stock will always move down more than the option premium will help. In the end, the short call option dampens the response of the stock price movement either way. A covered call makes a stock holding less volatile- another benefit.
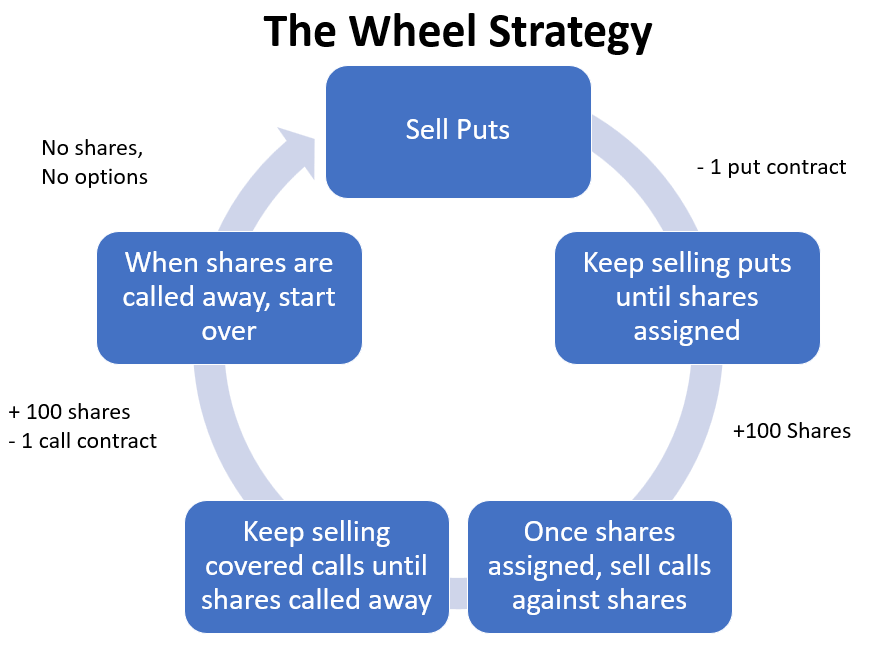
There are lots of ways to trade covered calls and to manage them. Some traders sell calls and then wait for them to expire or get exercised by the buyer. This is often true of “wheel” traders, who sell puts to get assigned shares, then sell calls against their shares until they the shares are called away, then they repeat the process, collecting option premium at each transaction.
The covered call is one element of the “wheel” strategy
Other covered call sellers aim to never let go of their shares and defend their positions so that the call buyer will never exercise the call option. This can be tricky, but the basic strategy is to make sure that the extrinsic value of the call is always more valuable than what the value of exercising the option is, so that exercising the option would be a money loser for the call owner. Generally, the three situations where a call buyer will exercise is when the option is in the money at or very near expiration, when a dividend is being paid, and when a stock option is too illiquid to sell and the only way to close the position is to exercise the call option. So, if a covered call seller can avoid being in those situations, they won’t lose their stock.
What does rolling an option mean?
Many new option traders are under the misunderstanding that they have to hold onto a position until expiration. If fact, generally a trader has three choices- hold, fold, or roll, which I’ve written about elsewhere. But let’s talk about rolling.
Rolling an option is when a trader closes one option and opens another option, usually in a single trade. A trader generally rolls up, down, out, or a combination. Rolling up means that the new option is a higher strike price than the old. Rolling down means that the new option is a lower strike price than the old. And rolling out means that the new option has a longer duration than the old.
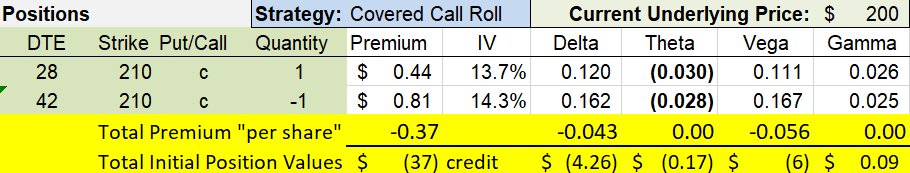
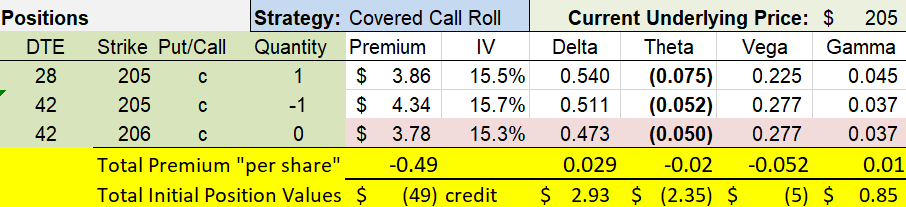
As a continuation of our example, let’s say you have sold a $210 strike call on a stock and it is now set to expire in 28 days. You decide to roll out to 42 days. To do this you buy back the 28 DTE call and sell a 42 DTE call. If you sell a $210 strike call at 42 DTE, you have rolled out. If you sell a $211 strike call, you have rolled out and up.
With price remaining at $200, we can collect a credit to roll out to 42 days.
In this example, we are again collecting 0.81 premium on our new call, and since the old call has decayed to 0.44 premium, we have made a profit of $37 in the 14 days we held this covered call position, even though the stock price hasn’t changed. As it happens, we also have collected a net $37 credit for our roll.
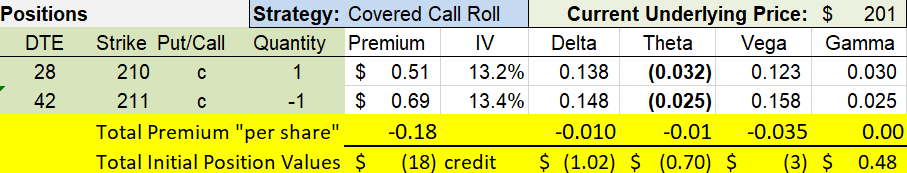
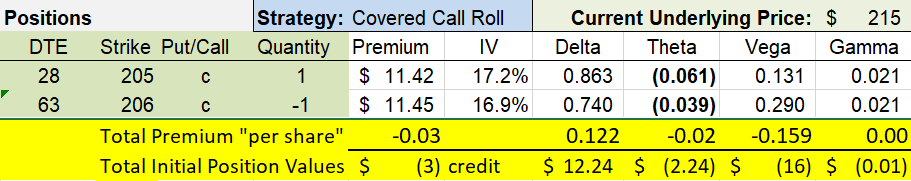
With the price up, we may want to roll up and out, while still collecting a credit.
In this next example, the stock is up from $200 to $201, so we decide to roll up to a 211 strike, which still allows us to collect an $18 credit. Since the stock went up $1 a share, we’ve made $100 on the stock and our call made $30, by decaying from 0.81 to 0.51. In total, we made $130 on the move, compared to only $100 if we had only had the 100 shares.
Some brokers may label these trades differently, perhaps considering rolling up or down as a vertical spread trade, since you are buying and selling an option in the same expiration. If you roll out, some brokers may label this trade as a calendar trade, since you are buying and selling the same strike at different expirations. And if you roll both out and either up or down, your broker may label the trade as a diagonal spread, since you are buying and selling options at both different strikes and different expirations. The true difference between these labels and a roll is that with a roll, one side of the trade is closing a position, while the other is opening a position. When rolling a covered call, you are buying to close the old position, and selling to open the new position.
Notice that when we roll, we are only transacting our call position. The stock stays untouched. The stock’s roll in this trade is to “cover” the short call, so that risk is managed, by limiting it to the cost of the stock.
Why Roll a Covered Call?
There are three good reasons that I think most people use for rolling a covered call. First, they don’t want to have their call option exercised, so they roll out for more time and more premium to make exercising the option by the buyer less attactive. Second, a covered call seller may roll because the premium has decayed and they want to have more premium to decay and the seller doesn’t want to wait for expiration. Third, a covered call may be in the money and a covered call seller may want more attractive strikes. All of these are valid reasons to roll a covered call. Ultimately, all of these reasons boil down to an overarching reason- to keep collecting call option premium.
For most covered call sellers, the goal is to collect additional income from selling calls, and to keep the income coming, one has to keep selling over and over, so rolling is a common way to do it. The only alternatives are to hold to expiration, or let the shares be called away. I prefer rolling to avoid surprises as expiration approaches and to avoid options being exercised against me as much as possible.
Easy Rolls vs Hard Rolls
If the price of the stock that you sold covered calls against never really moved, you could just roll out to the same strike time after time. Sometimes, this is the case, and decisions are easy. If stock prices stay in a range, regular rolls can collect additional premium without adjust strikes up or down. For me, I’m generally happy just rolling my strikes out when the Delta of my call is anywhere from 10 to 40. There’s plenty of premium to collect and I’m not in danger of having the call exercised.
The earlier rolls shown are examples of easy rolls- the price either stayed the same or went up a small amount where we could roll and collect a credit to have a new position with similar Delta and similar premium to what we started with before time passed.
However, if my Delta value gets higher or lower, I have some decisions to make.
Let’s start with Delta values that are less than 10. When call Deltas are low, that means the stock is getting low compared to the call’s strike price, probably because the stock is going down in value. That probably isn’t good because the stock can lose a lot more than the call decay can make for a covered call seller. The worst scenario for a covered call seller is for the stock to go down significantly in price. All risk is to the downside, and even though the call sale premium makes up some of the loss, it can be a drop in the bucket. So, what can a covered call seller do when the underlying stock goes down in price. Let’s consider three choices.
Roll down and out. By rolling to a lower strike at a later expiration, a covered call seller gains premium both ways, more time and more Delta. Just pick the Delta you want from the later expiration and collect a nice payment for the roll. Sounds like a no-brainer. But what if the strike price is lower of the new option is lower than what you paid for stock? The concern is that if the price reverses, the position could get stuck in the money with a value less than what you paid. Do you want to potentially “lock in” a loss? For example, if you bought shares for $100 and the price drops to $80, is rolling calls down to $90 strikes a good plan? Many traders have a rule to never sell a covered call at a strike price less than their basis cost for their shares. If you sell covered calls over and over, all that premium effectively reduces your total cost for the position, so maybe $90 is still more than your basis, if you’ve collected a total of over $10 in premium. Maybe it’s a good idea or maybe not, depends on what got you to this point.
Roll out in time. Even if the price has dropped a lot, a covered call seller should be able to roll out at the same strike price for a credit, even if it isn’t much. As you roll out, the Delta value will also go up. In fact the further you roll out, the higher the premium and the higher the Delta value, but within limits- the position is out of the money. The question is whether the premium collected is enough to give up potential gains if the stock comes roaring back. If you roll out, how far out? I generally don’t like to roll out very far if I’m not collecting very much, but for some traders this is an ideal situation, collecting a little premium with very little risk of having the stock called away. It’s all a manner of perspective.
Stop selling calls on the stock for a while. I sometimes do this when the market is way down and it seems oversold. During big corrections or bear markets, I will let my calls either expire, or I may buy them back to close them when they have little value. In this case, I’m willing to wait a bit for the stock to make a comeback. If I’m not willing to wait, maybe I should close the out the stock position as well and put the money into something else. Sometimes, it is just time to cut losses and get out. But assuming that I want to keep the stock and I think it is just temporarily underpriced, I may choose to just hold the stock and not sell calls until the stock price is at a better value.
Which is the right choice? That’s up to each trader to decide. It also may depend on your view of the stock and the current market, as well as the stock’s cost basis. There are several factors to weigh, so there is no single answer for all situations.
To keep going with our earlier example, let’s say our stock declined from 201 to 195, so we decide to roll down and out.
With the stock price down, we decide to roll down and out and collect more premium.
We collect more net credit for this roll than earlier ones, because our old call strike is farther out of the money and IV has increased a bit. Our new Delta is quite a bit higher than where our old Delta has dropped to. We also make more on the call’s decrease in value from 0.69 to 0.15, a profit of $54. But, since our stock went down $6 a share, the stock lost $600. Our net change for the covered call is a loss of $546, so we lost less than if we held stock alone. So far, every example we’ve seen shows the call making our results better than if we had stock alone.
On the opposite side of the value scale, what does a trader do when the Delta value of the call gets high, or even gets in the money? This situation used to really frustrate me, because the covered calls probably have lost money when looking at the call alone. But, if you look at the underlying stock and the call, the total position is making money, even if the call ends up in the money. So, this is a better situation than when stock prices are falling and the short call is gaining. In fact, let’s instead think of this as a good problem to have. This time, let’s consider four ways to deal with this situation.
Roll out and up for credit. If the stock has gone up, let’s try to move our strike price of our call up as well. The problem is that it can be hard to collect a net credit because higher strike options are not as expensive as a lower strike. So, to collect a credit, we may need to go further out in time to find an option at a higher strike price that also has more premium than the current option that is being replaced. As calls get into the money, the deeper in the money they are, the harder it becomes to roll up for a credit. And the further out a call is rolled in time, the harder the next roll is to roll up and out for a credit. That doesn’t mean that you shouldn’t do it, it just means that it is more difficult.
Roll up and out for a debit. If a trader doesn’t want covered call strikes in the money and a position is in the money or close to it, the position can be rolled up to a higher strike, but it may cost more to buy the old option than the new option sells for, so the trader has to pay for the move. This is the opposite of collecting income from the stock, but remember that the stock has gone up a lot to get the call option into this situation, so in the big picture, the position is still winning. Perhaps the covered call seller just wants to make sure the stock won’t be called away, so rolling up is more important than collecting a credit.
Roll out at the same strike. You can almost always collect a net credit by rolling a call out in time at the same strike price, whether the strike is in the money or not. This can be a good choice when none of the other choices seem appealing, and you just want to “kick the can down the road” as people sometimes say. The beauty is that you get paid to just wait a little longer. Sometimes, the additional premium of a later expiration is enough to make exercise un-economic for the option buyer on the other side.
Let the stock get called away. Maybe the call you’ve sold is way in the money and you just don’t want to mess with it any more. If you let the option approach expiration, chances increase that an option buyer will exercise the option and your shares will be sold at the strike price of your option. Or you could sell your shares and buy the option yourself if you don’t want to wait for the option market to take out your position. In any case, the price you get is essentially determined- the strike price of the option is what you will get for your position. The advantage of the market exercising the option is that you don’t have to pay for your option to close it, so any extrinsic value plus commissions to close are saved. The reason to do this may be that you have decided that it is time to use your capital for something else. Maybe you’ve been holding onto the position to wait for it to be a long term capital gain and once it is there, it is a good time to cash out and do something else. If you are selling at a price more than you paid, it is a win regardless of how you got there.
So, what is the best choice? It depends on lots of things, but my preference is to find a way to roll up and out for credit as often as possible and roll out if there isn’t a good choice for rolling up. I generally avoid rolling up for a debit, but for some that may be a good choice. And when I’m ready to move on, I’ll let the market call my shares away. So there’s a time for each choice, and every trader needs to be aware of the various choices available to make the right decision for each situation they may be in.
Continuing with our example, let’s say our stock has moved from $195 to $205 in 14 days. That means our stock is equal to the strike price of our call option. We may decide to again roll to 42 DTE, but keep our same strike price.
Since we can’t roll up for a credit at 42 DTE, we keep the same strike and collect a credit.
In the table above, I’m showing the choice I made, along with another possible choice that I decided not to make. I could have rolled up to the 206 strike, but it would have been a debit with the 206 strike having less premium than the older 205 strike. I could have rolled out further in time to get a credit to roll up as well, but here I chose not to.
If you recall, we opened this 205 strike position at 1.03 premium when the stock was $195, so we’ve lost $281 on the call. But since the stock is up $10 a share, it has gained $1000 in value, so our net profit on the trade is $719. We could have made more this time, with stock alone, but we are still making almost as much on a fairly large up move in the stock.
Are Deep In-the-Money Covered Calls Bad?
I used to feel like I had lost when I had a stock that I sold covered calls on blow past my strikes. I was obsessed with the fact that I would have been in a better position if I had just left the stock alone and let it go up in value. To some extent, this can be very frustrating. For example, if I bought a stock for $100 and sold $125 calls against the shares, and the stock goes up to $300, I’ve missed out on a lot of gains. But, on the flip side, I’ve made the difference between the purchase price and the strike price, plus I’ve collected premium from each call sale. WE don’t have to have extreme situations to find positive ways to manage our in the money option with a roll.
Continuing our example, let’s say that our stock price jumps up to $215 from our previous $205 price, and now our 205 call strike is getting deeper in the money. Now, we decide to add time to try to roll up just a little.
to roll up to 206 for a credit, I had to roll out to 63 DTE.
As we get deeper into the money, it gets harder to collect a credit when rolling up, so we may need to roll a lot further out in time. In this example, I went out to 63 DTE instead of the 42 DTE I’d used in all the previous example rolls. But I gained $1 on the strike and still received a credit.
On this transaction, we started by selling a 205 call for 4.34, and we had to buy it back for 11.42, so a loss of $708. Meanwhile, our stock went up another $10 per share for a $1000 profit. Our net profit on the covered call position was $292. And don’t forget that in this latest roll for a credit, we sold a call for 11.45 that is $9 in the money, so we have $2.45 extrinsic value going forward.
For situations that aren’t so extreme, I often like to think about multiple streams of income and side benefits from having and rolling a covered call that is significantly in the money. Let’s start with income and then talk about benefits.
Income stream 1: Call premium. Even when we roll a call deep in the money, there is still some premium to collect. There is more extrinsic value for more time. Each roll may be a small percentage, but it will likely be more than the going interest rate, usually substantially more.
With every example we’ve looked at, we’ve collected a credit, selling our new option for more than we paid to close our old option out for.
Income stream 2: Lock in strike increase profits. Every time a trader can roll up a call option that is in the money, they are locking in that much more profit. For example, if you own a $200 stock with a $150 strike covered call, if you can roll up the call to $155, you’ll lock in $5 more profit on the underlying stock if/when you sell the position. Since we are talking about 100 shares, that’s $500 more value. I look for opportunities to roll up my strikes, even if that means going far out in time to collect a net credit. Sometimes, I’ll just set a good to cancel limit order to roll up to the next strike in the next expiration at an even trade- my goal is to just ratchet up my strike price and eventual sales price of my stock.
In our last example, this was exactly what we did. We moved our strike price up $1, so if we decide to close this trade, our option has $100 less intrinsic value and the stock would sell in an exercise for $100 more than with the lower strike.
Income stream 3: Dividends. If the stock or ETF you own pays dividends, this can be a huge benefit of the covered call position and a significant source of income. Additionally, keeping the shares over a long haul can make the dividends be considered qualified dividends from a tax standpoint as mentioned earlier, so keeping the shares can be doubly important for tax reasons.
But with dividends comes additional exercise risk. The bigger the dividend, the greater the extrinsic value of the option you need to have to avoid having the shares called away when a dividend is being paid. This may be a driving force for paying a debit to roll up strikes to an option with more extrinsic value.
Dividends on stocks with covered calls are kind of like double dipping for many traders. This is a primary income strategy for many option traders.
Back to our example. Remember that we had $2.45 extrinsic value? If our stock paid a $1 dividend after our last roll, do you think we would have had our stock called away? Probably not, because an option buyer is unlikely to pay $2.45 extra to collect a $1 dividend. Rolling out further in time gave us that benefit as well. We make $100 dividend just like a stock owner with no calls sold against the position.
Let’s switch to looking at the benefits we still have when a covered call is deep in the money.
Benefit 1: Downside protection. When you have a covered call where the call is deep in the money, a down move in the price of the stock will have little impact. As long as the stock price stays above your call price, the expiration value of your position doesn’t change. So, while you may have missed out on a big gain, you can take a big down move of the market without a big loss to your account.
I know several covered call sellers that intentionally sell calls in the money for this reason, to greatly reduce downside risk. They give up big upside gains to have lower returns but a big buffer from down moves.
Let’s say our stock drops from its high price of $215 to $210 as our call winds down towards 28 DTE. Our 206 strike call has gone down in value from $11.45 in premium to $6.54.
Since we aren’t as deep in the money, we can roll up by only going out to 49 DTE this time. We are still collecting a credit.
In this scenario, I chose to roll out an extra week so that I could also roll up another dollar in my strike price. But the big take away is what happened with my profit and loss of my position. My call made $4.91 while my stock dropped $5 per share, so my net loss was only $9, while owning stock alone would have been a $500 loss. The call almost completely bailed out my loss because it was fairly deep in the money.
Benefit 2: Lower overall volatility. Along with downside protection, a covered call position deep in the money doesn’t change much in value when the market goes up or down. It can be a portfolio stabilizer. The value of the stock and the intrinsic value of the option cancel each other out as the stock goes up and down in value. Only the extrinsic option value changes.
We can use Delta to see how this works. Let’s say we have a call with a Delta value of 80 sold against 100 shares of stock. Using our Delta math, we can see that the total position has a 100-80=20 Delta value, or represents only 20 shares worth of stock price movement when stock prices change. Said another way, for every dollar the underlying stock moves, our covered call position will only move 20 cents per share. For many traders, this is a very comforting position to be in.
If we chart our positions from all of our example trades, assuming that they we one after another, we can see that the covered call position is much less volatile than a comparison version of 100 shares of stock.
The covered call position, especially when in the money has much less volatile changes with prices.
Benefit 3: Tax considerations. If the stock is going up, and the stock owner holds over a year in a taxable account, the gains are long-term gains and taxed at a lower rate. Meanwhile if calls have been sold against the stock while the stock went up, the calls likely have lost money, but the losses are short term losses, which cancel out premium collected, and may be used to cancel out short term gains elsewhere in the account. So, as part of a process to minimize short-term taxable gains and maximize long-term gains, maintaining covered calls in the money can help give traders tools to manage when taxes come due and how much the bill will be.
If the underlying stock pays dividends, in the money calls may allow the stock owner to maintain long term holdings and collect qualified dividends, which may be taxed at a lower rate as well.
These potential benefits are in taxable accounts only. Consult with your tax accountant or do your own study for your particular situation. This isn’t intended to be tax advice.
To finish our example, let’s say I decided to let the option expire in the money and have my stock called away. At expiration, the stock dropped from $210 down to $208. I kept my $661 of premium from the option sale, but had to sell the stock at $207, a dollar a share less than the current price. So, from my last roll until having my stock called away, I lost $300 on the stock from $210 to the $207 sales price, but made the $661 in option premium for a net profit of $361. Meanwhile, a stock only position lost $200.
Benefit 4: Basis cost reduction. Many covered call traders look at the premium collected as a reduction in the cost basis of the stock. Each extra chunk of premium means that the total net price paid for the combination of stock and call options goes down just a little.
I know traders that have traded covered calls on a stock position that their total cost basis has gone to zero and then negative. At that point, they feel like they are playing with “house money.” From a practical standpoint, getting enough premium to pay for the stock would likely take many years, so I consider it more of a mindset than a true goal.
Many covered call traders refuse to sell calls at strikes less than their cost basis, but if they have used call sales to reduce their position’s total cost, they are willing to consider the revised lower basis as a lower limit instead of what they paid for the actual stock.
If we at all the example trades together, we see that the covered call position cost basis ended up a $19,717, while we paid $20,000 for the stock. In addition to the stock, we have accumulated $383 in cash by the last trade, including the $100 dividend. Considering that the stock mostly went up, getting a cost basis reduction is a nice benefit. Here’s a log for reference:
Here’s a list of all of our example covered call roll trades for referenceThe covered call position, especially when in the money has much less volatile changes with prices.
If we take all these example trades together, we see that the covered call position ended up beating the stock only position, even though the stock went up 4% during the time of the trade.
Will selling covered calls against a stock always beat just holding stock alone? No, if a stock goes up significantly, the calls will be deep in the money, and the profit will be capped to a small trickle of option premium coming in from challenging rolls for credit. But even then, there are advantages to having sold a covered call and continually rolling. Just don’t beat yourself up over what might have been.
These example trades went through several changing scenarios- out of the money, in the money, up trends, down trends. In reality, a covered call position can stay in one of these scenarios for extended periods. It can be a pretty boring trade. But in options, boring is often a good thing. When an option gets deep in the money, rolls get more challenging as we’ve seen, but there is still money to be made, and premium to decay.
Worst case scenario
As an option trader, it is tempting to think of a short call option of a covered call position going deep into the money as a bad thing, even a worst case scenario. But, this isn’t that bad- the overall position is still making money because the stock is going up at least a dollar for every dollar the option loses. The real worst case scenario is when the stock drops significantly. When the stock portion of a covered call drops 10, 20, or maybe 50 percent, there is nothing that a short call can do to cushion the blow. The call can potentially save a few percentage points of the loss, but it can’t protect it all, or even come close. In the end, a covered call still has significant downside risk.
Is there anything we can do to get rid of downside risk using a covered call? While we can’t eliminate all the risk, there are a few ways to consider using covered calls to reduce big losses over time.
First, as we’ve discussed, selling covered calls reduces our cost basis with every roll we do for credit. The more credit we collect, the more of a downturn the position can sustain and still be profitable over the life of the trade.
Second, we can choose to sell our calls in the money to start with to protect a portion of the downside. I know traders that do this as a standard practice. Here’s an example from Brian Terry’s interview on ThetaProfits. In the money covered call sellers know that there will not be a large profit, as the in the money call caps the upside, but the call protects a significant move down, making the position very stable in value in all but the most extreme conditions. For example, if we sold a call with a strike price 10% in the money, we’d have 10% downside protection. As a practical consideration, we’d likely have to sell this call well out in time to have enough extrinsic value to have any time decay, but there is that possibility so we can still make money from premium decay.
Covered Call Conclusions
Rolling covered calls provide many opportunities for profits and additional benefits. Reduced volatility and additional income top the list. In virtually every market scenario there are ways to keep rolling and keep collecting net credits from option premium and get the benefits of time decay.
Beware of the trap of worrying about losing money on calls that go deep in the money, but be more concerned with the true risk of losing money from stock price declines. With the right mindset, rolling covered calls can be a great way to benefit your portfolio.
I recently published a couple of studies on two different variations of a trade that sells what many would call a “Poor Man’s Covered Put,” a diagonal trade focused on collecting income from rolling a short put day after day. After a lot of review of some different daily diagonal rolling trades using SPX puts, I’ve continued to question whether the choices for strikes and expirations I’ve been trading are optimal. Could a backtest help?
To dig into details of the trade, including suggestions for managing outlier events, check out Very Long and Very Short Put Diagonal, and Daily Diagonal Covered Put. One uses a long put with a 5 year expiration and the other uses a long put with 60 days, while both sell a short put with just a few days until expiration.
Without going into every detail of the trade, we are talking about buying a long-dated put and selling a short-dated put as a combination trade. The two options will have different expiration dates and different strike prices, which is considered a diagonal trade. The idea is that the put that was sold, the short put, will decay faster than the put that was bought, the long put. To maintain the trade, we just continuously roll the short put day after day, collecting more and more premium- at least that is the plan. When the market moves, we have alternative plans to manage the positions, which are detailed in the other write-ups.
A couple of things bothered me about each trade. With 5 year expirations, interest rates play an outsized role in the performance of the long put, plus the trade ties up a lot of capital. At 60 days, having a long strike lower than the short caused some buying power issues when rolling strikes. In both cases, extended down moves greatly impacted the short put losses, while the long put didn’t provide that much protection. So, are there better choices out there?
As I researched the previous two articles, it struck me that higher Deltas would provide better long protection on the downside, and more short premium on the upside. I wanted to see if that played out in real life. I also realized that the shorter the duration of the long put in the trade, the less capital is tied up, making gains greater as a percentage of capital used. But it cuts both ways, the shorter duration long puts can’t provide the ballast of big capital and the day to day profit and losses as a percentage of capital are much bigger. So, is there a better setup to consider?
I turned to two sources to try and find some better answers- theoretical modelling and backtesting. For backtesting, I used the free service from TastyTrade.com. Their application only allows options with expirations up to 365 days and it can’t show results of trades closed in the past if the expiration is later than the time the backtest was done. But otherwise, I was able to get some meaningful data from trying different values in the tool. I also couldn’t put any complex rules for rolling just one side or managing rolls differently when the strikes get into the money, so I just set up to trade the same diagonal positions based on DTE and Deltas every day and close the trade after one day in trade. So, in effect, this backtest would similate rolling both sides of the trade back to center every day, a different approach than presented in the earlier articles, but similar enough that the data should directionally help point out better trade choices, if they exist.
Optimizing the 60 Day Long for Best Delta
In the write-up on the Daily Diagonal Covered Put, I used a 60 DTE long put and a 3 DTE short put, both at 40 Delta, which when I first started trading this strategy seemed high. When selling puts, typically Deltas in the 20-30 range seem to perform best, but in a diagonal situation, there just isn’t much room for error. Moving to 40 Delta helps by giving more bearish protection from long, and more premium on the short side to contribute in an up move. I put a backtest together for that trade, and it showed a 106% return on used capital for 2024, with a maximum drawdown of 34%. You can see it in the other page by following the link.
So, what if we kept going to 50 Delta on both the long and short options, keeping the same expirations? We get similar results:
60/3 DTE Diagonal with 50 Delta strikes Held for One Day- Entered every day
You can compare these side by side, but here are the takeaways from my point of view. The 50 Delta version requires a slight bit more capital. It also made more profit in dollars, but the percentage return total is slightly less. However, the 50 Delta version also looks a little less volatile, with a max drawdown of 30%. Interestingly, the biggest daily gain is bigger on the 50 Delta version, but the biggest daily loss is smaller- that’s two benefits I was looking for- better protection and more premium.
For reference, here is the setup of this trade, assuming the SPX index is trading at 6000:
I didn’t color in the profit and loss areas on this chart, but you can see that essentially after one day there is a profit if the index stays within the expected move. The backtest shows a 64% win rate, which looks to be right on what we would predict, as the profit curve isn’t completely covering the whole expected move. As a reminder, we expect to stay within the expected move 68% of the time. For more about Expected Moves, see the linked article.
It looks like our backtest profit per day is about 1/5 of the theoretical Theta value. If we can keep 20-25% of the Theta we have available, that’s a good trade.
Where is the maximum return?
Okay, it’s great that a little tweak can make some minor improvement to results, but let’s try other values. I spent a few hours entering different long and short duration values, and also playing around with different Delta values, and finally settled on 10 days for the long put and 2 days for the short put. Here’s the backtest results:
10/2 DTE Diagonal with 55 Delta strikes Held for One Day- Entered every day
This backtest really is impressive! Start with 195% Return on used capital, essentially 1% per day! This trade makes about the same dollar profit as the 60 DTE trade above, but uses half the capital. Additionally, the biggest one day gain is bigger in absolute dollars in this version than the 60 Day version and the biggest daily loss is much less, in fact in this trade the biggest daily loss is smaller than the biggest daily gain. The maximum drawdown on a percentage basis is slightly bigger, but much less on a dollar basis.
Let’s look at the setup of this trade on a theoretical basis, and see what kind of strikes we would be trading if the market were at a current price of 6000:
Notice again that the profit area of the chart is mostly inside the expected move, but not quite as much as the 60 Day version. And that plays out in the backtest where we have a 62% win rate. However, if we widen this chart, we see a big difference on downside risk:
Notice that the lowest one day loss flattens out to a little less than $2500, where other versions of this trade go down much further before they flatten out. With less duration in the long, the Delta of the long quickly catches up with the short as they approach 100, and there is the added benefit that the long is a higher strike than the short, so the very deep in the money value is less than the premium paid to get into the trade. So, even though we show the debit paid for the trade as the risk, the max loss is actually less on the down side. And if we look at the back test, we can see that the biggest daily loss was about $1400, which is less than this model predicts, probably due to different Implied Volatility at the point in the year when the loss occurred.
Before going further, you may be curious if I looked at even higher Deltas? Yes, I did and they started showing lower returns, probably because the increased capital required didn’t provide additional profit. What about 9 days, or 7? Or maybe 11? I looked at all the DTEs around 10 and 10 was best. I can only assume that maybe that has to do with 10 DTE being where IV tends to be minimized in the term structure, so premium has the best bang for the buck there? That’s only a guess, but it seems to be the best point in time according to the backtest. To be fair values a few days more or less or a few Deltas higher or lower weren’t that much different in the backtest results, but I found 10 DTE long, 2 DTE short, and 55 Delta optimized results.
Can we improve the 60 Day Diagonal?
After seeing that 2 DTE for the short worked better at our best spot along with 55 Delta, I went back to see what would happen with those changes with a 60 Day long put. Here’s the results:
60/3 DTE Diagonal with 50 Delta strikes Held for One Day- Entered every day
How about that! We improved our percentage return to 100% of used capital. We reduced our maximum drawdown. We raised our maximum daily profit more than we increase our biggest daily loss. We did need a little more capital. So, I’d call it marginal improvement over the earlier 60 day option.
Final Thoughts
One point to make sure everyone understands is that past performance in no guarantee of future results. Backtests show how something would have performed in the past. They also are completely mechanical and don’t take into account any human element of decision making, either good or bad. It also matters what timeframe the backtest was run, and 2024 was a mostly up year. However, I do think that they can point to help directionally compare different choices and show which kinds of trades have a tendency to do well and which don’t. Looking at values like biggest drawdown and largest daily loss starts to give you an idea of what the risk can be of a trade, and backtests with big upsides show possibilities for profits if conditions repeat.
I also studied different underlyings to see if similar results were possible, even if using weekly expirations. I’ll save that for another write-up in the future, but intial backtests look promising, matching what some of my option trading buddies have shared with their use of diagonals.
After working with the backtest and modelling different results, the conclusion is that our optimal setup appears to be much shorter duration long puts and much higher Delta values than what has been presented previously. Because my starting point was 5 year long puts, it took a while to realize that the better choice was much less convoluted and much easier to manage. Sometimes, it is easy to over complicate things. Here’s to keeping it more simple.
Feel free to leave a comment and share your experiences with this style of trade.
On August 5, 2024, the volatility index, VIX, spiked to 65, the fastest spike in Implied Volatility ever recorded. Anyone with significant holdings in naked options, including the 112, likely took significant losses.
The August 5, 2024 VIX Explosion Impact
In August 5, 2024 pre-market trading, the volatility index, VIX, spiked to 65, although the market was only down a moderate amount. The market had the fastest spike in Implied Volatility ever recorded, and anyone with significant holdings in naked options, and especially the 112, likely took significant, if not catastrophic losses.
Stock traders shrugged, but option traders, especially short in futures options, saw premiums explode to extreme levels. Short traders saw margin requirements explode and marked positions move to 10, 20, or even 30 times the initial amount collected in losses they couldn’t escape in illiquid markets.
The 112 trade, which is written about on this site in several places, was the poster child for big losses. Often traders use futures options that are leveraged to the max using SPAN margin. The trade promises to have a buffer of a 1-1 debit spread to provide a barrier from big losses in downturns. The 2 other short strikes are set to be so far out of the money that they should almost never get in the money for big losses. But this time it didn’t work- a fairly small downturn created huge losses and extreme increases in margin requirements.
Many seasoned traders I know saw their accounts reduced by 30-50% overnight with their brokers liquidating positions to satisfy margin requirements. In short, the debit side of this trade didn’t provide the promised protection during this event. Many traders, including me, saw big losses even though the debit spread didn’t even go in the money and the short puts were still well out of the money. It was the implied volatility that did the positions in, not the actual underlying market indexes.
Personal Impact
My experiences were mixed during this episode, but in all cases very eye-opening. I’ve done a lot of modelling of option pricing based on historical moves, the speed of moves, and other factors, and felt like I had a pretty good understanding of how volatility changes, even in big market moves. I survived the Covid crash, for goodness sake.
In most of my accounts, I had sufficient cash or cash equivalents to prevent a major problem with my account. However, I had one account that had two contracts of 112 positions that were using 90% of the account’s buying power before the big August 5 event (a bad idea in so many ways), and that account suffered a huge loss and was liquidated by my broker. I suffered a 250% loss, going from +$11,000 to -$17,000 overnight, which isn’t a small loss for anyone. My broker sold all of my short positions at the very bottom, in the early morning hours before the market even opened, locking in the losses, and then left the long spread positions to decrease in value as the market recovered, not allowing me to trade anything, due to having negative buying power in the account. It was a very helpless feeling to watch and see that much money evaporate. And then I got the email asking me to add money to get the account out of the hole. I asked why they had waited so long to close the positions, and why they didn’t wait any longer, but it isn’t the broker’s fault for this. It’s my problem and I have to own it. I simply got complacent and didn’t follow any of my own rules for capital allocation. I was greedy and I got burned- bad.
I wasn’t the only one, and in the aftermath, I read several option trader’s notes (that actually sell their trading advice) that lost years of profit during this event.
For all my other accounts that survived, the swings in value in accounts that had short options trading with margin was troubling and surprising. The fact that the values recovered as fast as they declined doesn’t change the fact that this could have been much worse and there are many lessons to learn.
For most stock investors, or even traders that sell option spreads or covered options, this event was no big deal. It was a problem for mainly for traders who sold naked options on margin, and especially for those that sold naked futures options on SPAN margin.
So, what actually happened, and why were so many option traders caught unprepared? Let’s dig into what happened, and then discuss how to avoid this kind of negative impact in the future.
The Perfect Storm of Fear
Markets were cruising to new highs in mid-July when it seemed that the market realized that maybe it was the time of year to finally step back and the market came down a bit. It was no big deal until August when the July jobs report came out on Friday August 2, showing very weak jobs data and an unexpected increase in unemployment. The market fell 1.8% during the day and there was a sense that the nation’s economy might be in trouble. Then over the weekend, foreign markets reacted, primarily in Japan, where the yen surged in value compared to the dollar, and many “safe” currency trades quickly unraveled. The Japenese stock market plunged over 12% in early trading, and the rest of the world followed along as other markets opened for Monday trading. With US Futures trading open, prices of all the indexes started down. Everyone trading wanted to get out, but there was no one available to bail them out. Futures options were the worst, with enormous bid-ask spreads with no one willing to make the market flow in orderly fashion. It was still the middle of the night.
Option traders awoke to alerts and margin calls from brokers. With an hour to go before the markets opened, buyers stepped in and started grabbing the bargain prices that were available, and selling short options for the astronomical prices that contracts were marked at, as brokers liquidated the unfortunate accounts of those who hadn’t cleared their negative balances. For those with cash, it was the opportunity of a lifetime. For those in trouble, some lost life savings over night. The best and worst of times.
When the market opened, it was down 3% from Friday’s close, but up from the worst levels of the night. It recovered about a percent in the morning but closed near where it opened. However, there was a sense that the worst had come and gone. Option prices quickly came back into somewhat normal ranges, and margin requirements relaxed. As the week progressed the market slowly eased up, day by day. By the end of the week, the market was essentially unchanged from the end of the previous week. Did anything really happen, or was it a dream? For almost everyone invested in the market, this situation was a non-event, a slight downturn, a bit of noise. But for Futures options traders that had naked positions, this was a never-to-forget nightmare.
By mid-August, it appeared that all the worries were for nothing. The US market moved back to near the record high levels set in July. Happy days were here again. But this isn’t normal.
Unprecedented Changes in Implied Volatility
In the past, increases in Implied Volatility have taken much bigger declines in the market for this big of a change. For example, during Covid, the market was down over 30% and the VIX volatility index hit 80 at the bottom after several weeks of large daily declines. The whole world’s economy came to a grinding halt and the market slid with it. At the time it was one of the most terrifying situations the world had seen.
In contrast, at the market’s lowest point on the morning of Monday, August 5, the S&P 500 futures were trading about 10% below the peak they hit in mid-July, and VIX sky-rocketed to 65. It was at less than 30 the Friday before. This rapid expansion in Implied Volatility over such a small timeframe and relatively small index price drop was unprecedented. Option prices multiplied in value and SPAN margin requirements for futures options increased exponentially. Brokers reached out in the middle of the night asking customers to add capital to their accounts, but from where, and how? Since the markets were closed, only minimal amounts of trading was going on and markets froze up with orders becoming unfillable. Trapped traders couldn’t get out, assuming they were even awake and aware of what was going on.
Likewise, the decrease in the VIX volatility index over the next few weeks was also remarkable. By August 16, the VIX index was below 15. Historically, large increases in volatility take months or even years to return to low levels, so this spike from levels of around 12 in early July to over 60 a month later, then back to 15 in less than two weeks is different than anything ever seen before.
For those not familiar, the VIX index is calculated by the CBOE to measure the volatility implied by options on the SPX index with expirations around 30 days away. The VIX index is not tradeable directly, but there are tradeable options, as well as futures that can be bought and sold. VIX is often considered the market’s “fear gauge,” but technically it is an evaluation of how richly options are priced. Since options are priced based on known values, with the only unknown value being volatility, this measure of “implied” volatility impacts all option prices. The numerical value of Implied Volatility of any option is a measure of how much the market expects the underlying security or index to move over the next year, but pro-rated down to the amount for the time left until option expiration.
Margin impacts
Margin works in a lot of ways with options. See the article on margin to learn more. But margin as true leverage is most apparent when selling naked options. For naked short options on stock, ETFs, or Indexes, most margin requirements are based roughly on having 20% of the notional value of the underlying in the account to cover a big move. So, one option contract on a stock trading at $100 would have a notional value of $10,000 and a seller of a naked option would be required to have $2000 for every contract, or would use $2000 of buying power or capital for each contract. If the stock moved 5%, the margin would likely require another 5% of the notional value, which could be as much or more than the premium collected.
If a trader is selling naked options on futures, a different margin calculation comes into play, SPAN margin. SPAN margin is a complex formula, but basically looks at the futures options positions and calculates a worst-case one day move, based on the IV of each option and other factors. This is typically a much lower requirement than what is required for options on stocks and ETFs, so a trader can have a lot more leverage. However, this works both ways. When the market moves, additional margin can be required based on the amount of the move, plus the amount that the “worst case” increased to. On August 5, when VIX spiked to over 60, the worst case scenarios as calculated by the SPAN margin calculation exploded by huge amounts, in addition to losses in holdings that were highly leveraged. As VIX virtually tripled, buying power requirements for futures options also went up by triple or more, when accounting for losses on top of the increased SPAN margin requirements.
Many traders in turn faced margin calls from brokers, asking them to get buying power from negative values to positive. For some the only way to do this was to buy back badly losing positions at big losses at terrible prices with terrible spreads. As much as anything, margin requirements drove liquidation as much as price movement.
The lesson on margin with options from this event is to always have cash or cash equivalent positions that can be easily liquidated to have cash to cover all margin requirements. Even a trader with the worst naked option exposure positions would be alright if their account was 80-90% cash. For me, I had accounts that I had to sell short term bond ETFs to cover buying power requirements on August 5. Every account but one was fine.
Within a few hours of the worst of August 5, VIX dropped significantly, and SPAN margin requirements reduced as well. The question was a matter of whether each trader had enough capital to weather the storm.
Marked loss impacts
When implied volatility spikes, Vega raises the price of options. On a percentage basis, the impact is greater for strikes further out of the money. For the 112 trade, the “1-1” portion of the trade that includes a 50 point wide debit spread has both strikes increase in price, fairly close to the same amount, while the two far out of the money strikes also rise substantially, but with nothing to cancel out their rise. The overall impact is that the total premium can grow much more than even the percentage increase in Implied Volatility. This is especially true if the positions were opened during a period of very low IV.
So, for a trader that opened a 112 trade when IV was down around 12-13 VIX, the explosion to a VIX of over 60 made the position’s premium value explode to 10-20 times what was collected, something that most traders would never have expected.
Position size considerations and notional value
With the 112 trade on /ES futures, a trader can use as little as $5000 buying power to control $500,000 of notional value. Even at very low Delta values for the 2 short strikes, it doesn’t take a very big move down to lose way more than the initial buying power. As we’ve just discussed, a big move causes two immediate problems for the trader, a marked loss as premium explodes, and an explosion of buying power requirements.
What is the solution? Keep trades like these a small portion of an account. The vast majority of the time, these trades just decay, leaving the seller with great profits, but when that rare occasion occurs, there needs to be plenty of capital in an account to cover losses and have the ability to manage the position.
Impact of the number of net naked options
I’ve tended to trade mostly covered positions and spreads, where this kind of scenario can’t happen because risk is defined, and a position can’t lose more than the buying power it requires. But it is easy to be persuaded by the siren call of those that tell traders to put on their big boy pants and sell naked options. Somehow, this is considered by some to be the mark of a mature option trader.
Often, traders are told that the buying power required is a good indicator of the risk of a trade. I’ve seen dozens of studies that make this claim. But typically, if you look at the fine print, these studies will say something like naked trades don’t lose more than their buying power 99.5% of the time, or some other high percentage. The problem is that the percentage is not 100%, and that little percent will surface on rare occasions, usually when least expected, immediately after a period of very calm markets.
The key isn’t to completely avoid naked trades, it is to manage the number of naked contracts being traded. During the August 5 event, 112 traders were much more impacted than 111 traders. The difference was two naked puts instead of one. Does that mean traders can load up on 111 and be fine? No, it just means that comparing two trades that both use naked options needs to account for the number of contracts that are naked and the difference in notional value and tail risk. Maybe the 112 trade has a slightly better return on capital typically than the 111. Is the additional risk worth it?
And it isn’t just the naked portion of multi-leg trades that need to be considered. Individual naked trades, as well as strangles or straddles sold naked can be even more susceptible to tail risk. There is a line of reasoning that diversifying will greatly reduce these risks, but in periods of uncertainty and big moves, prices fall across the board and implied volatility spikes everywhere.
Keeping the number of naked positions under control in an account may be the way to prevent a blow-up the next time the market melts down.
Defined risk vs. Naked Risk
If we compare risk of different types of option trading strategies, we can see that there is no risk-free way to trade options, and each risk level has a different set of risk parameters. Probably the closest comparison to selling naked options is to sell credit spreads.
Often, traders confuse the defined risk of credit spreads with being low-risk. In a credit spread, there is the very real risk of losing 100% of the buying power that was required or “defined” by the trade. However, during the August 5 event, the move didn’t impact most traders with out of the money put spreads, because both the long and short strikes of the trade went up significantly in value and if still out of the money, the net premium only went up a portion of the buying power as the moves mostly cancelled each other. Only when prices take an entire spread into the money are worst case scenarios in play. During the Covid crash where the market went down over 30%, this was the case for most spread traders. But on August 5, probably not.
Naked trades on the other hand have no hedge of a long option to provide any protection when the going gets tough. Naked traders are susceptible to both premium increase and buying power requirement increases at the same time when implied volatility spikes, even if the underlying price doesn’t move that far. This is the lesson for naked traders from August 5.
When the tide goes out, you find out who is swimming naked.
Warren Buffet has many famous quotes, and this is one of them. On August 5, 2024, if you were swimming naked with futures options in particular, or even naked options on margin in general, you were probably exposed. I’m not sure that this is exactly what Mr. Buffet meant by this saying, but in this case, a literal interpretation is very fitting.
One time event, or regular occurrence?
What happened on August 5, 2024 was a very unique set of circumstances that came together to create an unprecedented spike of implied volatility. Never before has VIX shot above 60 so quickly, and never before has VIX receded so quickly. So, is this rare event a once-in-a-lifetime occurrence, or will we see similar events on a regular basis?
I’m afraid that we are going to see this type of event many more times. We’ve seen global financial squeezes happen in the past, and this wasn’t even that crazy of a situation. The final straw that broke the proverbial camel’s back with this event was a liquidity crisis in Japan over a weekend. We’ve had other big banking fiascos around the world before and this one may not even be in the top 10 ugliest. What is different is the sheer amount of option positions that are in place now compared to only a few years ago. Today, it is normal for option volume to exceed the number of actual shares traded on major exchanges.
Why does the amount of option volume matter? While shareholders of stocks can simply hold through most downturns, option traders are often leveraged in fairly short duration positions that carry significant risk. When markets change, more traders need to purchase protection or need to get out of losing trades to stop their losses. If this happens when markets are closed, there isn’t much liquidity, and few sellers, so option prices go up, driving up implied volatility. With lots of people wanting to buy to get out or buy to protect, the lack of sellers can cause a panic. This is what we saw on the morning of August 5. Nothing has fundamentally changed since then, and option traders are continuing to grow in numbers.
My fear is that it will take less and less significant events to drive implied volatility and option prices to extreme levels going forward. So, if you weren’t impacted by VIX spike of August 5, consider this a warning shot across the bow. For some of us, they sunk our battleship. Don’t let it happen again.
The first half of 2024 was very good for the 112 strategy. Here’s an analysis of real trades, plus some choices if the market had crashed.
So far…
Occasionally, it’s good to look back and see how a strategy is performing. A lot of traders reach out with questions about the 112 strategy, so it seems like a good time to share some good news. When things are going well, it can be good to review details and see what insights can be gained. It’s also a time to consider what could go wrong in the future. For six months this trade has made money every single time I’ve traded it. That doesn’t happen often with any strategy, so it’s worth taking time to discuss.
I’ve been trading the 112 strategy for quite awhile. I’ve written about it here. That page goes through all the mechanics of the trade, so I won’t repeat that in this post. Instead, we’ll dig into some real world examples and talk about how I chose to manage the trade in a few different scenarios, and answer some questions that I’ve been asked in other forums about worst case scenarios.
A Brief Review of the 112 Strategy
While I won’t repeat the page on the 112 strategy, let’s do a brief overview of what this option strategy involves. Typically, I trade this using /ES futures options on the S&P 500, but I know lots of traders who trade it with other underlyings. I open the trade between 55 and 120 days before option expiration. The three digits of 1, 1, and 2 represent three different put option positions being traded in a ratio of 1:1:2. The 1-1 parts of the trade are buying a 50 point wide put debit spread that costs about $10 to open, and then selling 2 puts that are selling for about $10 each. The net result is that the opening of the trade is around $10 credit. How do I find the right strikes? Just do a little trial and error in the option table to find strikes 50 points apart that are $10 difference in premium. You’ll notice in my results that I actually try to collect slightly more than a net of $10, by picking a put debit spread that is slightly under $10 and selling puts with a premium of slightly more than $10. I usually end up somewhere between $11 and $13 net credit to start. Since I am trading /ES, there is a 50x multiplier, so the actual dollar credit to the account is $550 to $650 with that level of premium.
Most of the time, this is a slow boring trade that slowly decays. If the market goes up, I can usually close the trade for about 20% of what I paid and keep 70-80% of the premium I collected. Often, I only buy back the 2 far out of the money puts, and keep the 1:1 put debit spread in place as cheap insurance. I almost always close the 2 far out short puts early before expiration, usually between half and 2/3 of the way to expiration from when I entered.
Occasionally, the market drops and as long as the drop is not super quick, I can often close the trade for a credit. This happens when the 1:1 put debit spread goes into the money, but the 2 short far out puts have not increased that much. This can get a little nerve-wracking, but this is where big money comes in and why it makes sense to trade the 112 vs just selling one put for $10 out of the money.
On rare occasions, which hasn’t happened this year so far, the market will drop quickly, and 112 positions that are new and haven’t had time to decay will lose money. The 2 short puts will jump in value faster and more than the 1:1 put debit spread increases. If the 2 short puts were ever to get in the money, the losses really explode to catastrophic levels. A trader never wants that to happen. This is what people constantly ask about, and rightfully so- what can I do to prevent my account from blowing up in this situation?
The Results
Here’s a table of trades opened in 2024 that were closed by early July. It seemed like a good time to show this concept. There’s nothing special about the sheet- I just made columns for things I thought were important so I could look back later and see what I could learn. Others may track in different ways.
Most of the trades I chose were the 112 strategy, but you can see I sprinkled in a few 111s. The 111 trades were typically entered when the market was a little down and IV was up, giving me a little cushion on entry. You can also see that I varied the DTE entry, with many trades in the 50-65 DTE range to open, and others well over 100 DTE. Longer duration trades use less SPAN margin on futures and allow the far out puts with much lower strikes, but also a bit slower decay.
You can see that most trades were closed between 50 and 75% of the initial duration. In most cases, well over half the premium was kept. I’ve shown the initial premium collected and then the debit that was paid to close, or in several cases, there are negative numbers that mean I actually collected a credit to close, double-dipping with a credit to open and a credit to close.
From the data, you can see three different types of outcomes as mentioned earlier. When the market was on a sustained up move from opening, the trades were usually closed with about 70-80% of the initial credit kept. The trades could have been held to expiration, but closing them or just closing the far out put freed up capital to start new trades. Often, the put debit spread, the 1-1 of the 112 strategy was kept as insurance as there was usually very little value left in those two strikes.
When the market dipped in April, the opportunity came to close several 112 strategy positions for a credit. As price dropped to approach or even go below the upper strikes of the put debit spread, and the far out puts that had decayed already stayed at a low value, the net result was put debit spreads that were worth more than the 2 far out of the money puts combined. I generally watched the Delta values along with Theta to decide when to exit. I didn’t want to let the market get too close to my 2 far-out puts, and I also didn’t want the market to go up past my put debit spread before I closed the trade. You can see several trades that closed in that time frame with a credit, some close to the credit that was collected to start. One trade actually had a bigger credit to close than was received to open. I didn’t try to hold any of these trades to expiration and pin a maximum credit of $2500 per contract- the value of a $50 spread with the multiplier of 50 from /ES, it just never seemed like a position was going to settle there. In hindsight, I don’t think any of them would have- the market came back up not long after I closed the winning credit 112 positions.
There were two trades that are highlighted that were closed for less than 50% of the credit received. These were trades where the market dropped almost right away after the trade was entered. In these cases, when the put debit spread was breached, the 2 far-out puts were also gaining considerable premium. I decided to get out while the trade had a profit and not chance a further decline that could quickly explode to the downside. On one of these positions, I closed the put debit spread, and rolled out the 2 far-out puts to 151 days at a much lower strike, collecting $20 premium and buying a $10 put debit spread for an unconventional trade that closed three months later for a nice profit. So even the “bad” 112 strategy trades turned out okay.
What if…?
Clearly, it could have been worse, and the market could have fallen much faster, leading to big losses. I’m often asked, how can someone manage those kinds of really bad situations with this trade. I have three ways that are very different and each appeal to a different type of trading style.
Set a stop loss, either mentally or with your broker. Many traders I know will set a stop loss at 1x the maximum gain, which for 1 /ES contract of the 112 strategy is typically around $3000. Given that the average gain per contract was around $400, a trader needs at least 7-8 wins for every stop loss just to break even. But considering that it is possible to go a year or more without a loss, that isn’t bad odds. Just know that when the losses come, they are likely to come in numbers, so seller beware.
Define the risk by buying a protective put way below at the opening. This is the whole point of the 1122 and 1111 trades. Losses could be much larger than the stop loss tactic above, but losses are limited to the width between the double credit spread created way out of the money. Some traders add an additional put to make the strategy 1-1-2-3, with the idea that a very, very bad market drop could make the three cheap puts end up worth more than the two short puts- a reality if the market drops 30% within a few months. Besides still having a big maximum loss, adding long puts reduces Theta, so overall decay is slower. But for the once a decade event that crashes the market, this could save a disaster.
Get creative and roll the short put that is being tested way out and down for a credit. Bet that the market will turn around and give back all the losses that were taken. If possible, buy a new 50 wide put spread above the new strikes for $10, creating a new 112 strategy. This is the tactic I used on April 22. It worked out, but I wouldn’t recommend it. Most traders take their losses and move on, and consider this type of loss rolling irresponsible.
So there you have it. A variety of 112 strategy trades from the first half of 2024. Plus a reminder of things that might be done when the market has its eventual down move that is much worse than the little spring dip of this year. Happy trading everyone!
Follow-up note: As with many things, timing is important in trading. Within a few weeks of publishing this post, the market had the fastest spike in Implied Volatility ever recorded, and anyone with significant holdings in naked options, and especially the 112, likely took significant, if not catastrophic losses. In August 5, 2024 pre-market trading, VIX spiked to 65, although the market was only down a moderate amount. Stock traders shrugged, but option traders, especially short in futures options saw premiums explode to extreme levels. Short traders saw margin requirements explode and marked positions move to 10, 20, 0r even 30 times the initial amount collected in losses they couldn’t escape in illiquid markets.
Many seasoned traders I know saw their accounts reduced by 30-50% overnight with their brokers liquidating positions to satisfy margin requirements. In short, the debit side of this trade didn’t provide the promised protection during this event. Many traders, including me, saw big losses even though the debit spread didn’t even go in the money and the short puts were still well out of the money. It was the implied volatility that did the positions in, not the actual underlying market indexes.
I’ve written a separate longer analysis of this situation and the take-aways that all option traders should take from this. While this event was unprecedented, due to the amount of trading now done in options, I suspect that there will be similar, if not worse, events on occasion in the future.
1-1-2 put ratio option spreads are a very high probability trade. The 1-1-2 can be very profitable for sophisticated traders using margin. This trade has very high tail risk for extreme market moves.
I’m a big fan of front ratio type trades. I’ve written about my success with Broken Wing Butterflies and Broken Wing Put Condors. Taking this to a new level is the 1-1-2 Put Ratio trade. This is a new level of ratio trade, because it features naked options with a buffer of protection from a debit spread. The idea is a bit complex to grasp at first, and this is a trade only for traders that have a deep tolerance for risk. The trade involves buying one put and selling a total of 3 puts further out of the money to collect a net credit. Theta makes the value decay quickly, and over time, the purchased put can protect the short puts from most market moves.
I’ve written a separate post on the defined risk version of the 1-1-2 trade, the 1-1-2-2 Put Ratio, while the Broken Wing Put Condor, or 1-1-1-1 is a defined risk version of the 1-1-1, another ratio trade that is very similar. I don’t know of a named reference to a bird or insect for this trade, so I’m sticking with 1-1-2, although I’ve heard some liken the profit curve to that of a whale with a big profit hump and long tail.
I picked up the concept of this trade from one of my favorite traders, “Sweet Bobby” Gaines, who I have mentioned previously in at least one other page on this site. Bobby is a big proponent of the 1-1-2 trade, and has posted numerous videos on it on his YouTube channel, including his recent rising star appearance on Tasty Live. But really, these trades are the next level of evolution moving from broken wing butterfly to broken wing condor to “one louder” as they say in the mythical group Spinal Tap.
What all these trades have in common is selling an out of the money debit put spread, and financing by selling further out of the money puts. The combination delivers a net credit, but also sets up an interesting dynamic of extra rapid decay of the premium involved. The farther out puts decay faster than the closer debit spread, and often lead to the debit spread having more value than the farther out of the money put. This trade takes in a credit to open, and can possibly take in a credit to close. At least that’s how I set them up and manage them.
All these trades are a variation of a front ratio spread, where more options are sold than bought with hedges added to define risk. I’ve also written about back ratio spreads where more options are bought than sold. Front ratios are designed for maximizing decay, while back ratios set up multiple long positions paid for by a costly short position. So what is a 1-1-2?
1-1-2 Basic trade setup
The 1-1-2 takes this a step farther than the broken wing butterly or condor, because we use two puts very far out of the money to pay for the debit spread. The 1-1 part is buying a put around 25 delta and selling a put around 20 delta. The -2 part is selling two puts at around 5 delta. The goal is for the 2 puts to sell for about twice what the 1-1 debit spread cost. I like to set these up with 50-55 days remaining to expiration, quite a bit longer than the other ratio trades I’ve discussed. The added time allows the naked puts to be extremely far out of the money, while still having some meaningful value. I know other traders that go out even farther to over 100 days to get the strike price of the two very far out puts 25-40% below the current underlying price. Like all trades, it’s a matter of personal preference once you know the trade-offs.
What is the advantage of this setup? Well, because each of the two short strikes are further out, we greatly improve the odds of being profitable, and increase the initial rate of decay of the total position. We end up with a big gap between the debit spread strikes and the two short put strikes. Lots of good things happen with this setup. The biggest upside is that there is no upside risk- if price goes up, the trade makes money. The downside of this trade is that it can consume a lot of capital and has significant tail risk, which we will get into before we are done. Let’s look at a typical example.
The 1-1-2 trade has two naked puts sold short, but way out of the money.
While this table shows the risk as unlimited, it is actually $618,855, the value of two 3100 puts if SPX went to zero by expiration ($620,000) less the $1,145 collected to start the trade.
Some accounts and some brokers require all trades to be defined in their risk. For example, retirement accounts generally aren’t allowed to use option margin and so any naked put would have to be cash secured. That’s why I’ve written the note about the 1-1-2-2 trade which defines risk to just over $100,000 with two even further out of the money long calls (which is still a huge amount). For this 1-1-2 trade, eliminating those two long puts would mean the max loss would go up to $618,855, assuming that SPX went to zero, while we are holding two short 3100 puts. SPX will only go to zero if we see modern society end, and in that case, we’ll probably have bigger problems than our option positions. But rules are rules, and so if you want to trade without the long puts in a retirement account, you would need $620,000 capital to make a likely $800-$1200, or less than 0.2% return in 55 days or less, probably not the best use of capital. We’ll discuss other alternatives after we review the details of the 1-1-2 trade.
The profit profile for the 1-1-2 is very similar to the 1-1-2-2 other than the virtually unlimited loss.
This chart shows how changes in the underlying price will impact the profit and loss of the trade. We evaluate at four points in time. The green diamond shows our initial position at 55 DTE, underlying price is $4000, and the P/L is zero. The curvy lavender line shows how price would likely impact the position with 35 DTE. The green curve shows the likely profit at 14 DTE, and the sharp purple lines are the expiration values. We know exactly what expiration values will be at any price, but the curves are estimates based on likely impact to implied volatility as time passes and prices change.
The first thing I want to point out in this example is that the 3100 short put is 900 points below the current price of $4000. For that strike to get in the money, it would take a 22.5% decline in the market in 55 days. That won’t happen very often. To be fair, this example uses values with VIX at 25, a historically higher than average value, but for the timeframe of 2020-2022, a fairly middle of the road level. The higher that implied volatility is, the farther away the short strikes can be and still collect meaningful premium.
The next thing to point out in the setup numbers is the Greeks. Delta is fairly flat at +4.5. For a credit trade, that isn’t much and means that the position can handle some movement in price. Theta is $94/day, and we collected $1145. So, the position is expected to lose 1/12 of its value each day. But we have 55 days, so how does that work? Quite well, I’d say.
Remember that our starting underlying price is $4000 and the trade is profitable at expiration as long as price is above 3100. The chart above doesn’t show losses all the way down to zero price, but just imagine zero price and -$618,855. Our probability of profit is 96% if held to expiration based on the Delta of 4 for the naked puts.
1-1-2 Trade Expected Move Analysis
I’ve put in dotted lines to show the expected move and multiple expected moves down. If you need a refresher, check my earlier post on expected moves. It is likely that price will end up inside of one expected move, the dotted lines on either side of the current price of $4000. There is approximately a 2% chance that price will move two expected moves to the second dotted line below the current price, which would still be max profit for this trade at expiration. And there is approximately a 0.3% chance of moving three expected moves to the far left dotted line. We can go further, but the odds keep dropping as we go to lower levels. However, as history has shown, moves down tend to have somewhat higher probability than theoretical probabilities once we get beyond two expected moves. The point is that this trade is very likely to end up profitable, but there is risk that an extremely big move down could lead to an extremely big loss. We’ll talk about ways to reduce exposure later.
Let’s look at this another way. Prices don’t generally move immediately to a new level, but have probabilities of moves that get bigger over time. Again, going back to expected moves, let’s compare how we might expect price to move during the duration of the trade.
This chart shows expected moves day by day from initiating the trade until expiration, and compares to the put strike prices.
In this chart I’ve shown several outcomes. The zero move is if price doesn’t change at all, a baseline. I’ve shown a +1% move which is in line with the positive drift of the market. There’s also a line for the positive expected move and the negative expected move, where price is likely to be within at any point in time. And finally I’ve shown a curve for a price move of two times the expected move down. Notice where the strikes are relative to the price curves are. The negative curves take time to get below the upper 1-1 put debit spread strikes, and never reach even the short put of the 2 further out short puts. This chart also shows where two even further out long puts would be placed for a 1-1-2-2 version, but that’s covered in the post for that trade. For most people trading this strategy, defining risk with deep out of the money puts doesn’t provide a lot of protection as it is extremely unlikely that those puts would ever be in a position to reduce the level of a loss as this chart clearly shows. So, let’s not dwell on them.
Now let’s look at what happens to the value of our premium if price were to follow each of these curves. This is a view that you don’t see much because it is based on lots of assumptions for the pricing models. Since implied volatility is not predictable in the future, we have to guess how it will change if underlying prices change and how that will in turn impact prices. Based on how price changes have historically impacted implied volatility, we can have a decent estimate of how it will likely change with future price changes. I’ve used a model to take all that into consideration for these position value charts.
Most scenarios eventually show a profit with 1-1-2. Note that this chart shows position values, not profit. All values start with a value of -11.45 (the opening credit); the green shaded areas represent profit.
Looking at 1-1-2 values over time at the same price moves that we looked at for the expected move multiples, we can see that the premium changes are fairly dramatic and more positive as expiration approaches if the market is down.
Initially, this position collected $11.45 in premium, so we start with a negative or short value of -11.45. From there the price moves shown in the previous chart drive the premium up or down along with time decay. If price is flat or going up, premium decays and moves quickly toward zero premium. If the price goes down, the positive Delta pushes premium to more negative values. The price move of negative two expected moves really does a number on our premium initially, driving it down to below -40.
But, remember our profit chart at expiration? The flat and positive moves end up with a profit of our initial premium (all the puts have zero value at expiration, and the negative expected move and negative double expected move end up at maximum profit. Since our debit spread is 50 points wide, the negative moves would leave it fully in the money for a premium value of +50 points. And that’s in addition to the initial premium collected to open the trade. The challenge is that to get that max profit, we likely will have points in time where our position loses money.
The probability of getting to max profit is low because it would require a price drop between 6 and 22%. Based on our put strike Deltas we can estimate that we have about a 20% chance of that. Most of the other 80% is expiring with all strikes out of the money. So, it might be wise to zoom in and understand what happens with the vast majority of trades.
Zooming in on most likely outcome’s value over time
If we zoom in on the likely outcomes with the market being flat to up, we see that premium behaves very uniquely during the life of the trade.
If price goes up or drops less than 200 points, we can keep our initial premium at expiration. We may be able to collect more. The profit curve at 14 DTE is actually above the expiration profit if the price remains the same. How is this possible? Because the 1-1 debit put spread decays slower than the 2 naked low Delta puts, eventually the 1-1 part is worth more than the -2 part, even though the -2 part started out with twice the value of the 1-1.
I used this chart as the featured image of this post because I thought it best illustrates how this trade plays out most of the time. If you remember when we discussed the Greeks, I pointed out that Theta is very high compared to the premium. From this chart we see that if price stays the same or is slightly up, premium will decay to zero by 32 DTE, or just 23 days into the trade. This is an example that Theta isn’t 100% accurate by itself as it looked like 12 days of Theta should move us to zero value. From the chart you can see that the curve is fairly consistent for no underlying price movement as the value of the 1-1-2 position approaches zero, but still we have very rapid decay that I don’t think anyone can complain about.
Like all ratio style trades we have discussed, this trade has the possibility of switching from negative to positive premium. The difference with this trade is that it is actually quite likely, and as such we need to plan for it and manage our profit accordingly.
I’ve colored in the area under our three flat-to-positive curves with three zones each. There is a green zone where positive premium is growing, a yellow zone where premium is topping out, and a red zone where positive premium is being lost. Notice that the curve of the 1% up move and no price move are fairly close together, and that’s because the price movement is relatively close to the same compared to the other moves we are analyzing.
Let’s review how this happens. This trade essentially has two components, a slow decaying debit spread (1-1), and a fast decaying pair of deep out of the money naked puts (-2). The two naked puts decay faster because they are way farther out from the money, and have twice the value to start with than the debit spread. All these factors help decay happen more quickly. As long as the price stays fairly stable, this relationship will hold. Theta will be the primary driver of the premium value, and the low Delta naked puts will get to be worth less than the narrow debit spread.
The most likely scenario is that we stay inside the expected move and travel somewhere close to the no price move or 1% up move. Let’s realize that the market doesn’t move in equal amounts every day like this chart, so think of it as a smoothed out version of what premium would do. In the real world, premium would bounce up and down with price. However, if our price is close to where we started with 20 days until expiration, we would expect that the premium switch to positive has about maxed out, and it is probably a good time to close out the trade. Hopefully,your trading platform has a analysis feature that lets you look at your position and see how profits are changing day by day to help determine when the position is as high as it can go.
Without a chart, another way to determine how close the trade is to switching direction is to watch the position Theta. At the beginning of this trade, Theta was 0.942, or $94.16 for the full contract per day. As the trade progresses, Theta will decrease and at some point when the premium goes positive, Theta will turn from positive to negative. As it gets close to zero, that is the peak premium value. I generally try to exit the trade a few days before Theta is projected to turn negative. A big up day for the market could quickly change my very positive premium to not as positive premium, so it isn’t a time to get greedy.
So that brings us to the curve for the positive expected move. This is the curve that assumes that the price follows the one standard deviation move up. The good news when this happens is that premium decays very quickly because Delta and Theta team up. The not so good news is because the price move gets so far away from the strikes, the total position won’t get to a very high positive value. This is because all the options will drop in value quickly, approaching zero, and the upper debit spread won’t have much value. A big move up means that the probability of any of the strikes going into the money will be very low, so there is very little premium. As a result, it is likely we won’t be able to get out for much positive premium if any at all, but we will be able to keep most, if not all the premium from the opening trade. This is the least stressful outcome of the trade. If the price moves up faster than the expected move, premium will likely drop to very close to zero and may not ever go positive. So, if price is up a lot and the trade can be closed for a credit, I take the money and run. I’m happy to have a quick, winning trade.
As the trade progresses another helpful element is that Delta tends to reduce to zero or even become negative as time goes on if the underlying price stays close to flat. If a trader adds on many of these trades with different expirations, the overall position tends to be fairly low Delta and trades that have been in place for a while can buffer more recent positions. This is true until a really big move down hits and tests the naked puts. Then Delta grows quickly making losses pile up quickly as down moves continue.
The risky negative outcomes of the 1-1-2 trade
Looking at the position vs time value chart, there are two lines that represent what happens if price goes down. One is the move down one expected move and the other is down two expected moves. Interestingly, in this example, both end up at max profit by the end of the trade. So, it would appear that the trade can’t lose, which is far from true. Notice that these premium values may go very negative if prices drop quickly after opening the trade. This is because the narrow debit spread doesn’t pick up as much value from increasing delta as the wide credit spread does in a down move. We know that if price stays above our credit spread short strike at expiration, we will make money, but when price moves quickly down, it isn’t clear that price will level off.
So, as a trader, we are left with a choice when the market drops, We can take a loss and get out of the trade, or wait to see if the market quits dropping before it tests or violates the credit spread strikes. If we are a week or two into the trade, a decent down move will not make a huge impact, but initially the trade can take a big hit from a down move. The longer we are into the trade without a big down move in price, the less the risk is of a loss. On the flip side, a big move down opens the possibility of additional big down moves that can lead to a very big loss. We reviewed the odds earlier- about 4% of the time the trade will lose based on the far short puts having an initial Delta of 4. If this trade is done enough times, there will be some losses. Let’s look at some management actions that could be taken.
1. Set a stop based on premium price. In this example, we collected just over $11 premium to open the trade. So, we could set a stop to avoid losing twice ($22) or maybe even three times ($33) our initial premium. This would mean a stop loss if premium climbs to $33 or $44, given that $11 premium is our starting break-even point. This is the simplest risk mitigation strategy. Using this will lower the overall win rate as many negative scenarios would end up fine if not closed, but this management technique will prevent huge losses that might impact the account dramatically.
2. Close the trade if the underlying price goes below a trigger point. We know this trade has a lot of cushion. We can handle much more than one expected move and be profitable. But if the move is much more than expected, we have to consider that the move is very unusual and dangerous for us. Perhaps our point to get out is when the debit spread is in the money, or when we are half-way between the debit spread and two naked puts. Or maybe it is the strike of the short naked puts that is the final trigger to get out. The further down we allow price to go down, the more we stand to lose. Pick the underlying price where it gets too uncomfortable and use that as the trigger point to get out of the trade.
3. Roll out in time if premium or price triggers are hit. If the position is rolled, it can be rolled out for a credit. This gives more time for the market to turn around. However, it gives more time for a losing trader to lose more, because we likely can’t roll down much lower and still get a credit, and we will likely have to pay to roll the debit spread. If the price move continues down, there will be much less room to maneuver going forward.
4. Simply hold on and hope the probabilities play out. With 55 days in the trade, we just need to move down less that two expected moves by expiration. If the capital is available, and the conviction is there, holding can bring max profit with a big down move. Note that as time passes and the naked puts stay out of the money, the premium has to go away, so the value can evaporate very quickly with very high Theta as expiration approaches. This can be observed in the value vs time graph for the -2 EM curve. It can also result in a very large loss. As expiration approaches, the difference between max profit and a much bigger loss is just a few percentage points of price movement and the potential loss is much more than max profit.
In this example we can see that a move down of one expected move really doesn’t challenge our position, while two times the expected move is playing with fire. So, one approach might be to hold as long as the move stays within the expected move to the downside and switch to closing or rolling once the move exceeds that or some other multiple of expected moves. In any case, a trader has to know their risk tolerance and have a management plan for both winning and losing trades.
What about calls?
A logical question might be- if this works so great for puts, why not double up and do it for calls as well? Well, there’s one problem- skew. On indexes implied volatility is higher as strikes go to lower values and declines for higher strike prices. As a result, out of the money puts have higher implied volatility than out of the money calls. More importantly, far out of the money puts have higher implied volatility than puts closer to the money.
Look at our setup for this example. Implied volatility of the single long put is around 25, while the two short puts have implied volatility of 39. This helps two ways. The short puts have more of their premium tied to volatility, bumping up their price compared to the long put. Also, the higher implied volatility pushes the strike price further down to get a matching premium to the debit spread, making the trade a higher probability of success. We are selling more of the higher implied volatility and buying lower implied volatility, a key reason to use front ratio spreads.
A similar setup for a 1-1-2 call trade would reverse the dynamics. The long call closest to the money would have the highest implied volatility and the two short calls would have the lowest. To collect similar amounts to the put trade, the call strikes would be much closer between the debit spread and credit spread, and the difference in the deltas of the strikes would also be closer together, meaning a narrower window of max profit, and a higher probability of max loss. While still a trade with positive probability, it generally isn’t as attractive as the put side.
Buying power requirements for 1-1-2
I usually don’t spend much time talking about buying power because most trades I do are defined risk credit trades where the amount collected is a significant portion of the capital at risk. This trade is not so much, as it is a naked ratio spread (1-1-2). In non-margin accounts, we collect 0.2%, which isn’t much.
Below is an analysis of different possible ways to trade. I looked at trading each of these strategies three different ways. First, I looked at a cash secured account, like a retirement account. Next, I looked at an account with margin for naked options. Finally, I looked at a much different approach, trading futures options with span margin. The margin and span margin amounts came from entering this trade into the tastytrade trading platform. I’m also showing the defined risk 1-1-2-2 version for comparison as well.
Comparing buying power impact of different account types for the two strategies
I highlighted some key takeaway points. First, is how leveraged span margin with futures options can be for this trade. Our most capital efficient trade would be doing the 1-1-2-2 on futures span margin where we would collect 100 times the premium as a percentage of buying power (20%) than the non-margin account of the 1-1-2 trade (0.2%). Of course, with leverage comes much more risk. I chose to consider a loss of 10 times the initial credit as a practical worst-case scenario. The span margin would end up costing huge amounts more in a disaster and could potentially wipe out an account if the trade used a high percentage of the account’s capital. Span margin isn’t static, when a trade moves against a position, the span margin is re-calculated and the requirements can quickly explode in a big market move.
A couple of weird margin anomalies to point out. In my margin account, the defined risk 1-1-2-2 trade required almost twice the buying power as the undefined 1-1-2, which is weird because clearly there is more risk in the naked 1-1-2. I think it may be that the calculation for defined risk is normally much less than undefined and the software may just assume that margin is not useful in defined risk. On the other hand, defining the risk on the futures version cut the buying power by 1/3. Different brokers may calculate their margin requirements differently, so don’t take this as universal truth. Similarly, remember that while defining risk usually increases the return on capital, it makes outsize losses more likely, especially when scaling up. Notice that the highly leveraged futures 1-1-2-2 would lose twice as much as a percentage of capital that the futures 1-1-2 setup in a 10x loss. I discussed this phenomenon in detail in my post on comparing risk.
Remember that margin and span margin change as the trade progresses depending on the market behavior. Span margin is subject to big swings when prices go against a position. A broker may force a position to close much earlier than a trader would want to get out due to expanding capital requirements. So, while initially the position is cheap to enter, a trader needs to limit each position to a fraction of the overall account size.
But the good side of this is that this trade can be entered for a very small cost. The trade is very high probability. We can also make more than the premium collected. I didn’t include it in the chart, but maximum profit for the most leveraged choice above would be $5,805 profit on $4,000 buying power, a return on capital of 145%. And there is over a 20% probability of that happening.
One final note on the buying power analysis table. To keep the quantities an apples-to-apples comparison, I used double the number of /ES futures options because futures options only control half as much value as SPX index options. So, technically, those futures options trades listed are 2-2-4-4 and 2-2-4 because they use twice the number of contracts to get the same notional exposure. I reviewed differences between index options and futures options in detail in my post about different ways to trade options on the S&P 500 index.
What about small accounts?
Readers looking at this may be thinking, “Gee, this is great for multi-millionaires, but what if the account is too small to consider any of these buying powers?” Great question- there are other alternatives. First off, a trader could use half the buying power listed by just trading options on one contract of the Mini S&P 500 futures (/ES). The 1-1-2 example would only take $6,000 buying power for $572 premium received. But, if that is still too much, we can make it a lot less.
Many traders are more familiar with options on the SPY exchange traded fund, which trades at approximately 1/10 the value of the S&P 500 index. For futures options, there is also options on the Micro S&P 500 futures contract (/MES), equal to 1/10 of the /ES contract size, or 1/20 of the size of an SPX option. By using SPY or /MES, we cut the size of the trade down by 1/10 compared to the above table. If the account is taxable, another choice would be the $XSP index, a 1/10 value index of the S&P 500 with favorable tax treatment, but much lower liquidity with few options that far out in time. Again, all these alternative versions of S&P 500 options are discussed in my post on different S&P 500 choices.
So, for an account with futures trading capability, this trade could use /MES futures options and get into the 1-1-2 trade for just $600 buying power. An account with options margin could use SPY or $XSP and get into the 1-1-2 trade for $6,800 buying power. A trader doesn’t need a million dollar amount to trade this.
Concluding thoughts on 1-1-2 trades
I know a number of people who have traded versions of this trade during the bear market of 2022 without any issues. One trader I follow and interact with had one of their best years in 2022 because of this trade and the bear market that moved the market down, but not fast enough to ever drive the naked puts into the money. In fact, it could be argued that this trade, like most trades that collect credits from selling puts, works best if entering when the market is already down and implied volatility is high. Bad scenarios are already priced into option premium and there is a lot of cushion between strikes. This trade is most dangerous when volatility is low and prices are high- the probabilities are not as good, because a move of more than two times the expected move down is not nearly as far.
While not for everyone, the 1-1-2 trade provide a very high probability of success with a nice payout when used with leverage. The trade requires monitoring to maximize profit and to prevent catastrophic loss, so it really is not a set it and forget it trade. The key is to have a plan to manage the position if the market goes against the trade and stick to the plan.
Beginning option traders like to buy calls to start their option trading, and over time often learn the advantage of selling options and probability. But there’s a reason that long trades involving calls exist- the market goes up more than it goes down. We need strategies that use call trades to benefit from market moves up without experiencing huge amounts of time decay, or huge swings in positions. These 5 strategies provide some choices to get in on a bull market with calls.
(Without losing a lot of Theta decay)
Option buyers typically have low probability of profit because of the need to overcome Theta decay, the measure of how much option premium loses value every day. But often selling calls in a bull market is a loser as markets don’t offer much premium and go up more than expected. And the market is bullish 70-80% of the time. Are there call trades that take advantage and balance risk and opportunity better than others?
Each of these trades is built for a different type of trade mentality, so it is a personal choice based on risk, time frame, and how active a trader wants to be in the market. However, with the exception of the covered call, all leverage capital and risk a total loss of premium paid but with big potential gains.
When is a good time to do these kinds of trade? Selling options is best when IV is high. Buying options is best when Implied Volatility (IV) is low and option premium is cheap. When IV is high, big moves are anticipated, but even if the market goes up, IV can contract quickly and significantly counter the gains from an up move. One overall measure to watch is the VIX volatility index. VIX has a long-term average level of 18, and when it gets in the low teens, between 12-14, it doesn’t have much lower it can go. Individual stocks can be checked for their IV level by looking at IV rank or IV percentile. When VIX is low and a stock has an IV percentile or rank below 10, I’d consider the stock IV as low. This scenario happens frequently, especially in bull markets, which occur much more of the time than bear markets. On the flip side as the market goes up and IV goes down, selling options get less lucrative and more risky.
Let’s take the five strategies one at a time. There are also detailed write-ups of each on separate pages, so this is an introduction to these trades and to contrast the risks and benefits of each before digging in deep.
Covered Call Trades
Of the five trades listed above, the Covered Call is the most conservative and the only trade that is based on a net sale of options. The trade is a combination of owning 100 shares of stock and selling a call against the shares. Because the amount of capital at risk is essentially the value of the shares of stock, which are owned in the account, this trade has no leverage from options- instead it reduces leverage and risk by adding a hedge against the shares owned.
Let’s say a trader sells a call with a Delta of 30 against their shares. The net Delta of the Covered Call position becomes 70. This means the two part position acts like 70 shares instead of 100, making the position less volatile. Since the only option involved is one that was sold, time decay always works for the call seller.
Many traders love Covered Calls because it allows them to collect premium as a source of income on shares they already own, without taking on any additional risk. For many conservative option traders, this is the one and only option trade ever needed. Depending on the underlying and tactics used, it is possible to make 5-15% income on stocks in a portfolio. Because the trade involves selling options, the probability of profit is greater than 50%, the highest probability of the five trades listed.
Covered calls improve the probability of profit over owning stock alone in exchange for giving up unlimited upside.
So, what’s not to like? It depends on your perspective, but the Covered Call limits upside gains, but does only a little to reduce downside risk. If a Covered Call owner has stock that goes up a huge amount, the call will limit how much profit can be made. The trade will be a profit, but without the call, the profit could be more. By selling a call, the Covered Call trader is collecting premium in exchange for the possibility of missing out on a big up move. On the downside, collecting premium might be a small consolation if the stock drops dramatically.
For a conservative trader, the Covered Call is a way to reduce risk compared to simply owning stock outright. For an aggressive trader, the Covered Call uses a lot of capital to get a return potentially the same as the market, with no real downside protection. I’ve come full circle as a trader myself, going from a big fan, to dis-illusioned by the lack of upside, to recognizing the benefit of a less-volatile, positive probability trade.
Stock Replacement Call Trades
The next strategy is one that is often referred to as stock replacement. With this strategy, we can buy options that have the same upside as shares of stock but at a fraction of the cost. In theory any time someone buys a call, there is the same upside as stock, but some set-ups give a trader more of the upside benefit than others.
When I think of using options in place of stock, I’m looking for two things, relatively high probability and low Theta decay. When buying a option with no hedge, the natural way to lower time decay is to buy a call well out in time where it will decay slowly. To get it to move with the underlying stock, having an in-the-money option can get most of the move up (or down).
So for this strategy, I look for options 6-12 months out with a Delta value of 75-80. These options will likely cost 10-20% of the cost of the shares as they have significant intrinsic and extrinsic value. With over 6 months until expiration, time decay is slow, but still present.
In this example, a call is purchased with 84 days until expiration with a Delta of 0.78. Notice that even after several weeks, the profit curve is very close to that of owning stock around the money. Purchasing even longer duration options than this would provide less daily decay with even better downside protection.
Because I’m buying an option with a Delta of 75-80, I have the equivalent of 75-80 shares of stock from a price movement stand-point. If the price goes up, over time the Delta will increase and the option will behave closer and closer to the movement of 100 shares of stock.
The risk to the downside is limited to the amount paid for the options, so a big market drop could wipe out the position, but even a big drop would still likely hold some value, but mostly the extrinsic time value. However, the really good news is that losses in the options on a downturn are less than the losses that would come from 100 shares of stock.
My goal in this trade is not to hold until expiration, but to either exit or roll to a longer duration before we get into the last quarter before expiration. If the stock price has gone up, I can roll to a new time at a higher strike price and collect the amount the stock has appreciated less the time decay that was lost.
This trade needs a small move up to break even, so the theoretical probability of profit is a little less than 50%. But, by getting out way before expiration, the odds get ever closer to 50/50, and in a bull market the unlimited upside with limited downside is a pretty compelling proposition.
One watchout with this trade (and the others as well) is thinking that since we use just one fifth or one tenth of the capital of buying stock that we can now buy five or ten times as many options and really cash in. We have to respect the downside risk. A big move down will wipe out this position. So we don’t want to put all our eggs in this basket.
But when the market is frothy and looking like it is going nowhere but up, this is a good way to participate in the upside while protecting the downside, assuming that there’s plenty of capital left to deploy if the market suddenly goes against the position.
Poor Man’s Covered Call Trades
Covered calls have a number of trading advantages- they reduce volatility, provide some income, somewhat cushion a position from a fall. But, to have a covered call, you have to own stock first to sell a call against it. However, we just discussed the idea of using long calls as a substitute for stock, so if we sell a call against our stock equivalent we can have a low cost equivalent of a covered call, in other words a Poor Man’s Covered Call.
One difference is that our long calls have decay, and we want to counter that decay by selling calls with the same or more decay in our favor. A great way is to create a diagonal spread, selling calls that are closer to expiration while buying calls that are further away.
By selling a call with faster decay against our long call with slower decay, we can actually get a trade that has a greater than 50% probability of profit. The trade-off is that we limit the upside. The trade has defined risk and defined maximum profit.
My typical setup is to buy a 75 Delta call about 12 weeks out and sell a 25 Delta call about 6 weeks out, or half the time. If we look at a chart of each of the options profit potential along with how they compare to just owning stock, we get a bit of a complex chart:
In this chart we have two options with their own profit profiles at expiration. But, since they don’t expire at the same time, it is more important to see how they will perform at a certain point in time, like half-way to expiration for the shorter duration short call. After 21 days, the short call profit profile hugs the expiration profit profile much closer than the longer duration long call.
The key thing when looking at diagonal spread positions is that we really can’t think that much about expiration, especially for the long duration portion of the trade because it expires later. So, we really have to pay attention to how the projected values will behave at different points in time prior to expiration.
Another thing to notice is that the short call we sold has a strike price much closer to the current price than the long duration call. This means that there is more potential downside than upside, but that’s true with a regular covered call as well, actually even more so. At least our downside on this trade is limited.
When we put it all together in a chart, we can see how the trade profits not only when the market is up, but when the market is flat as well. Profitability with no underlying price change is due to the faster decay of the shorter duration short calls.
Notice the 21 days in trade profit line is profitable even in a slight down move.
Looking at the overall Delta of this trade, it opens with a net Delta of 50, or the equivalent movement of 50 shares of stock. So this position is half as volatile as owning 100 shares of stock for a cost equivalent to about 7.5% of owning 100 shares.
From a profit standpoint, our capital required was $750 and the maximum profit is $250. This shows how much upside we’ve given up by selling the call, compared to unlimited upside with the call alone. However, if we look at a “sweet spot” on the profit chart above, we can see that if price goes up from 100 to 102 in 21 days, the profit is around $150, a 20% return on capital for a 2% move. In comparison, a 2% price move on the earlier long call option only would yield about a 7% return on capital, and owning stock outright would net the owner, well, obviously 2%. one way or the other, I can roll out at the same time I’m repositioning the short leg.
Is there any magic to 84 and 42 days? Not really, it’s just a time frame that I find fairly manageable without a lot of stress, but with plenty of premium to collect on the short side of the trade. Longer durations have less stress, and shorter durations are more volatile with more potential profit. It’s a choice that depends on your trading preferences and risk tolerance.
There’s a lot of ways to manage the Poor Man’s Covered Call, and I’ve written about them in an extended post.
Buying an Out of the Money Call Spread
Buying an out of the money call spread seems counter to every theoretical calculation a person can do. The probability of expiring in the money is low by definition and time decay is the enemy big time. But, over the years I noticed that when I sold call spreads that were supposed to be profitable, either alone or as part of an Iron Condor, those spreads seemed to lose money often, and often lost a lot. One thing I’ve learned in trading is that if a strategy you use continually loses, try doing the opposite. So, here we are. I’ve done a lot of back-testing and trading my own positions to come up with a low probability strategy that actually wins over time.
As I tested different variations of this strategy, it became clear that the key was to keep the amount of capital required low with lots of upside potential, but high enough that the position has a chance for success. Also, this is a trade that works best when the trade is closed for a win and not held to expiration. It also does best with low implied volatility in a bull market.
There’s a lot more upside than downside for an out of the money call spread.
Buying a spread helps compared to buying a single out of the money call, because the sold call has similar Theta decay to the long call and counters the biggest reason for quick losses from buying calls.
With a little time and early management, this trade has a history of an actual positive average profit, even though the probability of profit from a single trade is well below 50%. Big wins can outpace a larger number of small losses. Read the detailed post about this strategy to find out the specifics to success with this trade that goes against virtually every concept I tend to advocate for.
The Call Back Ratio
In front ratio spreads, usually the goal is to sell more options than what is bought to have lots of decay protected a hedge of a long option. Front ratios are so much more common, that most people just call them ratio spreads and don’t even consider an opposite version, a back ratio.
A back ration spread involves buying more options than selling to take advantage of a big market move. With a call back ration, we may for example buy two calls and sell one call. If the market goes up, the two long calls will make more money than the short call will lose. The disadvantage is that Theta (time decay) can be a big problem. So, I have two variations of this trade that I use that somewhat counter this problem, but not completely.
A Delta neutral back ratio call spread is created by selling a call and buying two calls with exactly half the Delta of the call that was sold. The net Delta is zero, and the trade should net a credit- a trader is paid to enter the position. If both call strikes are out of the money, like when selling a 30 Delta call and buying two 15 Delta calls, it is very possible that the position will expire with everything out of the money and worthless, so the trader keeps the premium. If the market goes way up, the long calls will start to overcome the value of the short call with unlimited profit potential. Sounds great, doesn’t it? The downside is that the trade could end up with the short call in the money and the long calls out of the money worthless, so the trader is stuck with a loss quite a bit bigger than the credit received to start with.
A Delta-neutral call backspread makes money at expiration in a flat to down market or a big move up, but loses in a small move up.
An almost opposite variation flips the position of the long calls to make the trade a net debit and create the equivalent of 100 shares with zero extrinsic (time value). I picked up this concept on TastyLive.com. The Zero Extrinsic Back RAtio trade, or ZEBRA, buys two 75 Delta calls and sells one 50 Delta call for a net Delta of 100, or the equivalent of 100 shares of stock. The extrinsic value of these positions tend to cancel each other out, with twice as much time value in the short call as each of the long calls. So we get the movement of 100 shares of stock for a fraction of the cost and no extrinsic value for the position. In many ways this is a lot like the stock replacement discussed earlier.
The zero extrinsic value is a little deceptive in that the extrinsic value doesn’t decay equally. The extrinsic value of the two long calls decay faster than the extrinsic value of the short calls at the money. So, in the short term, Theta is negative, and we still need the market to move up to make money.
Beginning option traders like to buy calls to start their option trading, and over time often learn the advantage of selling options and probability. But there’s a reason that long trades involving calls exist- the market goes up more than it goes down. We need strategies that use call trades to benefit from market moves up without experiencing huge amounts of time decay, or huge swings in positions. These 5 strategies provide some choices to get in on a bull market with calls. Share your favorite bullish call trades in the comments.