I’m a big fan of front ratio type trades. I’ve written about my success with Broken Wing Butterflies and Broken Wing Put Condors. Another trade that fits in the group is the 1-1-2-2 Put Ratio. I don’t know of a named reference to a bird or insect for this trade, so I’m going with 1-1-2-2. Like all the front ratio type trades I have shared, this trade is a defined risk version of a very similar front ratio trade featuring naked short puts. My versions hedge the trade with long puts to limit the risk. However, in this trade, I will also discuss the unlimited risk version of the trade, the 1-1-2, because the additional risk isn’t that much from a practical standpoint.
I picked up the concept of this trade from one of my favorite traders, “Sweet Bobby” Gaines, who I have mentioned previously in at least one other page on this site. Bobby is a big proponent of the 1-1-2 trade, and has posted numerous videos on it on his YouTube channel, including his recent rising star appearance on Tasty Trade. But really, the trade is the next level of evolution moving from broken wing butterfly to broken wing condor to “one louder” as they say in the mythical group Spinal Tap.
What all these trades have in common is selling an out of the money debit put spread, and financing by selling further out of the money puts or wider credit put spreads. The combination delivers a net credit, but also sets up an interesting dynamic of extra rapid decay of the premium involved. The farther out puts or put spreads decay faster than the closer debit spread, and often lead to the debit spread having more value than the credit spread. These trades take in a credit to open, and often can take in a credit to close. At least that’s how I set them up and manage them.
All these trades are a variation of a front ratio spread, where more options are sold than bought with hedges added to define risk. I’ve also written about back ratio spreads where more options are bought than sold. Front ratios are designed for maximizing decay, while back ratios set up multiple long positions paid for by a costly short position.
The previously discussed broken wing condor could also be called a 1-1-1-1 trade. In that trade we buy a put spread and then sell another put spread further out for more money, collecting a net credit. Four different strikes, 1 contract each. So what is a 1-1-2-2?
1-1-2-2 Basic trade setup
The 1-1-2-2 takes this a step farther, because we use two credit spreads very far out of the money to pay for the debit spread. The 1-1 part is buying a put around 25 delta and selling a put around 20 delta. The 2-2 part is selling two puts at around 5 delta and buying two puts around 1 delta. The goal is for the 2-2 to sell for about twice what the 1-1 cost. I like to set these up with 45-55 days remaining to expiration, quite a bit longer than the other ratio trades I’ve discussed.
What is the advantage of this? Well, because each of the two short strikes are further out, we greatly improve the odds of being profitable, and increase the initial rate of decay of the total position. We end up with a big gap between the debit spread strikes and the two short put strikes. Lots of good things happen with this setup. The biggest upside is that there is no upside risk- if price goes up, the trade makes money. The downside of this trade is that it can consume a lot of capital and has significant tail risk, which we will get into before we are done. Let’s look at a typical example.
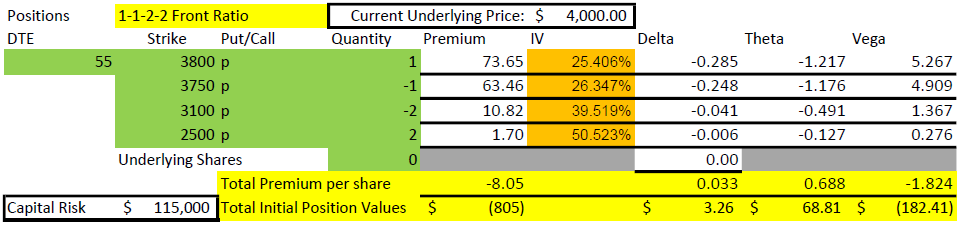
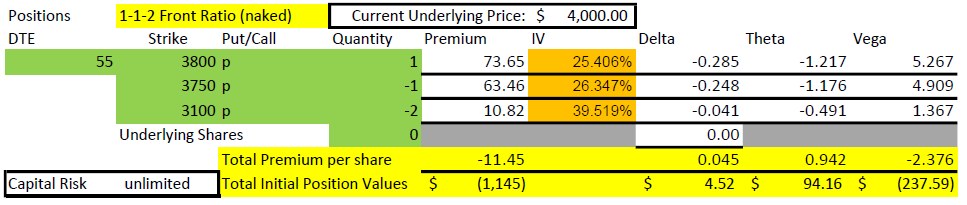
The first thing I want to point out in this example is that the 3100 short put is 900 points below the current price of $4000. For that strike to get in the money, it would take a 22.5% decline in the market in 55 days. That won’t happen very often. To be fair, this example uses values with VIX at 25, a historically higher than average value, but for the timeframe of 2020-2022, a fairly middle of the road level. The higher that implied volatility is, the farther away the short strikes can be and still collect meaningful premium.
The next thing to point out in the setup numbers is the Greeks. Delta is fairly flat at +3. For a credit trade, that isn’t much and means that the position can handle some movement in price. Theta is $69/day, and we collected $805. So, the position is expected to lose 1/12 of its value each day. But we have 55 days, so how does that work? Quite well, I’d say.
Finally, we can’t ignore the capital risk of $115,000. How can this be? If the price drops below $2500 at expiration, a 47.5% drop, the loss would be $115,000. While extremely unlikely (we didn’t lose that much in the Covid crash of 2020), it is possible in some disastrous scenarios. We’ll discuss this later as it impacts capital requirements and how one perceives risk. At the end of this post, I’ll explain how we can get into this trade for a fraction of this buying power.
Numbers are one thing. A picture or three might help make this all more clear.
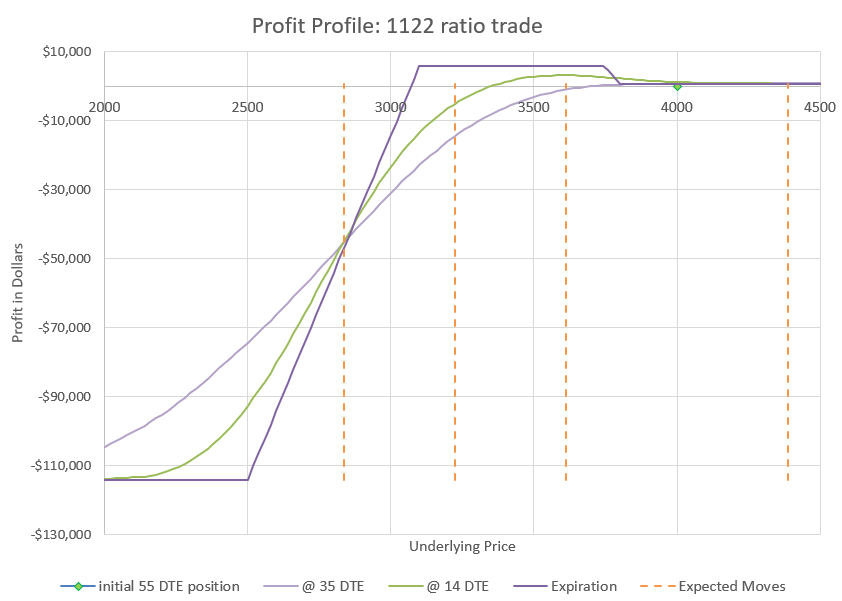
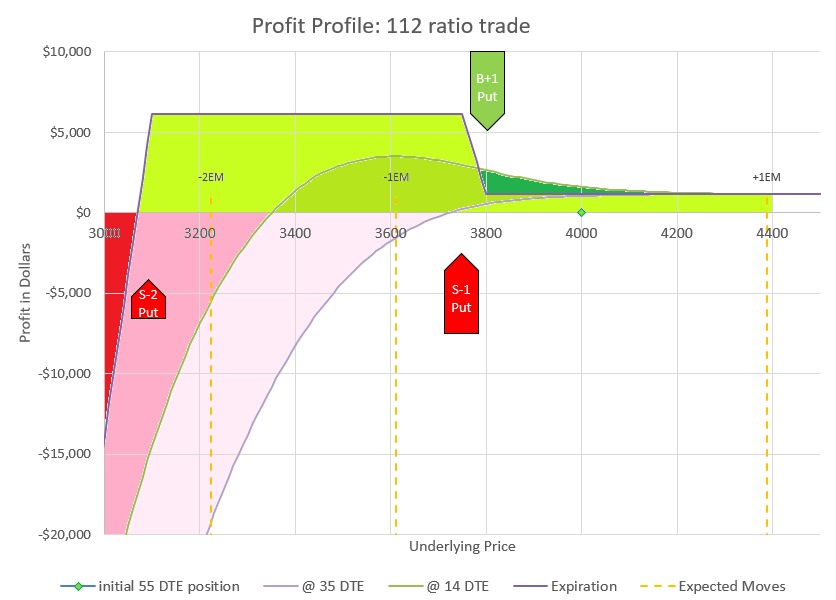
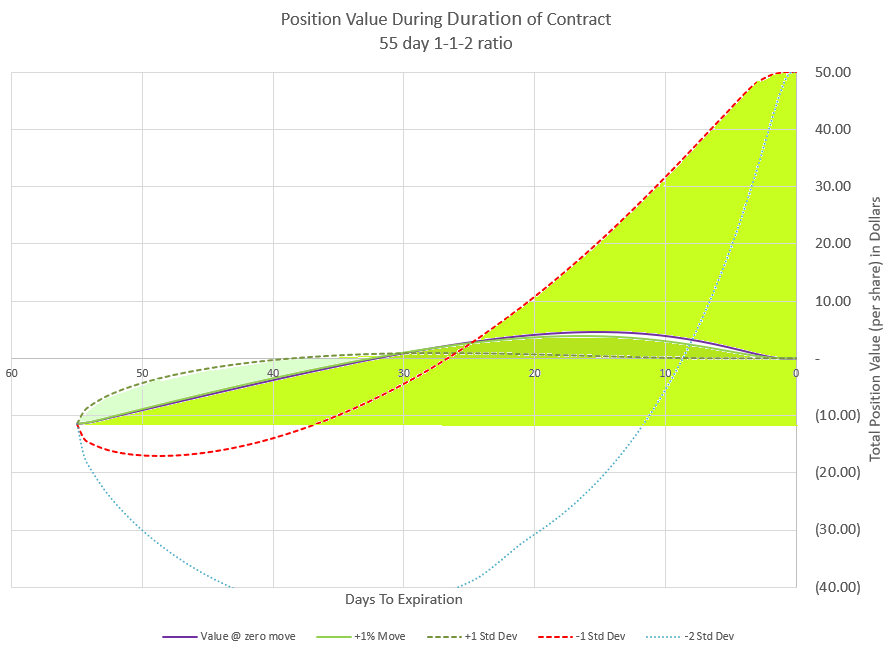
This chart shows how changes in the underlying price will impact the profit and loss of the trade. We evaluate at four points in time. The green diamond shows our initial position at 55 DTE, underlying price is $4000, and the P/L is zero. The curvy lavender line shows how price would likely impact the position with 35 DTE. The green curve shows the likely profit at 14 DTE, and the sharp purple lines are the expiration values. We know exactly what expiration values will be at any price, but the curves are estimates based on likely impact to implied volatility as time passes and prices change.
I’ve put in dotted lines to show the expected move and multiple expected moves down. If you need a refresher, check my earlier post on expected moves. It is likely that price will end up inside of one expected move, the dotted lines on either side of the current price of $4000. There is approximately a 2% chance that price will move two expected moves to the second dotted line below the current price, which would still be max profit for this trade at expiration. And there is approximately a 0.3% chance of moving three expected moves to the far left dotted line. We can go further, but the odds keep dropping as we go to lower levels. However, as history has shown, moves down tend to have somewhat higher probability than theoretic probabilities once we get beyond two expected moves. The bottom long puts are a final defense to limit losses for going even more extreme in a rapid crash. The point is that this trade is very likely to end up profitable, but there is risk that an extremely big move down could lead to an extremely big loss. We’ll talk about ways to reduce exposure later.
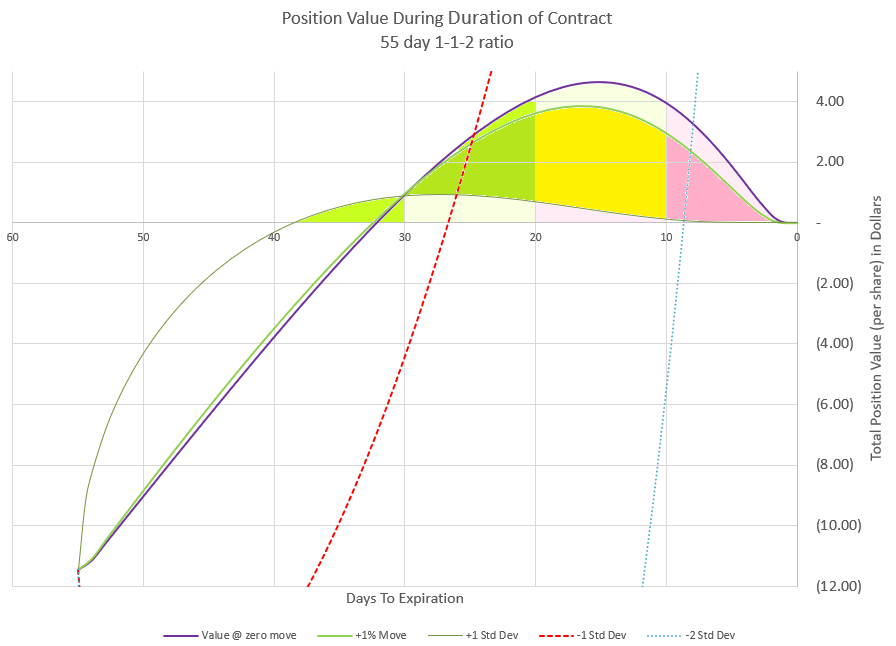
Now that we’ve talked a bit about the very unlikely outcomes, let’s zoom in and discuss the most likely scenarios. Here’s the profit chart showing prices down to 25% below the current price with profit and loss zones highlighted.
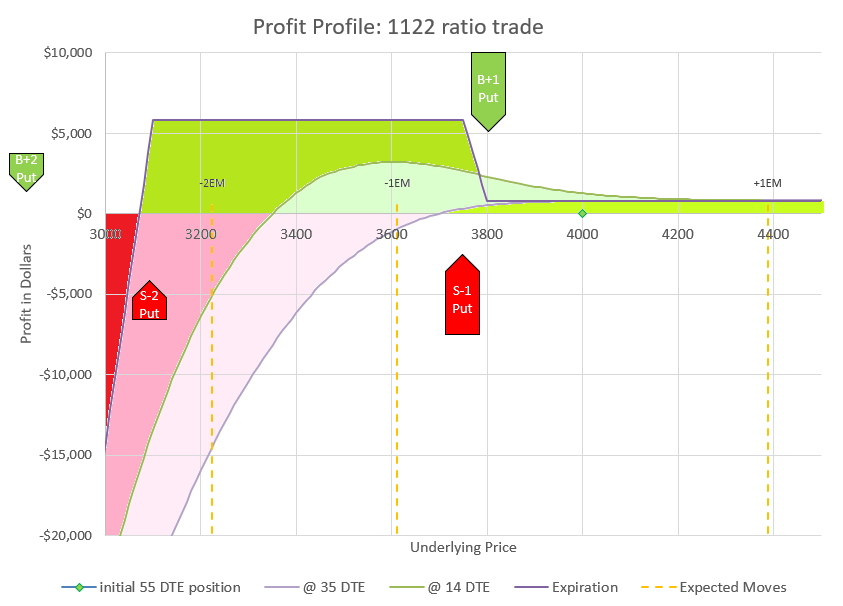
Zooming in allows us to see the profit levels in the timeframes referenced above. Notice that down moves initially can drive the position to a loss, but if the move doesn’t go below the two short puts at 3100, the position will be highly profitable at expiration. In fact, this trade does best in the very wide range of a price drop between 6 and 22 percent, bringing in up to $5000 additional credit.
If price goes up or drops less than 200 points, we can keep our initial premium at expiration. We may be able to collect more. The profit curve at 14 DTE is actually above the expiration profit if the price remains the same. How is this possible? Because the 1-1 debit put spread decays slower than the 2-2 credit spread, eventually the 1-1 part is worth more than the 2-2 part, even though the 2-2 part started out worth twice as much as the 1-1.
Let’s look at this another way. Prices don’t generally move immediately to a new level, but have probabilities of moves that get bigger over time. Again, going back to expected moves, let’s compare how we might expect price to move during the duration of the trade.
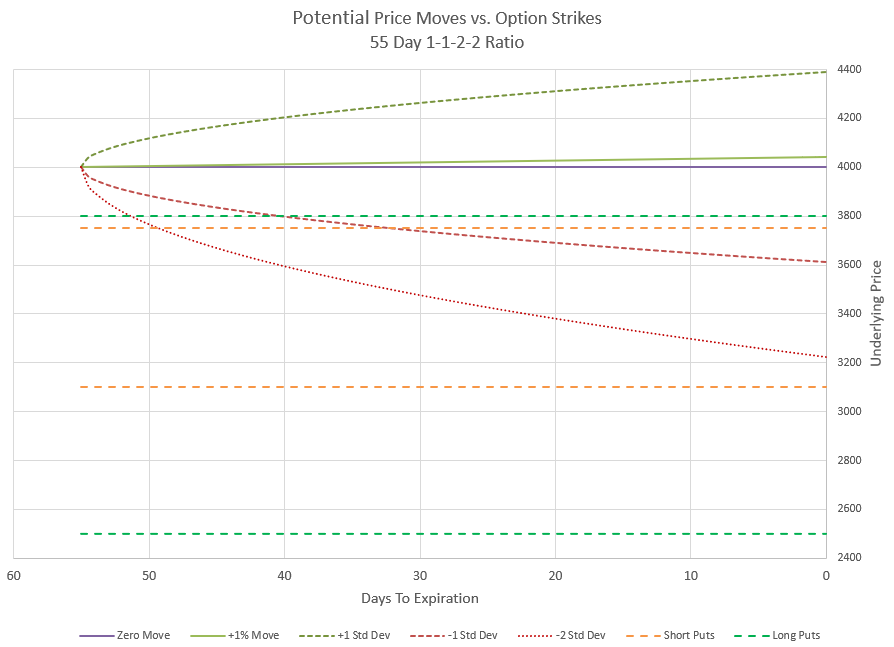
In this chart I’ve shown several outcomes. The zero move is if price doesn’t change at all, a baseline. I’ve shown a +1% move which is in line with the positive drift of the market. There’s also a line for the positive expected move and the negative expected move, where price is likely to be within at any point in time. And finally I’ve shown a curve for a price move of two times the expected move down. Notice where the strikes are relative to the price curves are. The negative curves take time to get below the upper 1-1 put strikes, and never reach even the short put of the 2-2 credit spread.
Now let’s look at what happens to the value of our premium if price were to follow each of these curves. This is a view that you don’t see much because it is based on lots of assumptions for the pricing models. Since implied volatility is not predictable in the future, the chart makes assumptions for how price and time will most likely impact volatility and premium value.
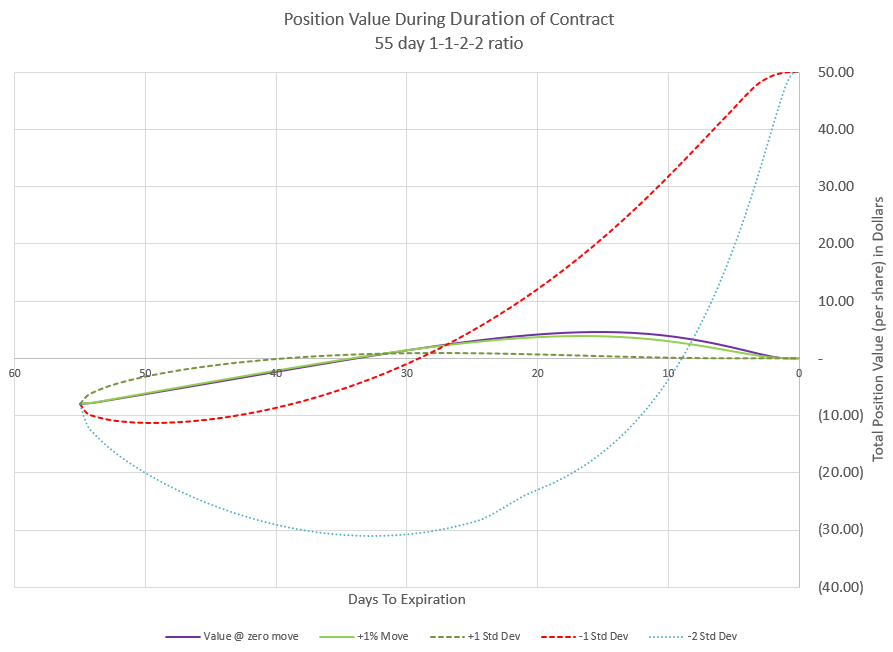
Initially, this position collected $8.05 in premium, so we start with a negative or short value of -8.05. From there the price moves shown in the previous chart drive the premium up or down along with time decay. If price is flat or going up, premium decays and moves quickly toward zero premium. If the price goes down, the positive Delta pushes premium to more negative values. The price move of negative two expected moves really does a number on our premium initially, driving it down to below -30.
But, remember our profit chart at expiration? The flat and positive moves end up with a profit of our initial premium (all the puts have zero value at expiration, and the negative expected move and negative double expected move end up at maximum profit. Since our debit spread is 50 points wide, the negative moves would leave it fully in the money for a premium value of +50 points. And that’s in addition to the initial premium collected to open the trade. The challenge is that to get that max profit, we likely will have points in time where our position loses money.
The probability of getting to max profit is low because it would require a price drop between 6 and 22%. Based on our put strike Deltas we can estimate that we have about a 20% chance of that. Most of the other 80% is expiring with all strikes out of the money. So, it might be wise to zoom in and understand what happens with the vast majority of trades.
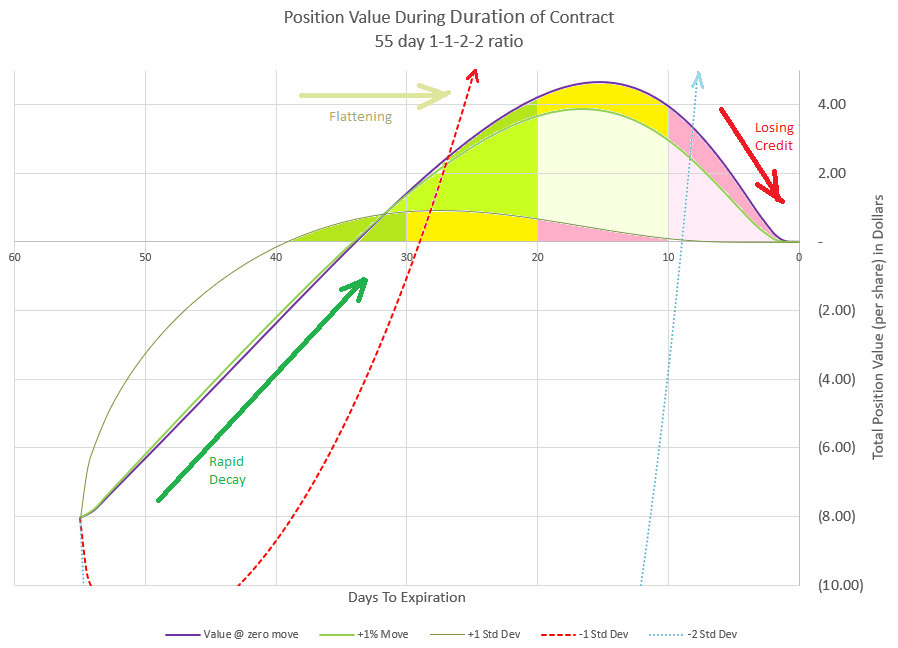
I used this chart as the featured image of this post because I thought it best illustrates how this trade plays out most of the time. If you remember when we discussed the Greeks, I pointed out that Theta is very high compared to the premium. From this chart we see that if price stays the same or is slightly up, premium will decay to zero by 35 DTE, or just 20 days into the trade. This is an example that Theta isn’t 100% accurate by itself as it looked like 12 days of Theta should move us to zero value. It could be that IV modeling is slightly off or the Theta was off, but still we have very rapid decay that I don’t think anyone can complain about.
Like all ratio style trades we have discussed, this trade has the possibility of switching from negative to positive premium. The difference with this trade is that it is actually quite likely, and as such we need to plan for it and manage our profit accordingly.
I’ve colored in the area under our three flat-to-positive curves with three zones each. There is a green zone where positive premium is growing, a yellow zone where premium is topping out, and a red zone where positive premium is being lost. Notice that the curve of the 1% up move and no price move are fairly close together, and that’s because the price movement is relatively close to the same compared to the other moves we are analyzing.
Let’s review how this happens. This trade essentially has two spreads, a slow decaying debit spread (1-1), and a fast decaying credit spread (2-2). The credit spread decays faster because it is farther out from the money, is much wider, and has twice the value to start with. All these factors help decay happen more quickly. As long as the price stays fairly stable, this relationship will hold. Theta will be the primary driver of the premium value, and the wide credit spread will get to be worth less than the narrow debit spread.
The most likely scenario is that we stay inside the expected move and travel somewhere close to the no price move or 1% up move. Let’s realize that the market doesn’t move in equal amounts every day like this chart, so think of it as a smoothed out version of what premium would do. In the real world, premium would bounce up and down with price. However, if our price is close to where we started with 20 days until expiration, we would expect that the premium switch to positive has about maxed out, and it is probably a good time to close out the trade. Hopefully,your trading platform has a analysis feature that lets you look at your position and see how profits are changing day by day to help determine when the position is as high as it can go.
Without a chart, another way to determine how close the trade is to switching direction is to watch the position Theta. At the beginning of this trade, Theta was 0.688, or $68.80 for the full contract per day. As the trade progresses, Theta will decrease and at some point when the premium goes positive, Theta will turn from positive to negative. As it gets close to zero, that is the peak premium value. I generally try to exit the trade a few days before Theta is projected to turn negative. A big up day for the market could quickly change my very positive premium to not as positive premium, so it isn’t a time to get greedy.
So that brings us to the curve for the positive expected move. This is the curve that assumes that the price follows the one standard deviation move up. The good news when this happens is that premium decays very quickly because Delta and Theta team up. The not so good news is because the price move gets so far away from the strikes, the total position won’t get to a very high positive value. This is because all the options will drop in value quickly, approaching zero, and the upper debit spread won’t have much value. A big move up means that the probability of any of the strikes going into the money will be very low, so there is very little premium. As a result, it is likely we won’t be able to get out for much positive premium if any at all, but we will be able to keep most, if not all the premium from the opening trade. This is the least stressful outcome of the trade. If the price moves up faster than the expected move, premium will likely drop to very close to zero and may not ever go positive. So, if price is up a lot and the trade can be closed for a credit, I take the money and run. I’m happy to have a quick, winning trade.
The risky outcomes
Looking at the position vs time value chart, there are two lines that represent what happens if price goes down. One is the move down one expected move and the other is down two expected moves. Interestingly, in this example, both end up at max profit by the end of the trade. So, it would appear that the trade can’t lose, which is far from true. Notice that these premium values may go very negative if prices drop quickly after opening the trade. This is because the narrow debit spread doesn’t pick up as much value from increasing delta as the wide credit spread does in a down move. We know that if price stays above our credit spread short strike at expiration, we will make money, but when price moves quickly down, it isn’t clear that price will level off.
So, as a trader, we are left with a choice when the market drops, We can take a loss and get out of the trade, or wait to see if the market quits dropping before it tests or violates the credit spread strikes. If we are a week or two into the trade, a decent down move will not make a huge impact, but initially the trade can take a big hit from a down move. The longer we are into the trade without a big down move in price, the less the risk is of a loss. On the flip side, a big move down opens the possibility of additional big down moves that can lead to a very big loss. We reviewed the odds earlier- about 4% of the time the trade will lose based on the far short puts having an initial Delta of 4. If this trade is done enough times, there will be some losses. Let’s look at some management actions that could be taken.
1. Set a stop based on premium price. In this example, we collected just over $8 premium to open the trade. So, we could set a stop to avoid losing twice ($16) or maybe even three times ($24) our initial premium. This would mean a stop loss if premium climbs to $24 or $32, given that $8 premium is our starting break-even point. This is the simplest risk mitigation strategy. Using this will lower the overall win rate as many negative scenarios would end up fine if not closed, but this management technique will prevent huge losses that might impact the account dramatically.
2. Close the trade if the underlying price goes below a trigger point. We know this trade has a lot of cushion. We can handle much more than one expected move and be profitable. But if the move is much more than expected, we have to consider that the move is very unusual and dangerous for us. Perhaps our point to get out is when the debit spread is in the money, or when we are half-way between the debit spread and credit spread. Or maybe it is the short strike of the credit spread that is the final trigger to get out. The further down we allow price to go down, the more we stand to lose. Pick the underlying price where it gets too uncomfortable and use that as the trigger point to get out of the trade.
3. Roll out in time if premium or price triggers are hit. If the position is rolled before the credit spread is in the money, it can be rolled out for a credit. This gives more time for the market to turn around. However, it gives more time for a losing trader to lose more, because we likely can’t roll down that far and still get a credit, and we will likely have to pay to roll the debit spread or narrow the distance between spreads, making the trade less attractive. If the price move continues down, there will be much less room to maneuver going forward.
4. Simply hold on and hope the probabilities play out. With 55 days in the trade, we just need to move down less that two expected moves by expiration. If the capital is available, and the conviction is there, holding can bring max profit with a big down move. Note that as time passes and the credit spread stays out of the money, the premium has to go away, so the value can evaporate very quickly with very high Theta as expiration approaches. This can be observed in the value vs time graph for the -2 EM curve. It can also result in max loss. As expiration approaches, the difference between max profit and max loss is just a few percentage points of price movement and max loss is much more than max profit.
In this example we can see that a move down of one expected move really doesn’t challenge our position, while two times the expected move is playing with fire. So, one approach might be to hold as long as the move stays within the expected move to the downside and switch to closing or rolling once the move exceeds that or some other multiple of expected moves. In any case, a trader has to know their risk tolerance and have a management plan for both winning and losing trades.
What about calls?
A logical question might be- if this works so great for puts, why not double up and do it for calls as well? Well, there’s one problem- skew. On indexes implied volatility is higher as strikes go to lower values and declines for higher strike prices. As a result, out of the money puts have higher implied volatility than out of the money calls. More importantly, far out of the money puts have higher implied volatility than puts closer to the money.
Look at our setup for this example. Implied volatility of the single long put is around 25, while the two short puts have implied volatility of 39. This helps two ways. The short puts have more of their premium tied to volatility, bumping up their price compared to the long put. Also, the higher implied volatility pushes the strike price further down to get a matching premium to the debit spread, making the trade a higher probability of success. We are selling more of the higher implied volatility and buying lower implied volatility, a key reason to use front ratio spreads.
A similar setup for a 1-1-2-2 call trade would reverse the dynamics. The long call closest to the money would have the highest implied volatility and the two short calls would have the lowest. To collect similar amounts to the put trade, the call strikes would be much closer between the debit spread and credit spread, and the difference in the deltas of the strikes would also be closer together, meaning a narrower window of max profit, and a higher probability of max loss. While still a trade with positive probability, it generally isn’t as attractive as the put side.
1-1-2 vs 1-1-2-2
I haven’t talked much about the two long puts bought at less than one Delta to open the trade. They are very unlikely to ever be in the money, and most traders would opt to close or adjust the trade well before they came into play. So, why have them? The simple answer is that they define or limit the risk of the trade, potentially reducing the capital required for the trade, and protecting from absolute disaster in the event of a market crash of over 37.5% in under 55 days. It could happen, like it did in February and March of 2020 during the Covid pandemic. We are giving up 20% of our premium to protect for a once or twice in a lifetime super crash.
So, what if we eliminate the long puts and do a naked 1-1-2 ratio spread? Is it different in outcome or probabilities? The answer is that it is very similar in most ways, and we will also see that a lot depends on the type of account you are trading in as to what choices there are. First, let’s start with the setup of the 1-1-2 trade.
While this table shows the risk as unlimited, it is actually $618,855, the value of two 3100 puts if SPX went to zero by expiration ($620,000) less the $1,145 collected to start the trade.
Some accounts and some brokers require all trades to be defined in their risk. For example, retirement accounts generally aren’t allowed to use option margin and so any naked put would have to be cash secured. For this trade, eliminating the two long puts would mean the max loss would go up to $618,855, assuming that SPX went to zero, while we are holding two short 3100 puts. SPX will only go to zero if we see modern society end, and in that case, we’ll probably have bigger problems than our option positions. But rules are rules, and so if you want to trade without the long puts in a retirement account, you would need $620,000 capital to make a likely $800-$1200 or less than 0.2% return in 55 days or less. We’ll discuss other alternatives after we review the details of the 1-1-2 trade.
Remember that our starting underlying price is $4000 and the trade is profitable at expiration as long as price is above 3100. The chart above doesn’t show losses all the way down to zero price, but just imagine zero price and -$618,855. Our probability of profit is 96% if held to expiration based on the Delta of 4 for the naked puts.
Looking at 1-1-2 values over time at the same price moves that we looked at for the 1-1-2-2 trade, we can see that the premium changes are fairly similar. Staying within one expected move keeps the trade moving in the direction of decay.
If we zoom in on the likely outcome, we see that premium behaves very similarly to what we saw with the 1-1-2-2 trade setup. We just have more premium collected to start with, taking a bit longer to fully evaporate and have the premium turn to a credit for closing. The concept is the same.
Summarizing the differences between the 1-1-2-2 trade and 1-1-2 trade, the 1-1-2 trade collects about 20% more premium in exchange for more loss if the market drops more than 37.5% in the 55 days of the trade. How likely is it for the market to drop more than 37.5%? Is buying the long puts for protection worth it? That’s up to each trader to decide.
Buying power requirements
I usually don’t spend much time talking about buying power because most trades I do are defined risk credit trades where the amount collected is a significant portion of the capital at risk. This trade is not so much, whether defined risk (1-1-2-2) or a naked ratio spread (1-1-2). In non-margin accounts, we collect 0.7% or 0.2% respectively, which isn’t much.
Below is an analysis of different possible ways to trade. I looked at trading each of these strategies three different ways. First, I looked at a cash secured account, like a retirement account. Next, I looked at an account with margin for naked options. Finally, I looked at a much different approach, trading futures options with span margin. The margin and span margin amounts came from entering this trade into the tastyworks trading platform.
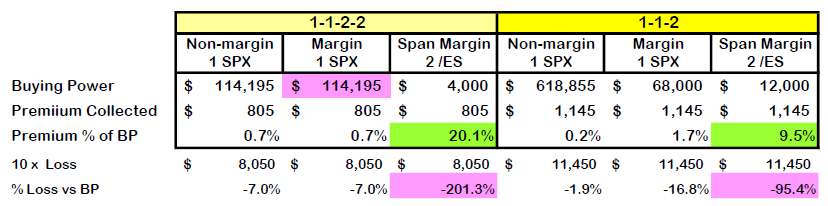
I highlighted some key takeaway points. First, is how leveraged span margin with futures options can be for this trade. Our most capital efficient trade would be doing the 1-1-2-2 on futures span margin where we would collect 100 times the premium as a percentage of buying power (20%) than the non-margin account of the 1-1-2 trade (0.2%). Of course, with leverage comes much more risk. I chose to consider a loss of 10 times the initial credit as a practical worst-case scenario. The span margin would end up costing huge amounts more in a disaster and could potentially wipe out an account if the trade used a high percentage of the account’s capital.
A couple of weird margin anomalies to point out. In my margin account, the defined risk 1-1-2-2 trade required almost twice the buying power as the undefined 1-1-2, which is weird because clearly there is more risk in the naked 1-1-2. I think it may be that the calculation for defined risk is normally much less than undefined and the software may just assume that margin is not useful in defined risk. On the other hand, defining the risk on the futures version cut the buying power by 1/3. Different brokers may calculate their margin requirements differently, so don’t take this as universal truth. Similarly, remember that while defining risk usually increases the return on capital, it makes outsize losses more likely, especially when scaling up. Notice that the highly leveraged futures 1-1-2-2 would lose twice as much as a percentage of capital that the futures 1-1-2 setup in a 10x loss. I discussed this phenomenon in detail in my post on comparing risk.
Remember that margin and span margin change as the trade progresses depending on the market behavior. Span margin is subject to big swings when prices go against a position. A broker may force a position to close much earlier than a trader would want to get out due to expanding capital requirements. So, while initially the position is cheap to enter, a trader needs to limit each position to a fraction of the overall account size.
But the good side of this is that this trade can be entered for a very small cost. The trade is very high probability. We can also make more than the premium collected. I didn’t include it in the chart, but maximum profit for the most leveraged choice above would be $5,805 profit on $4,000 buying power, a return on capital of 145%. And there is over a 20% probability of that happening.
One final note on the buying power analysis table. To keep the quantities an apples-to-apples comparison, I used double the number of /ES futures options because futures options only control half as much value as SPX index options. So, technically, those futures options trades listed are 2-2-4-4 and 2-2-4 because they use twice the number of contracts to get the same notional exposure. I reviewed differences between index options and futures options in detail in my post about different ways to trade options on the S&P 500 index.
What about small accounts?
Readers looking at this may be thinking, “Gee, this is great for multi-millionaires, but what if the account is too small to consider any of these buying powers?” Great question- there are other alternatives. First off, a trader could use half the buying power listed by just trading options on one contract of the Mini S&P 500 futures (/ES). The 1-1-2-2 example would only take $2,000 buying power for $402 premium received. But, if that is still too much, we can make it a lot less.
Many traders are more familiar with options on the SPY exchange traded fund, which trades at approximately 1/10 the value of the S&P 500 index. For futures options, there is also options on the Micro S&P 500 futures contract (/MES), equal to 1/10 of the /ES contract size, or 1/20 of the size of an SPX option. By using SPY or /MES, we cut the size of the trade down by 1/10 compared to the above table. If the account is taxable, another choice would be the $XSP index, a 1/10 value index of the S&P 500 with favorable tax treatment, but lower liquidity. Again, all these alternative versions of S&P 500 options are discussed in my post on different S&P 500 choices.
So, for an account with futures trading capability, this trade could use /MES futures options and get into the 1-1-2-2 trade for just $200 buying power. An account with options margin could use SPY or $XSP and get into the 1-1-2 trade for $6,800 buying power. A trader doesn’t need a million dollar amount to trade this.
Concluding thoughts
I know a number of people who have traded versions of this trade during the bear market of 2022 without any issues. In fact, it could be argued that this trade, like most trades that collect credits from selling puts, works best if entering when the market is already down and implied volatility is high. Bad scenarios are already priced into option premium and there is a lot of cushion between strikes. This trade is most dangerous when volatility is low and prices are high- the probabilities are not as good, because a move of more than two times the expected move down is not nearly as far.
While not for everyone, the 1-1-2-2 and 1-1-2 trades provide a very high probability of success with a nice payout when used with leverage. The trade requires monitoring to maximize profit and to prevent catastrophic loss, so it really is not a set it and forget it trade. The key is to have a plan to manage the position if the market goes against the trade and stick to the plan.
Thank you for your blog. I am getting a lot from it. I enjoy your writing and like the way you approach the markets. I hope you will keep posting and keep us up to date with your thinking and learnings.
Best regards,
Trey
Thanks for the insightful posting about your strategy! I have literally binged on your writings in the past two days.
One question : In a lower vol environment, How closer the farther 2x short strike that you can tolerate? Your example above seems to be illustrated in a rather high iv environment where you are content with selling -22% otm put and still in net credit but you have to roll up your initial short strike if vol is lower in order to be in net credit. You mentioned delta criteria of 4-5 but I suppose you must have certain level/price that you would not go above because more than often market has a tendency to understate downward fat tail risk as in the case of 2018 vol crash or 2020 covid.
Kwan-
I appreciate the kind words and the great questions.
You are correct on one front that lower implied volatility will make short strikes necessarily be closer to the money when using the same Delta. But how much closer? If my at-risk short put is at 4-5 delta, we are essentially two expected moves away for the expiration time frame. And how much is two expected moves? Let’s say it’s somewhere between 2/3, 3/4, and 4/5 of VIX. So with VIX at 20, I should still be able to be 14-16% away. Where do I get those fractions? 40 days is 1/9 of a year, so to convert annual IV or VIX to 40 days, I take the square root of 1/9 which is 1/3 to know how much an expected move will be. But I’m going two expected moves out, so 2/3 of VIX for 40 DTE. But I’m really trading 50 days out, and skew pushes low delta strikes further out, so a slightly higher fraction would be appropriate. So, to estimate how far away we’ll be, I can look to be 75-80% of current VIX. Not exact, but close enough. So, we’re still a long way away in a market that is less choppy than it was for most of the last year.
One way to get a little more breathing room is to wait for down days to enter. In this oscillating market, a day that’s down a percent or two moving toward support will raise VIX a bit and the current price will be lower, allowing us to sell lower strikes- hopefully getting in near the bottom. I try to avoid days that are big up days for entry, especially if we are near what has been recent resistance levels. The market tends to switch back and forth from super optimistic one week to super pessimistic the next, so I want to add positive Delta when the market is down. This trade doesn’t have that much Delta anyway, and the 1-1-2-2 just gives more cushion than the other ratio trades I do. I know some traders who did really well with this trade in 2022, even with the fairly large price swings.
Credits will drop some, but at the same Delta the premium shouldn’t be much less. There is the possibility of lowering the 1-1 debit spread portion and paying a little less to get the same total credit for the full 1-1-2-2 without changing the other dynamics of the trade. Another choice would be to go a bit further out in time but also slow decay more.
If you consider that 2020 and 2022 were pretty extreme because of the crazy unprecedented nature of Covid, the big stimulus, and then rampant inflation that caused the Fed to tighten extremely quick, it doesn’t seem likely to have a repeat anytime soon. We are still at volatility levels above historic averages. If we get much below VIX levels of 15, I’ll probably look for more debit style trades, but we still have a lot of IV in our options.
Thanks again for such a lengthy and insightful reply Allen!
As I have done quite a lot of my homework on developing my own BWB/BWC style, more and more I can’t help but getting inclined to the classic 1-1-1-1 (or on my part 1-1-1-2 for the reason below) rather than 1-1-2-2. You will always be stuck up in deep short vega early on and it only gets bigger as the market moves in either direction. Plus during some of the major market crashes IV curve tends to be skewed steeper because those far OTM short puts start to jump erratically (due to desperate hedging demand coupled with vomma) and you will be in deep unrealized loss for the rest of the month.
How would you deal with this? I know that as long as price does not touch the short put strike in the end it will be OK but it keeps hurting badly especially if the market drops quickly with vol curve steepening while you still have 4-5 weeks left to expiration. Do you just clench your teeth and pray that the price does not drop and IV not expand further while oversized theta does its work on getting your profit back every single day?
My backtest on some of the down markets (2008, 2011, 2013, 2020, 2022) showed that it performed (and actually turned into the some of the biggest profit trades I could ever make with BWC) better if I had put on a cheap vega (and subsequently skewness) hedge by buying those farthest OTM puts twofold and make the whole butterfly 1-1-2-4.
Any thoughts on additional hedge? I agree that for the most time this hedge would only eat up our profit but we all know this type of milking-the-time-value trade needs some ways to avoid steamroller…
Kwan-
I understand your concern with possible tail risk. Adding more long puts as a hedge like you are suggesting would work in the worst of situations, like the Covid crash where we lost 30-40% in a month. But even last year when we dropped as much as 25% by the low, the decline wasn’t fast enough to trigger those deep puts to a profit relative to the rest of the trade. So, the scenarios are extremely rare, but they do happen.
My approach has been to layer these ratio-style trades, the 1-1-2-2, 1-1-2, 1-1-1-1, 1-1-1, etc. by adding new ones frequently while I have others on. The new ones have a lot of positive Delta and would take a hit in a moderate downturn. As the positions age, the Delta decays and the debit spreads become more protective, a wall protecting the risky short puts. So, the combination is what protects. Overall, the probability of profit is in the mid 90 percents.
Another hedge is a short-term long straddle, like the 1 DTE Straddle I’ve written about. It can protect against fairly good-sized moves.
Carl,
I’m so grateful to have found your page. As others mentioned I’m binging through it now and expect to reread your posts several times in hope of absorbing everything.
Being new to trading, what finally gave me confidence was commencing this strategy in May 2022 and earning annual rate of ~75% since (100% dedication of allowed capital to it). I learned it from a popular options mentor, who gives it his own marketable title, but I recently learned the rest of the world was always privy to it as ‘1-1-2’. In the interest of starting to tweak the strategy for higher returns I’m excited to try your clearly-described approach. Just want to make sure I’m taking away the right ideas.
The way I was prescribed entailed further dated naked shorts, 65 – 115DTE. By switching to 55DTE theta will decay faster and turnover should be faster, profits higher, but more risk? I see your mention of this in last reply to comment. Fortunately, your presentation also indicates that under normal market conditions closing no later than ~20DTE would be appropriate to stay out of trouble.
The other main difference in what I was prescribed was to purchase debit spread in much closer DTE, usually 30DTE, instead of in same as naked shorts, and long put at higher delta (0.3). Referring to your Greek arithmetic guidance, I calculated that combined theta of 1-1-2 the way I’ve done it is 0.56, while a 1-1-2 entirely in same expiration of 55DTE is at 0.72. So your version of strategy rises in value significantly faster just based on theta?
Mentor always called the debit spread our ‘hedge’, suggesting it served primarily to defend from large losses in case of rare but devastating market drop. And he always reminded you’re never trying to make money from the hedge, it’s just meant to serve as insurance. So I find your version more interesting since you do hope to add profit with your debit spread and indicated when to close for that.
I’m guessing the way I was taught was a lower risk version of strategy, ‘training wheels’ for newbs like me, while your strategy will allow a bit more risk but increase profits. I haven’t gotten into backtesting yet, but I’m assuming your strategy is as validated as possible so I’m going to go ahead and switch to it.
Looking forward to learning more from you!
Kurt
Kurt-
Thanks for the kind words and thoughtful question. Nice job on the trade- 75% annually is a great result. You are even asking your question in a Data Driven kind of way, focusing on comparing Theta of different versions of the strategy. That’s exactly where I start, and then see how risk plus other Greeks are impacted as well.
There is no “right” answer to the best way to do this type of trade. It is simply understanding the benefits and risks of different choices from a math and probability standpoint and choosing the version of the strategy that best suits your tolerance for risk compared to potential gains.
Let’s start with the question of duration. This is simply risk vs reward. The more time until expiration, the slower the decay, but the less likely that the strikes will ever be breached, especially if the trade is managed early. I’ve decided that 50 days is my minimum duration to enter this trade after trying it on much shorter timeframes where a bad week or two could cause a severe test. 50 days kept me in the clear with very little worry. There’s nothing wrong with longer duration, it just moves slower with further out strikes. How much difference? It’s all proportional to the square root of time. A trade half as long will have the square root of two, or approximately 1.4 times as much Theta. A trade twice as long will have 1.4 times the stike price difference from current price for the same Delta options. As duration goes up it gets less likely that the risky short put will get tested- A two standard deviation move in a week happens fairly often, but a two standard deviation move for two months is very rare. Long duration outsized moves typically only happen with IV is very low, well below 15 VIX.
As for the question about longer duration for the risky short put than for the debit put spread, my opinion is that same duration is better. I’ve heard fellow traders pitch pushing the short put further out in time, and I’ve even tried it that way to get a feel for the difference. I haven’t done a thorough study, but my initial take is that the two main benefits of this trade are lessened by having the debit spread with less time. The benefits are super-fast decay that makes the debit spread worth more than the risky short put by midway to expiration, and Delta protection of the debit spread that builds up as time goes by. I like the fact that the 1-1-2 is likely to be able to be closed for a credit because of the huge disparity in decay between the two naked puts and the debit spread. I play for that scenario. However, if the risky naked puts have more time, the decay difference is less, and the debit spread generally always stays less valuable than the naked puts. So the best one can hope for is a significant reduction in premium from what was collected. The other issue I have is that with a shorter duration debit spread, it doesn’t protect the short naked puts as well. As expiration gets closer, the debit spread doesn’t really have much impact until it is close to the money, while the longer put will increase in premium because it has more time. On the other hand, equal duration options will see the debit spread impacted much more substantially than the naked puts, especially after a few weeks into the trade. So I don’t see the benefit of pushing the risky shorts further out in time in this trade.
My thought is if someone is comfortable with longer timeframes for naked short puts, why even bother with a half-hearted debit spread hedge that has less time? – just go naked. I haven’t written much about the beauty of naked positions, but one key difference is that they are much easier to defend when tested than spreads, and the more time there is, the more cushion there is to use before playing defensive tactics. But that’s a topic for another post, another day.
Hi Carl!
Thank you very much for all this content. Its a mother load of information that I need to print it an reread many time to be able to absorb all aspects of this great text. Will start now to binge the rest of the blog. Thanks for your time and dedicating clarifying all this for us.
Have you considered in your analysis allocating more money to cash secure the sold puts (/MES – /ES) in a way that if disaster occurs and your shot put get to be exercised, you’ll have all the money to buy the future contract at a great price, after at least 20% fall. From there you could just sold it right away, keep it for the pullback or start selling calls against it (sort of wheeling it).
Some might say it’s not the better use of BP but may bring some piece of mind. I’d love to rear your thoughts on that if possible.
Thanks again,
Ed
Ed-
Thanks for the kind remarks!
I’m actually working my way around to do some broader discussions on level 0 covered options. Cash secured puts, covered calls and covered strangles are great trades that can reduce volatility of a portfolio without giving up much in return. I’ve focused much of my writings on higher leveraged trades, but I realize that my traders don’t want to take on that level of risk. Covered trades have less risk than stock, which makes them very low stress when you understand how to utilize them. They can also prepare you to take on much riskier trades by managing a low risk version of a trade that can be done on margin or even SPAN margin. So, stay tuned for content along that line of reasoning.
We can even do the 1-1-2 as a cash secured put with a debit spread, but as I mentioned in the text, the return on capital is very low. We could probably do better with T-bills at this point in time.
Hi. Thanks for the write up. How has the Broken wing Put Condor and Broken Wing Butterflies performed for you in 2022 and 2023. I suppose you wrote the original articles back in 2021.
@Sumit- 2023 was a good year for the Broken Wing Butterfly and Put Condor Strategies. For me, I’ve tended to look at down days with increased IV as opportunities to open these trades vs a more drum beat approach. However, in a year that was mostly uptrend, it didn’t matter as much. Rolling positions down and out on the bigger downturns worked out as well.
2022, with the bear market, was a difficult year at times for the Broken Wing Strategies due to the short duration of the way I have traded these. The 1-1-2 and all of its variations as described on this page with the riskier parts of the trade much further out of the money played out much better, as well as longer durations to absorb moves.
Hi Carl, I recently discovered your website and have been binge reading your articles since then. Your in depth analysis is really worth gold.
I’m trying to get my head around when you pick which strategy. From what I understand is that the 1-1-2(-2) is the highest propability trade on this page but of course with significant tail risk. Not only a large price drop threatens this trade but also a IV spikes due to vega.
Therefore its propably Not the best time for the 1-1-2 in low IV markets. Maybe trade the BWC instead? When do you trade Credit Spreads or PMCC? I get that in low IV Net buying strategies like debit spreads are more reasonably priced so PoP is a bit higher but this seems a bit one dimensional and doesnt guide enough of whether to take on a spread a PMCC or a front ratio spread. Maybe you could shed some light on your decision making here.
Keep up the great work. I’ve learned so much from this blog!
Paddy
Paddy- Thanks for the kind remarks.
I don’t think of it as either/or decision, but more of a sliding scale. The higher the IV, the more I want to be in option selling strategies, and the lower the IV the more it makes sense to buy options and choose strategies like a Poor Man’s Covered Call.
There’s also a significant difference in the Vega risk for a naked position compared to a defined risk version. When VIX spiked to 60+ on August 5, sellers of 1122 were in much better shape than 112 sellers.
Hello Carl,
Thank you for the sharing, I really love the concept of the 1-1-2-2 strategy. However I experirenced that the market can hardly offer the same advantage to the 1-1-2-2 seller as you mentioned in the first part:”an interesting dynamic of extra rapid decay of the premium involved. The farther out puts or put spreads decay faster than the closer debit spread, and often lead to the debit spread having more value than the credit spread. ” the farther out puts spreads decay no faster than the closer debit spread in most circumstances, even maybe the other way around.
I don’t know if you feel the same of the time decay or maybe there were mistakes when I set up the deal. Any suggestions would be greatly appreciated.
Sebastian
Sebastian- don’t take my word for it- look at the Theta values. The near debit spread should have Theta values that nearly cancel each other out. Then the far out options should be set up where the short options have much more Theta and premium than the protective long that is way out. There should then be significant positive Theta that is possibly initially dampened by the very far out long until it has nothing left while the far out short decays faster. The far out short should dominate most of the trade period as long as the market stays flat, goes up, or slowly declines. The trade should be nearly Delta neutral unless the market has a big break to the downside, so Theta should dominate the trade.
One thing that can mess this up in the initial set up is having the far out long be too close to the far out short, which then causes the Theta of those two options to cancel each other out. Hard to tell from your question, but that would be what I would suspect is slowing early decay.
Hello Carl,
Thank you for the detailed breakdown of the 1-1-2-2 Put Ratio strategy — really appreciate the clarity you bring to complex multi-leg setups.
I had a couple of questions that I’m hoping you could weigh in on:
1. Performance in Recent Volatility: How did this strategy hold up during the market turmoil in early April 2025? I’m curious whether the time decay advantage held its ground or if the rapid movement pushed the position too far ITM to recover.
2. Risk Management Consideration: From a capital efficiency and risk management standpoint, how critical is it to maintain the inner debit spread component? What would be the implications of omitting it entirely and only running the wider 2-2 credit spread? Would that significantly alter the payoff structure or risk exposure?
Thanks again for the insight — looking forward to your thoughts!
Thanks for the kind remarks.
1. I think success in April 2025 depended on when you entered the trade. I had a similar trade on using SPX that I started with the market just a little off all time highs. My far out very low Delta strikes were at 5000, which seemed extremely safe when the market was at almost 6000. However, as the market approached 5000, I realized that I had a problem, and I had to sell my debit spread to pay to roll down and out. My rolled position has recovered most of its loss, and I hope to get out with a net overall profit in the next several weeks. If I had gotten in at a higher point, I would probably not been able to adjust enough. When IV is high, the debit spread doesn’t get to the value of its width until close to expiration- there is too much extrinsic value, so it may only be worth a little over 50% of the width while well in the money. So, when you need the debit spread the most, it may not be there. The rapid drop in April 2025 didn’t give time for the debit spread to help- it works better in slow downturns, like in the first half of 2022, where this strategy worked really well during the bear market. This also was not a good strategy during the August 5, 2024 volatility spike, although if you had the two long puts on the credit spread, they kept the trade from blowing up. There’s a big difference between the 1-1-2 and the 1-1-2-2 during periods of high volatility.
2. I get asked about what the debit spread does a lot. What I’ve seen is that it makes the overall position decay faster, especially in a slowly moving down market. If someone wants to trade a credit spread alone, that can be a good choice and is clearly much more simple. I look at strike selection differently for credit spreads, and I manage them differently, so I don’t think of it as the same trade as a ratio style defined risk strategy.
To answer your specific question, with just the 2-2 portion, you’d collect more credit initially, but you’d also have to put up more capital. There is no scenario where the position can ever have a positive value- the best you can do is expire worthless. So, managing early might mean keeping 50% of the premium collected instead of 80-90%, but you start with more, so maybe it is close to even. From a risk standpoint, you have fewer choices if tested- there is no in the money debit spread to bail out the trade or finance a roll of the credit spread.
Bottom line- there are pros and cons to each version, and the key is to understand what is different and which trades are more in line with your preferences for risk, reward and mechanics. Every trader is different and has different viewpoints on managing winning and losing trades- those viewpoints determine which types of strategies will work best for them.
Thanks so much for the detailed and thoughtful response — it really helped clarify the strengths and trade-offs between the 1-1-2 and 1-1-2-2 structures.
Your insight about the April 2025 drop was particularly helpful. I hadn’t fully comprehend why the debit spread can be less effective during a sharp move down, especially when IV remains elevated and there’s significant extrinsic value left in the contracts.
It sounds like you managed the position proactively by selling off the debit spread to help fund a roll — that’s a great illustration of how the debit leg can provide flexibility. On that note, how did the drop impact your buying power as the market approached the lower strikes of your credit spread? Was there a point where you were concerned about a potential margin call?
On a related note, I tried constructing the 1-1-2-2 using strikes around Delta 24-19-5-3, but the premium received didn’t seem optimal. Do you have any recommendations on strike selection or adjustments that might help with that?
2 BTO 56D (Jun 27) 4400 (Delta 3) $9.95
-2 STO 56D (Jun 27) 4700 (Delta 5) $15.75
-1 STO 56D (Jun 27) 5300 (Delta 19) $63.25
1 BTO 56D (Jun 27) 5400 (Delta 24) $80.75
Total – 3.70 db
Thanks again for generously sharing your experience and lessons from a tough market period.
Buying power issues depend on the type of account, the type of underlying used and whether you are trading on margin. One key is not to ever get over leveraged where you can be force to sell at the very bottom. (This happened to me in August 2024 in one account.) Futures options are the most susceptible to extreme swings in buying power requirements because they use SPAN margin which is adjusted to protect for a one day move. It takes into account volatility and all future options holdings. An emergency hack when trading futures options is that you can often gain significant buying power by buying a short duration straddle. That essentially takes off short term risk of short positions, but also has its own risk and reward considerations. I wrote about it in this post: Buy 1 DTE Straddle. So, yes I was concerned about buying power, but I had plenty of cash-like positions that I could use to meet requirements. I keep my cash holdings in BILL and other interest bearing ETFs, so that I can easily free up capital to work around difficult scenarios. So, I was never in real danger.
On your setup question, you can always go even further out with the protective long. You could also narrow the debit spread, as I typically try to use 50 wide under normal scenarios. Obviously, that increases buying power and risk, but you could collect some premium. As long as you understand the trade-offs, you can make an informed decision.
For context, I’ve been trading ES futures options over the past year, primarily selling naked puts around the 3-delta mark. The April 6th event was a major wake-up call — I ended up taking significant losses and was forced to close positions due to a margin call. I had been allocating $15,000 per contract and keeping my buying power usage under 50%, thinking that approach was conservative. Unfortunately, that assumption didn’t hold up under stress. In other words, for a 100K portfolio, I was maintaining 6 contracts.
That experience leads me to my main question: how much capital do you recommend setting aside per “1-1-2-2” structure to manage risk more effectively?
Yes, any form of naked futures options are extremely leveraged, probably the most leveraged option product available. The hidden risk is how much SPAN margin requirements can blow up, not only based on your strikes getting closer, but by the impact of increased Implied Volatility. With all naked options, and especially with naked futures options, it is always good to review how much notional value there is in a position- This represents the maximum outlier risk, dozens to hundreds of times your initial buying power.
For the 1-1-2-2 trade, the good news is that the trade is defined risk- you know what the maximum loss is and so does your broker. However, that maximum loss can come into play when the market makes very large moves that are several times the expected move. So, a 5 Delta far short is still within 2 standard deviations, and even with a duration of a few months, the position could get into trouble, and max loss becomes a possibility if not managed with a stop or an aggressive roll. So, how much can you afford to lose? 10%? 20%? 30%? 50% We are seeing these kind of outsized moves more often, possibly because of how much option trading is now driving the market. So, personally, I don’t want that much exposure to the risk. On the other hand, when IV is very high, I actually try to add to my positions, but I can only do that if I have not used up a lot of capital when the market was calm. It is really backwards from what emotions tell us- when things are going well, we want to add more positions, which we shouldn’t, and when things look the worst, we want to pull back, but it is already too late. I hope that helps, but ultimately each trader has to decide what is too much risk.
Hi Carl,
Thanks for the thorough analysis.
I have a question here: Looking at 49 DTE and similar deltas
if I sell 10x contracts of /MES for the front put spread 1-1-2-2 premium collected is roughly 10*2.75*100 = $2,750
if I sell 1x contract of /ES then the premium collected is only around $670.
Would it be more advantageous to sell more contracts of /MES for the same notional as /ES?
Something is off in your numbers. Remember that the contract multiplier for /ES is 50 and 5 for /MES, unlike the multiplier of 100 for most options. Futures options are all different.
Next, I’m not sure why you’d pick a set up with a net premium of 2.75 credit- I typically like to aim for $10-ish. If you pick the same strikes, you should get the same net premium, so if you selected $10 credit on each, you’d receive $500 for ten /MES contracts or one /ES contract. Option premium for the same strike price and expiration should be essentially the same. The only difference is the multiplier. If you compared SPX and XSP, you’d see more differences because prices are 10x different, but multipliers of 100. See the write up on Different ways to trade options on the S&P 500 for more.
Dear Carl,
thank you for all theses amazing support. I spend some hours reading & understanding your blog, modelling some strategies with optionstrat and testing them with optionomega. For about two month I´m trading now the 1-1-2-2 Front Ratio, 21 Day Broken Wing Butterfly and the Broken wing Put Condor on SPX and RUT with great results. They are doing all great! I want to keep a mix, but need to figure out how to balance them.
Since I have found the best inspiration in years here in this blog: Is there a hedge you can recommend that suits these trades (which can already cushion a lot of downside)?
Thank you and best Regards, Hannes
Thanks for the kind words. You are wise to be concerned about the potential for a downturn. It sounds like all your positions are defined risk, nothing naked, so that helps, but a big downturn can wipe out those positions to max loss, so pay attention to the buying power that they consume and consider that to be 100% at risk. For a hedge, there are a variety of somewhat complex strategies that try to buy a ratio of puts out of the money paid for by puts in the money at different time frames. I haven’t been able to make them work effectively, but others have. Probably the simplest strategy is to buy out of the money calls on VIX (the Volatility Index) when VIX is relatively low. You can also buy call spreads on VIX to reduce cost. However, be aware that because options on VIX are a derivative of a derivative, their behavior will not be as straightforward as you might expect. Because the market anticipates that VIX will return to normal levels eventually, long-dated VIX options don’t jump in value when VIX spikes, although they can increase significantly. If you search around, you can find many videos and other approaches to using VIX options as a hedge. A key is to get the “insurance” before it gets expensive and cash it in when fear is highest. Timing can be tricky on both ends.
The best way to manage risk is to keep the total amount of short bullish option strategies at a level that a total loss won’t devastate your portfolio. That percentage is an individual decision- for some 10& is too high, where others are comfortable with well over 50% of their portfolio in option spreads.
Hi Carl,
Could you please provide your experience on when to close the positions originally opened at 45 DTE and 60 DTE, and repeat the process for the new ones?
My approach depends on what the underlying index does. I generally consider three scenarios- market up, drifting down, market crashing down.
1. market up- most of the time this is what happens. My goal in this situation is to let about 80% of my premium evaporate, so if I collected $10-12 premium, I will close when I get to $2 premium left, which is usually around half-way through the trade. Because the market has gone up, I won’t have an opportunity to close for a credit unless the market suddenly reverses, and that is unlikely so I’ll cash out and take off the risk. Again, this is the most likely situation and what I expect to happen 80% of the time.
2. market down- this happens occasionally. This is the opportunity to collect a credit in addition to the credit that was collected to start. The key is to watch Theta as the trade evolves. As long as Theta is positive, the position is making money. Max gain is if the underlying index goes below the debit put spread, but is still well above the two far out of the money short puts. If above the debit spread strikes, we want to close when Theta approaches zero and it is about to turn negative. This is max profit and the credit will eventually go to zero if the price stays above the debit spread. If below the debit spread, you can play for an expiration with the debit spread in the money and the credit spread out of the money, or just close when the premium looks like a sweet spot- a down move can bring the credit spread into play for max loss, and an up move can eliminate the gains from the debit spread. A good but tricky place to be.
3. market crashing down- this is pretty rare, but seems to be more often lately. If the market quickly moves down through the strikes and the 2 credit put spread components are in danger of going in the money, it is time to either roll or close, depending on your plan.
Entering new trades can be either something done mechanically on a periodic basis, or opportunistically based on market conditions. I typically don’t do this trade on a continuous basis, opening a new position every time I close an old one, like some other strategies because the closing point is usually when the market is relatively high, based on my closing mechanics and the fact that most of the time we are in the first scenario.
There’s a lot to consider when developing a trading plan for this strategy.
That’s a very good insight. Thanks for sharing your perspective. I have a similar stance about not closing and opening a new one immediately, rather than figuring out based on the market pendulum.
Great to see your website back up!!
you dont tell us how to enter this trade.. i use tos.. what is this called or where do we build it..
great idea but not being able to use it
trying to build this at 6870 mark on spy is useless without more info..
everything shows a loss or a 50 dollar gain positive side.. i could have scalped 20k in the same time as ive spent here
Sorry that you did not like the explanation. With TOS, you can build this out from the option table, although it can be a little challenging to see the total premium and Delta as you adjust strikes. You just have to set up the four strikes to get the two parts of the trade to have the premium amounts needed. If you trade SPY, the amounts are 1/10 of the amount of the SPX index options or /ES or /MES futures options. You mention SPY, but at a price of the actual index, so not sure which underlying you are using.
Use the Delta values to get into the right range of strikes, then adjust to find strikes with $10 difference in premium for the debit spread, and collect $10 for each of the two wider credit spreads. For SPY, look for $1 on the spreads instead. The net premium should be a $10 premium credit for index prices, or $1 premium for SPY.
Thank you so much for the excellent analysis and presentation. When you talk about risk, have you noticed with the T+0 line or current price line that the trade drops drastically with a hypothetical volatility increase of 10-20%? Yet in reality, the drop isn’t nearly as severe? What’s the reason for this?
If you look at volatility through VIX, it doesn’t play out equally across the term structure. Options farther out in time don’t change in IV as much as the 30 day options, and options closer to expirations often move more in IV. Volatility changes also don’t impact equally across the various strikes of the same expiration. So, when you change volatility on an analysis chart, these factors don’t get built in. To be fair, predicting changes in volatility is very difficult and even the best models are not very accurate, because IV changes are very unpredictable.
With the 1-1-2-2 trade the far out two long puts can change a lot in a volatility spike, protecting the 2 shorts. In the volatility spike of early August 2024, when VIX jumped to 60 during off hours, there was a big difference for traders that were naked with 1-1-2 vs traders hedged using 1-1-2-2. 1-1-2 traders saw their margin requirements and marked losses shoot up dramatically, sometimes wiping out accounts, while 1-1-2-2 traders had defined risk with more manageable losses.