Selling put spreads is a fairly simple trade that can generate one of the highest returns on capital of all option trades. The trade is fairly flexible to adjust for higher returns with higher risk, or more consistent, but lower returns with lower risk based on choice of duration until expiration. While I’ve written about put spreads in detail before, I recently did some additional studies to see if my earlier conclusions on best Delta values for entry were still accurate.
I’ve noticed from Google Analytics that many traders are searching for the answer to “What are the best Delta values to use for selling put spreads?” or some variation. While I think my earlier webpage on put spreads covers that fairly well, there have been enough people question me, and enough questions pop up from my own trading to cause me to go back and dig into the data a little deeper. The quick answer that I usually give to anyone on Delta values for a put spread is to sell the put strike with a 20 Delta value and buy the strike with a 13 Delta value. This optimizes position Theta, and also provides a nice, relatively high probability of profit. But is that answer true if the expiration timeframe is short, like just a few days, or really long, like several months?
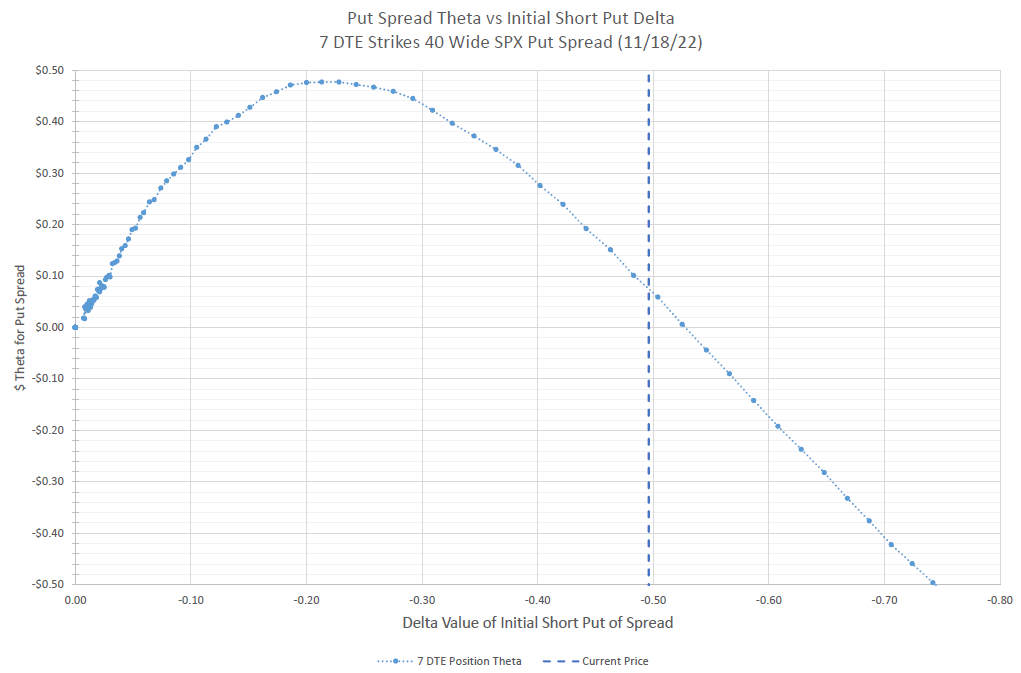
Readers likely have a hint at results from the featured chart image at the top of this post. I decided to look at all the possible Theta values of short put spreads at different strikes. For the first example, I looked at 7 days to expiration (DTE), and chose 40 point wide spreads on SPX, the S&P 500 index. SPX is generally my go to choice for options on the S&P 500, but as I wrote in another post, there are lots of different ways to trade options on the S&P 500. So, the graph shows the Theta value relative to the Delta value of the short put of the spread of all possible 40 wide put spreads, expiring 7 days from November 18, 2022. The chart shows a very smooth curve peaking around 22 Delta.
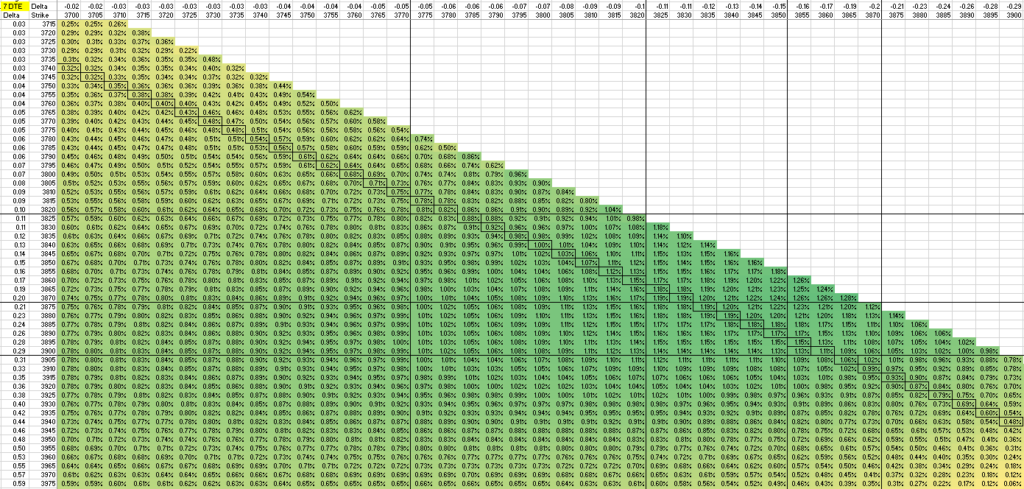
Here’s a slightly different way to look at the different Theta possibilities of 7 DTE put spreads. The horizontal axis is the long strike value, and the vertical axis is the short strike. The various values are color-coded, where the greener the cell, the higher the Theta value is as a percentage of the spread width, while yellow means lower Theta. As I’ve written elsewhere, this is one of my favorite ways to evaluate decay of a spread. I also drew boxes around all the values where the spread is 40 points wide- the points that are plotted on the earlier chart at the top of this post. If you zoom in on this green-yellow table, you can see that each cell is a percentage value, while the left and top lines show the strike prices and Delta values of each strike price. This table goes out much further than what I’m showing, but this is the part of the table where values are highest, and you can see the values are lower at the edges of this chart.
Note that delta values of between 5 and zero for the long put tend to have lower Theta values. And when the short puts get into the mid-twenties to thirty, Theta drops off. There are a number of combinations in between that have good Theta, and one could make an argument for many different ones.
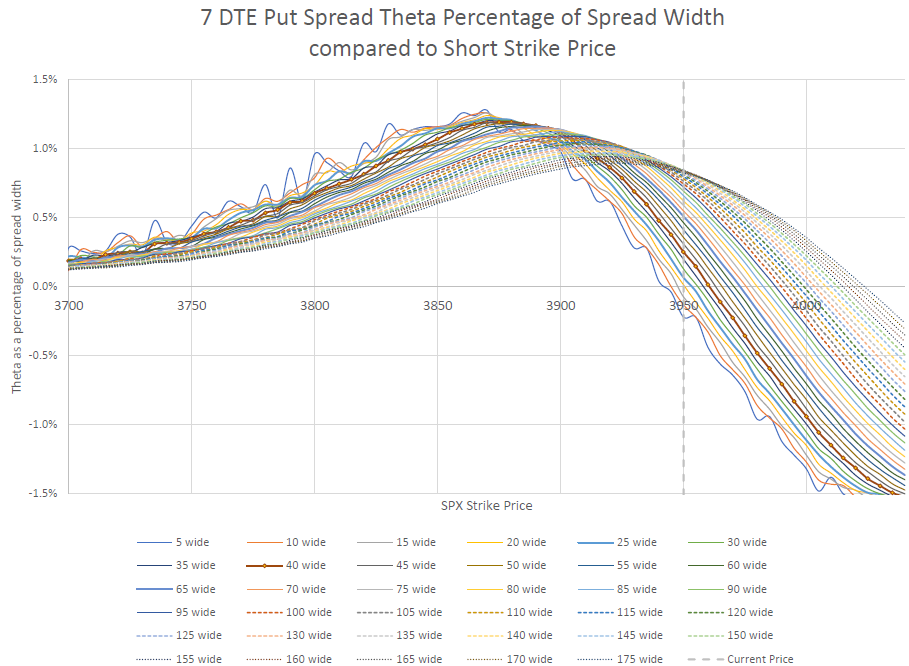
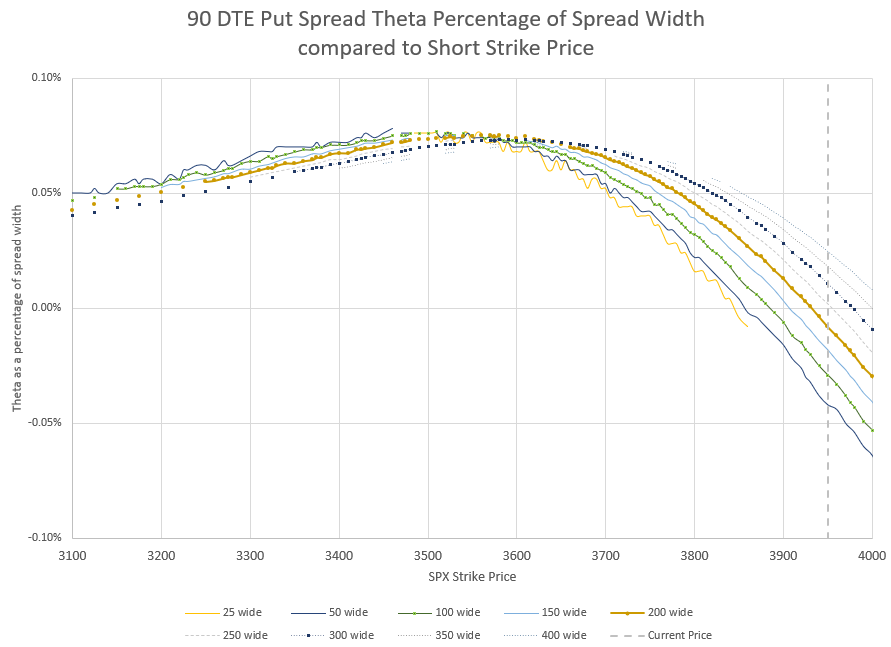
One more way to look at this is to look at a graph with each line representing a different spread width. Notice that the most narrow width of 5 points has a lot of variation- this is because the Theta difference is so small, yet divided by a small width and a few nickels change in the difference in Thetas doesn’t scale smoothly. I’ve highlighted the 40 wide line that I’ve used earlier. One could argue that another line might be a better choice, but as we go wider, the peak gets closer to the current price which makes the probability of expiring in the money higher and higher.
Since the chart is made based on the short put strike, the curves move higher and higher as the spreads widen. Notice that as the spreads get wider, the peak Theta percentage gets smaller.
Longer Duration put spreads
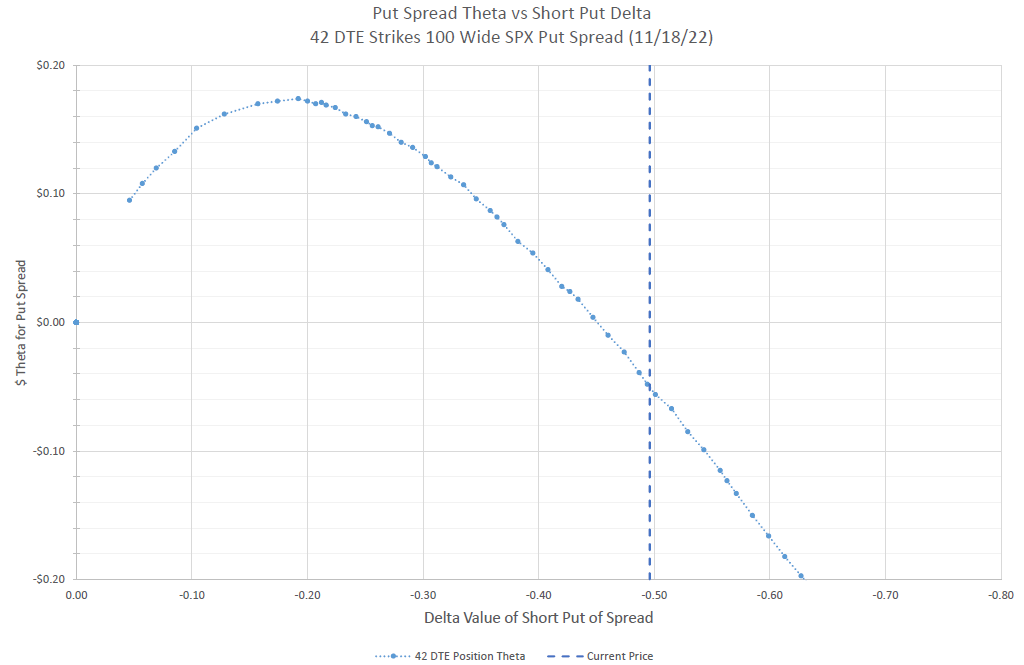
Let’s go a little further out in time and see if the data is different. At 42 days to expiration, we get somewhat similar results.
I also did a similar thing with a table of percentage Theta values, highlighting the 100 wide spreads.
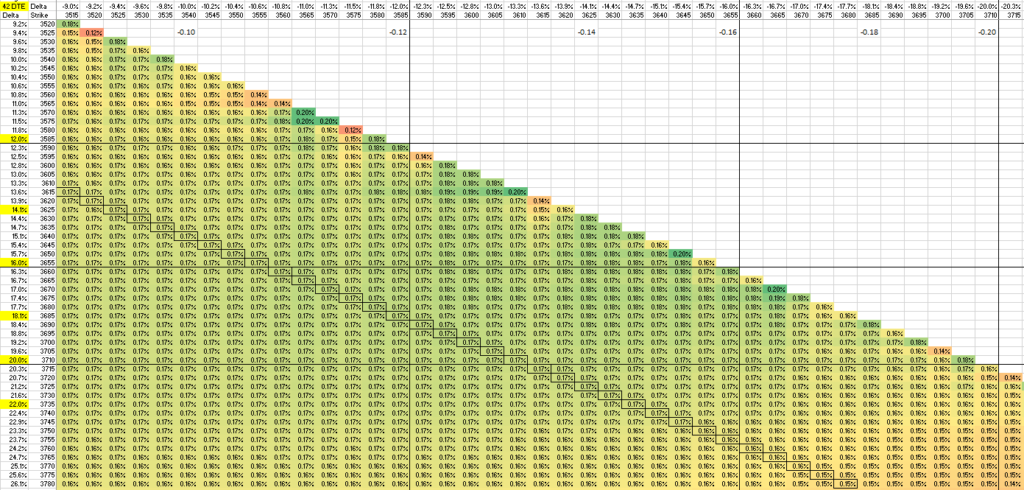
Even longer duration put spreads?
Let’s look at 90 DTE for an even longer duration.
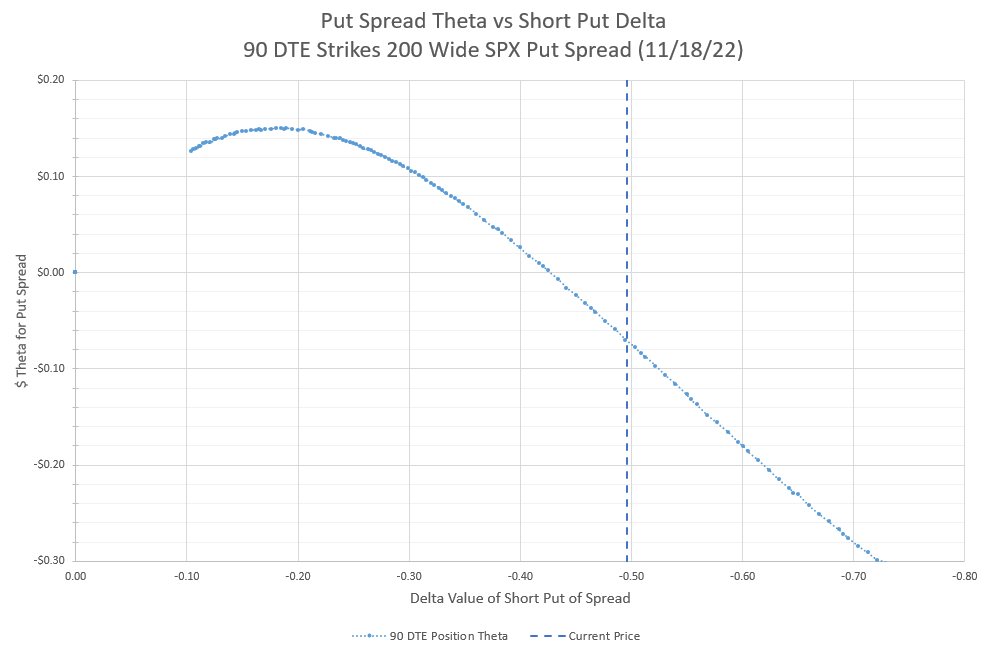
We can also look at a table of Theta values as well for 90 days to expiration.
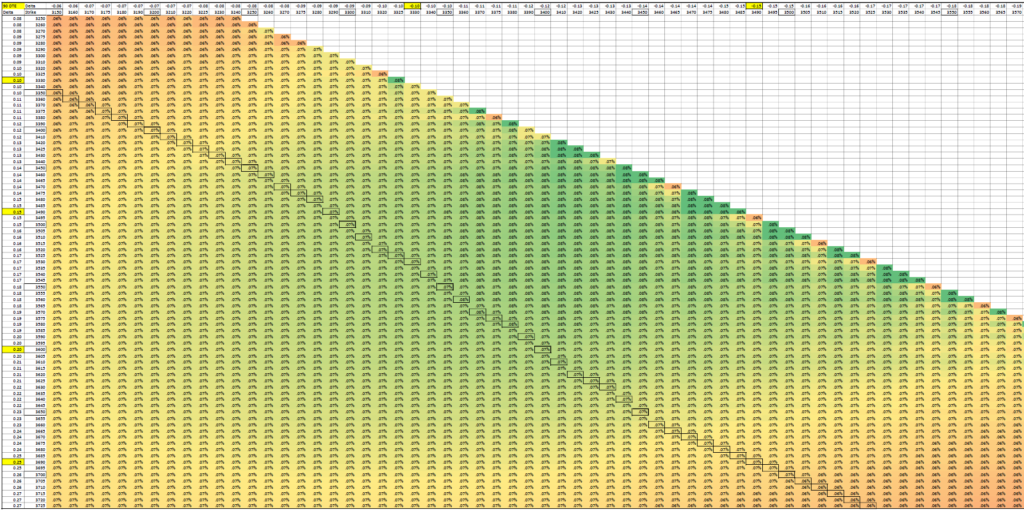
Again, the highest values have short strikes in the teens and low twenties for Delta. However, it probably is worth noting that the values shown are not that different between the yellow and green cells. So, maybe we should look at different spread widths to see it graphically.
When selling spreads this far out in time, the idea is to have a large buffer from the current price and get much of the premium to decay well before expiration is even close. Let’s look at an example of how this might work.
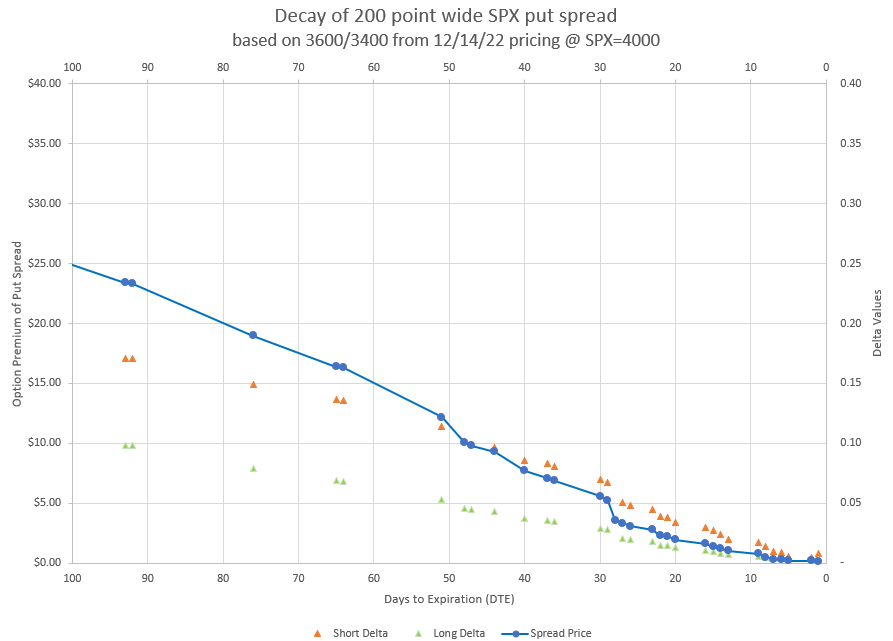
Starting with low deltas below 20, we can see that much of the decay of this spread happens well before expiration is even close. In fact, the last 20 days have virtually no premium left, which would suggest closing early and moving on. I plan to do a lot more studies on the decay curves of different spread widths and strikes to help identify the pros and cons of different entry points.
Conclusion
I think it is safe to say that the original study on spread width still stands. However, the data shows that there is some wiggle room around our old ideal of 20 Delta short and 13 Delta long strikes. We just need to be in the neighborhood. We don’t have to be exact.
Where’d the data come from?
Readers may wonder the source of the data for all these charts and tables. Actually, it’s a source that anyone can access and replicate. I simply copied an option table from my broker’s site and pasted it into Excel. Then I used a pivot table to organize the data so that it was friendly for the analysis I wanted to do. The option table had Delta and Theta values for each option contract available, and I had to use some formulas to figure out percentages of spread widths, but it wasn’t any really difficult challenge.
I do worry that my broker is changing the format of the option tables it presents, and copying every contract may be a bigger challenge in the future, but for now, I can display all contracts and select all with Control-A, then paste as text in Excel. In the future, I may have to paste a smaller amount of data each time. Readers trying to replicate these studies may face the same problem.
The decay graphs point to longer than 45 DTE to enter the trade: Gamma risk further reduced + the decay is ~ the same. I think the best timeframe is 100-150 DTE. You go any further and the strike selection has dried up a bit and the wider bid-ask spreads can make for costlier entries vs earlier DTEs.
What data do you have to claim anything greater than 100 days, which is as far as this chart goes, so it would be interesting to see what the decay curves look like out there, as well as some sort of gamma plot to back up that assertion. The TastyTrade people claim that gamma risk gets too big at 21 days, but since they usually don’t go beyond 45 days to open, gamma behavior longer than that intuitively is less, but I’ve never seen a plot if there is a large non-linearity to gamma when going much further out. In SPX or ES, it is practical to go out to 120-150 days, as you still have decent liquidity and strike selection. In just about any other underlying, going beyond 90 becomes very difficult due to wide bid/ask spreads, less strike selection and less expiration choice.
Hi Carl, I was wondering if the optimal Deltas would deviate when we have a different IV. When IV spikes skew stretches. Did you test that aswell as I assume the data for different DTEs was all for a specific IV regime.
A case could be made that in higher IV environments, a trader could go to a little higher Deltas to collect more premium, anticipating premium collapse when IV drops. You could also use lower Deltas to collect nice premium and get out even easier than normal. I haven’t done exhaustive studies of this. The result difference between the ideal values I’ve identified and others nearby don’t drop off quickly, so keeping Deltas in the general area will get similar results.