Sometimes you stumble across something that just works. In option trading that is actually rare. The 21 day broken wing put butterfly sounds like a something a entomologist chef might come up with, but it is actually a trading strategy that works really well and is very repeatable. What if I told you that I have a strategy that often makes a 10% return in two weeks with a good probability of success, so good that I once had 26 winning trades in a row. Oh, and if things work out right the return could be much higher, although not likely.
I first learned about broken wing butterfly trades from TastyTrade. In fact, it is the favorite trade of two of their mid-day hosts, Nick Batista and Mike Butler. They use broken wing butterflies in a different way, which I found frustrating, and after experimenting, I came up with this very specific variation.
When I first explain this strategy to people they look at me like I’ve gone looney, and I get it- this is not a simple concept. So, let’s start by explaining what a butterfly is and what makes a broken wing. Then we’ll dig deeper from there.
The Regular Butterfly
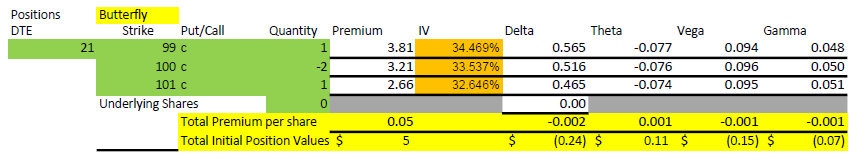
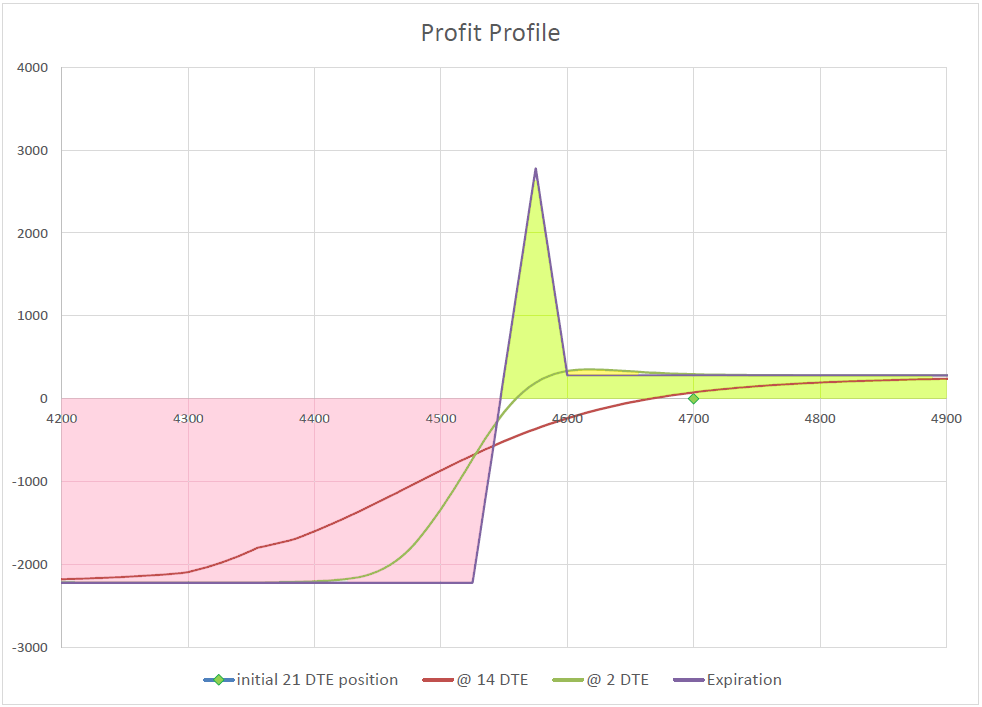
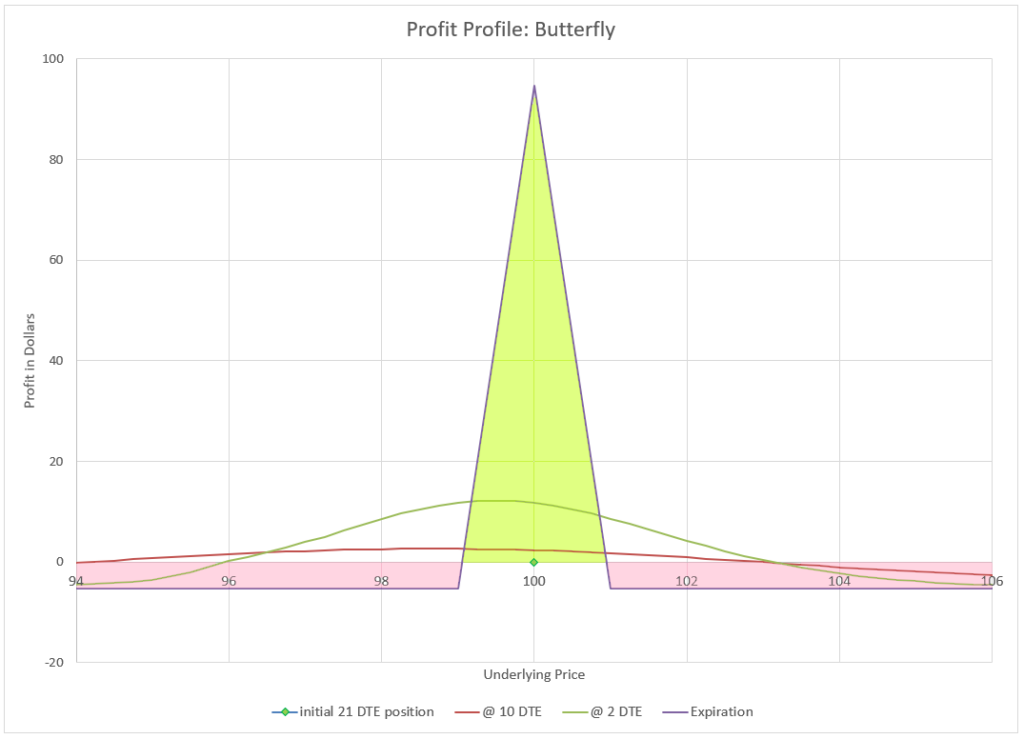
A butterfly is a three part option position that is made up of four contracts, two that are sold, and two that are bought. A true standard butterfly has two of the same contracts spaced equally between one contract above in strike price and one below. For example, we could sell two contracts at a strike price of 100, and buy a strike at 99 and one at 101. The 100 strikes would be the body of the butterfly, and the 99 and 101 would be the wings. This could be done with either puts or calls, it works either way. You may wonder why would anyone think this is a good trade? Well, since you buy two options and sell two options and the average strike price is exactly the same, the premium to buy this strategy is usually fairly small, maybe 2-5% of the width of the wings, or 2-5% of $1 wings in our example. So, for 5 cents you can own this position. It might be more or less depending on how many days until expiration, the current price of the underlying and the implied volatility, but generally the cost is small if there is some time until expiration. Now, if the underlying happens to close right at $100 on expiration day, it will be worth $1, a huge gain on 5 cents. However, the chance of that happening is slim. If the underlying closes between 99 and 101, the result will be positive, between 0 and $1.00, depending on how close to $100 the close is. See the profit at expiration chart. Most likely, the underlying ends outside of 99 and 101, and the premium spent is lost. It is kind of like putting a bet on a single number on the roulette wheel. It’s great if you win, but mostly a losing strategy.
One issue is that the profit from this trade doesn’t occur until right at expiration- until then the premiums tend to cancel each other out, and it is hard to get any profit early. A similar put/call combination trade is the iron butterfly, with credit put spread and a credit call spread with the same short strike. I learned early that these trades take forever to decay in value and are only good when you hit the short price right at expiration. So, I don’t like butterflies or iron butterflies, mainly because I don’t like expiration day drama and it is a low probability trade.
Introducing… the Broken Wing Butterfly!
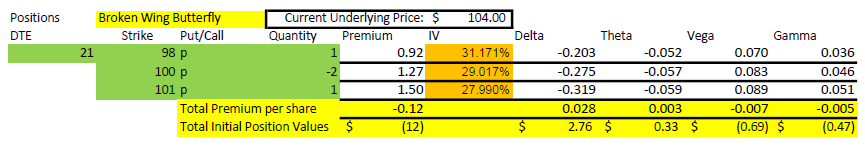
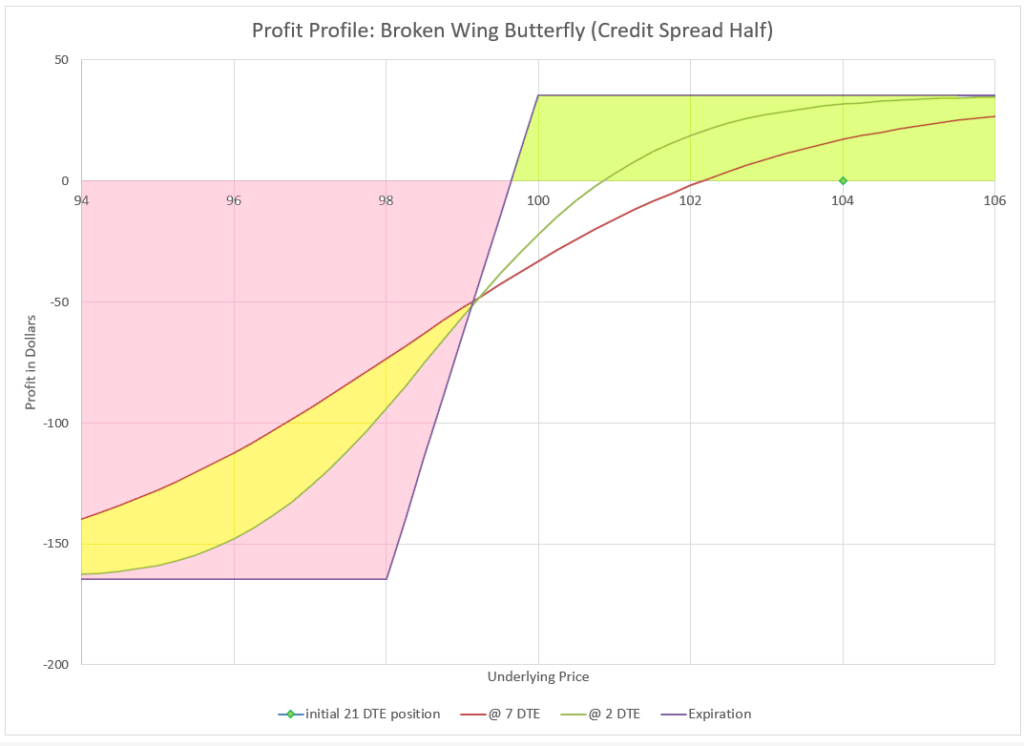
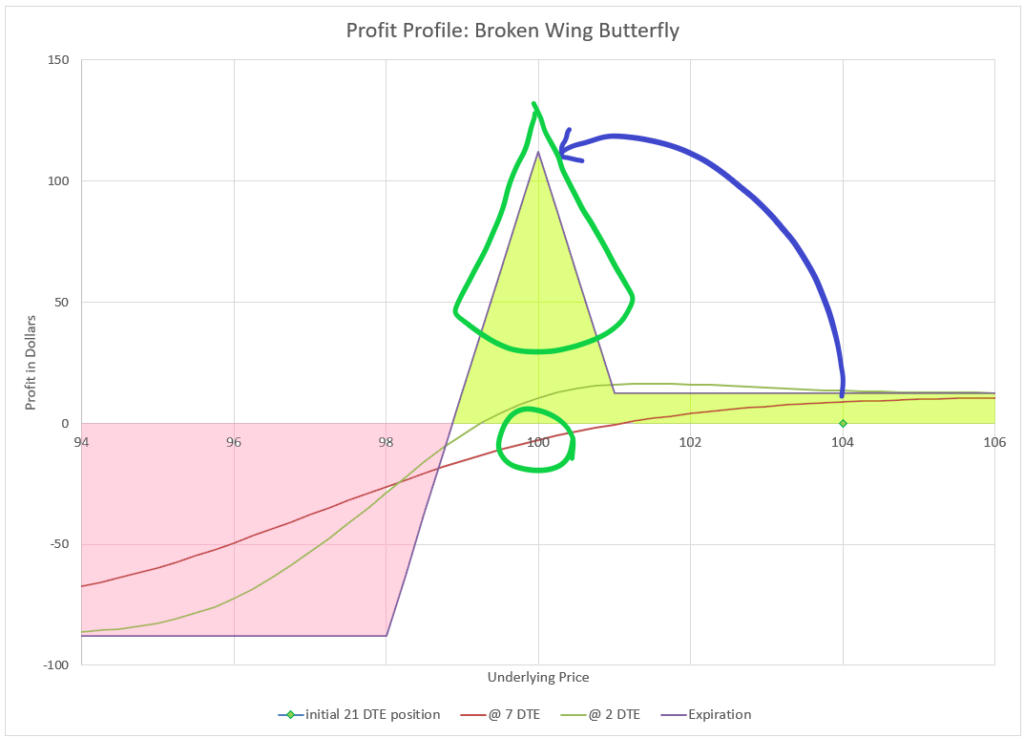
But, what if there was a way to collect a premium and take away one side of the risk completely and still have the possibility of a big return? Enter the broken wing butterfly. The way I trade this and TastyTrade recommends as well, is that instead of equal width wings, we buy the cheaper wing twice as far away from the body as the expensive wing. So, if our 99/100/101 example was a put butterfly, we’d instead buy a 98/100/101 broken wing put butterfly. We would sell two 100 strike puts and buy one 98 put and buy one 101 put. This change will move our transaction to a credit, a credit we can keep if the underlying expires above 99. And if we expire at 100, we can collect $1, regardless of what we collected when we entered the trade. The catch is that if the price expires below 98, we owe $1.
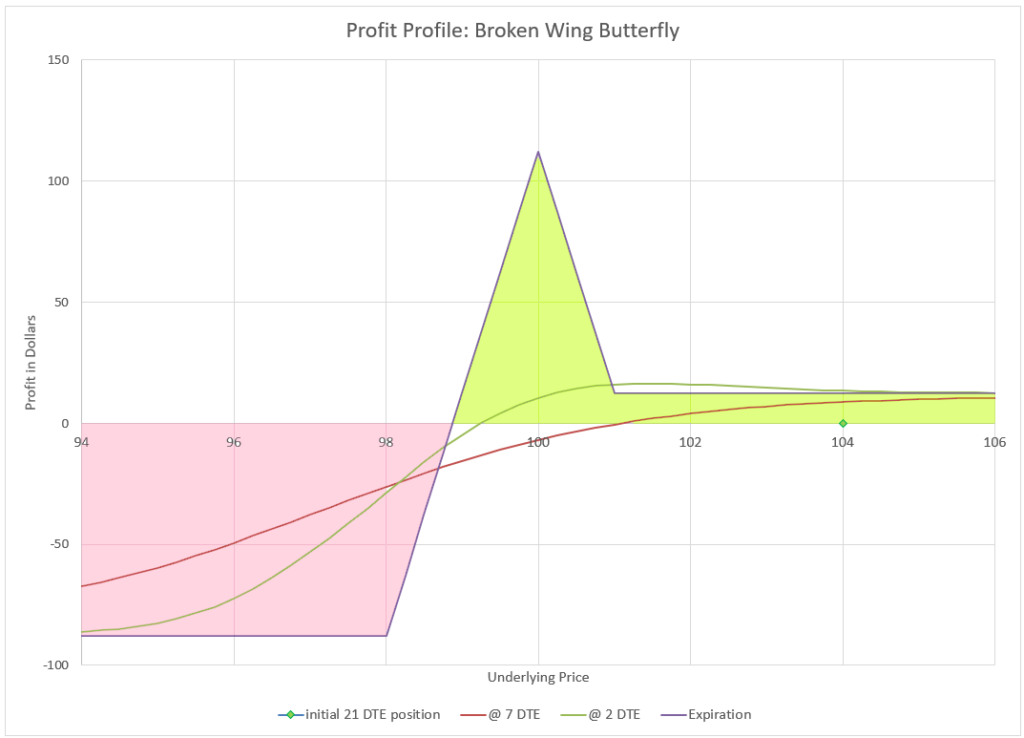
One way to think of a butterfly is to think of it as credit spread and a debit spread. Outside the wings, the two spreads cancel each other out at expiration if the wings are equal, and the smaller once cancels out half the larger one if the credit spread is twice as wide as the debit. If the spread ends out of the money, both spreads are worthless. The sweet spot is right at the body of the butterfly.

The folks on TastyTrade like to collect a premium on a broken wing butterfly and then look for an opportunity to roll the broken wing to a normal wing strike price for less than the premium they collected. With this, they then have a “free” butterfly that can not lose and could still make the max at expiration while consuming no capital. It’s a great idea, and it works, but I found it challenging to manage. To be able to roll for less than the credit received, the underlying has to move away from the wings quite a bit, making it unlikely that the strike will end up on the body at expiration. They equate it to getting a free lottery ticket. I often try to keep my premium and get out as quick as I can. And I’ve found a formula that works for me.
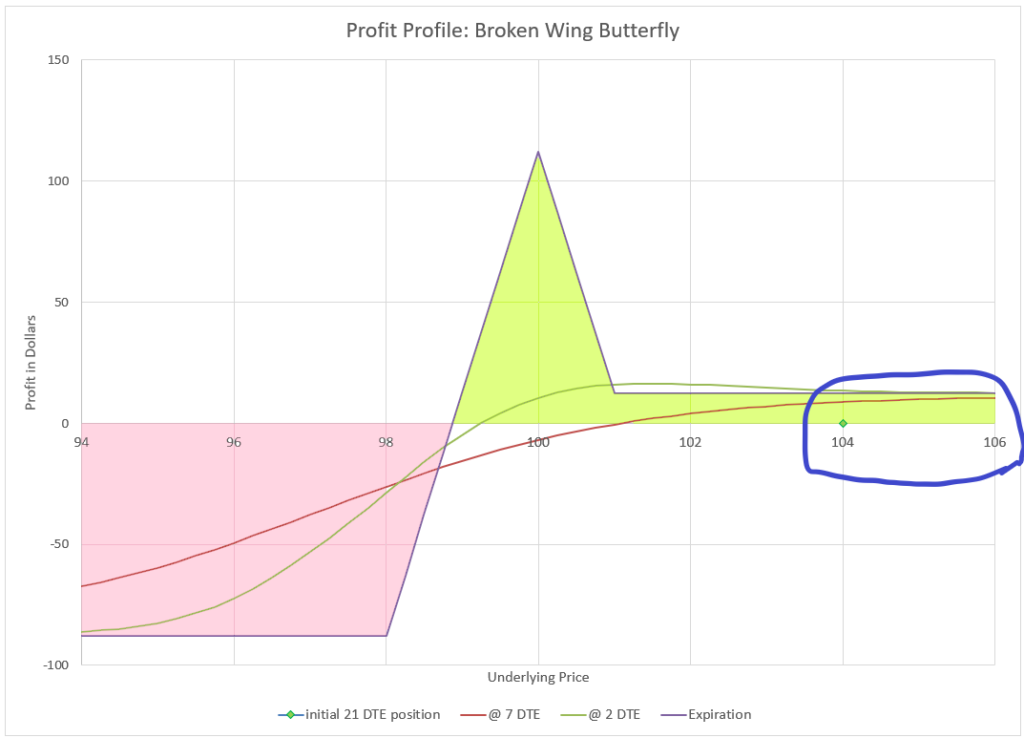
You may be able to guess from the title that the broken wing butterflies I trade are puts and I like them to have 21 days to expiration (DTE) when I enter. I also almost always trade the same Delta values at entry, 32/28/20. I also stick to index options or options on index funds. I will only enter a trade if I can collect 10% or more of the width of the narrow wing, but at this timeframe and delta, that is almost always the case. I then buy back the trade when it gets to a value of around 1.5-2% of the width of the narrow wing. Usually, this happens with around 7 DTE, if the market is flat or rising, and I have a 10% return on capital in two weeks.
This works a high percentage of the time, but not always. When the market goes down, I manage the position and hope for the price to land right at the strike price of the body, where I can make 100% on top of what I already collected. When the market really drops, I maneuver with a series of moves to try and get my money back, or I could owe up to 100% of the capital at risk. I’ll detail how I manage these drama scenarios in a bit, but first let’s break down why I chose each element of the trade to start with.
Why puts?
I mentioned at the top that butterflies could be created with puts or calls. I’ve tried this strategy with calls, and my success rate is much lower, with much more drama. I specifically use out of the money puts, because they are much more likely to expire worthless than out of the money calls. The market has a tendency to drift in a positive direction most of the time, and the times it goes negative are generally are infrequent and unpredictable. Additionally, the Delta values I use are specifically chosen for this combination of time to expiration, combined with puts and the use of equity indexes. Implied volatility skew changes these pricing and Theta decay relationships between puts and calls, so a broken-wing butterfly with calls is just different than with puts.
One over-arching option trading principle that I used to follow is to combine put risk with call risk. So, is there a similar strategy for calls that could take double advantage of the capital at risk, using the same spread width and timing? Maybe, but I haven’t found one that delivers a high probability of profit and lack of drama. I’m looking for one, modeling possibilities, and testing, but so far I am without repeatable success. When I find it, that strategy will be added as a combination. Until then, I happily trade this strategy, collecting a 10% return on capital in about two weeks.
The only call strategy that I’ve had success with is to sell a spread in the 11/6 Delta range with the same capital risk as the butterfly. I can collect another 5-10% on the same capital. However, some brokers mistakenly add this to buying power by pairing it with the twice as wide credit spread in the butterfly to make it an unbalanced Iron Condor. That defeats the purpose of double using capital for puts and calls.
Why 32/28/21?
When I tell people that I use strikes at 32 delta as the starting point, many think this is taking on a lot of unneeded risk. I get that, because under virtually any other circumstance, I avoid selling puts with deltas over 20. But by trial and error mostly, I’ve found that this level of delta provides rapid decay in this timeframe, and tends to be safe from testing the vast majority of the time.
When I first started trying this trade, I looked to just collect a positive premium, with hopes of collecting the 100% lottery payoff. Over time, I realized that the real win was keeping the premium collected up front, so I looked to maximize the premium without taking on a lot of risk. Initially, my goal was to find a combination that collected at least 10% of the width of the narrow spread. I’d click different strike combinations until I found something.
Eventually, I locked in on 32/28/21 delta. I don’t always do these deltas, because each time I trade, I have to use whatever is available at the time. So, I usually start by looking for a 32 delta strike if there is one. If not, I’ll take the next closest- the next lower delta if I have to pick between two different ones. Then I look for the 28 delta strike. I try to keep the width between these no more that 4 delta, so if I have to pick, I’ll take a width of three over five. The final strike is simply twice the distance away from the mid-strike as the upper strike. It usually works out to be around 21, but depending on how close the first two strikes are to 32 and 28, the lower strike delta can vary a bit.
I’ve found that at 21 days, these strikes consistently have a premium of well over 10% of the width of the upper spread. I get a bit more when Implied Volatility is higher, as it has been in 2020 and 2021 after Covid hit. If I pick slightly narrower width strikes, I collect more premium as a percentage than slightly wider strikes, although wider strikes collect more actual premium per contract- it just takes more buying power. So, I pick strikes generally around 32/28/21, which exactly is a choice at that point in time, trying to get the best value.
Keep in mind that the short strikes are the 28 delta strikes, and break-even is between the 28 and 21 delta strikes. So, if you use delta as a probability indicator, there is a 75% chance of the butterfly making money at expiration. However, my experience is that the trade has done much better than that probability.
Why 21 days?
Butterfly trades are notoriously slow to collapse in value. When I first started trading the broken wing butterfly, I traded much longer expirations, like 42-45 days, but I noticed that the value of the overall position didn’t really decay much. All the decay of the different parts cancelled each other out. However, when I held on after 21 days, the value started quickly collapsing. This is true as long as the price doesn’t drop much from when the position is opened- odds are over half the time. It seems that for these strikes, these are the magic timeframe.
I’ve looked at trying to explain this by analyzing the theta and delta of the combination, but theta decay doesn’t really explain the way the position drops, nor does delta. Delta is slightly positive, and as price moves away from the strikes, the position benefits.
Why a butterfly vs a simple spread?
After I started doing this specific trade for a while, I started thinking that it was kind of silly to have the complexity of a butterfly when I could collect the same premium percentage on a simple credit put spread at a lower delta. A put spread with deltas of around 20 and 17 will net about the same premium at 21 days as the 32/28/21 broken wing butterfly. The spread is simpler, lower delta, so I expected it would work as well or better.
However, when I did a series of trades with the exact same premium at the same width of spread, a funny thing happened. The butterflies decayed faster. After doing this several times, I decided it wasn’t a fluke. The unique relationship of the different legs causes the value to evaporate faster for winning trades. So, I went back to trading broken wing butterflies exclusively in this timeframe.
Why target 2% at 7 days?
I target buying back at 2% with 7 days left for a couple of reasons. First, it seems to work almost like clockwork. I put in a good until cancelled order to close for 2% of the width as soon as I open the position. Then, most of the time, I find the order executes with either 7 or 8 days remaining. At that point, there isn’t much premium left to decay, and the buying power is best used on another position. In our example trade, I started with 12% premium compared to risk, so if I close at 2%, I would keep 10%, which is pretty awesome return for being in a trade for just two weeks.
I could get out earlier at a lower profit, but I see the decay really keep going in days 7-10, so it makes sense to get the most reasonable possible once decay starts. It tends to work out to about 5% each week, and with only 2% left for the last week, it makes sense to start a new position to get 5% the next week instead of 2%.
Why options on indexes vs stock options?
Stocks tend to have more tail risk, or make big moves beyond what is expected compared to indexes. While indexes can move down large amounts, they do it less often than individual stocks. Indexes don’t have earnings risk, and news impacts indexes less than a story about an individual company.
Many people like to trade options on individual stocks because they often have higher volatility and more premium per option. However, in spreads this advantage is much less, as both the short and long strike have increased premium, greatly cancelling the benefit. In the end there isn’t much additional premium, but a lot of increased risk of outsized moves. So, for this strategy, boring moving indexes are best.
What if the position is tested?
So far, I’ve talked up all the benefits of the trade and the positive outcomes. The trade wins the vast majority of the time from my experience, but not always. So, what is the plan when the index goes down and tests or breaks through the breakeven point?
Close for loss?
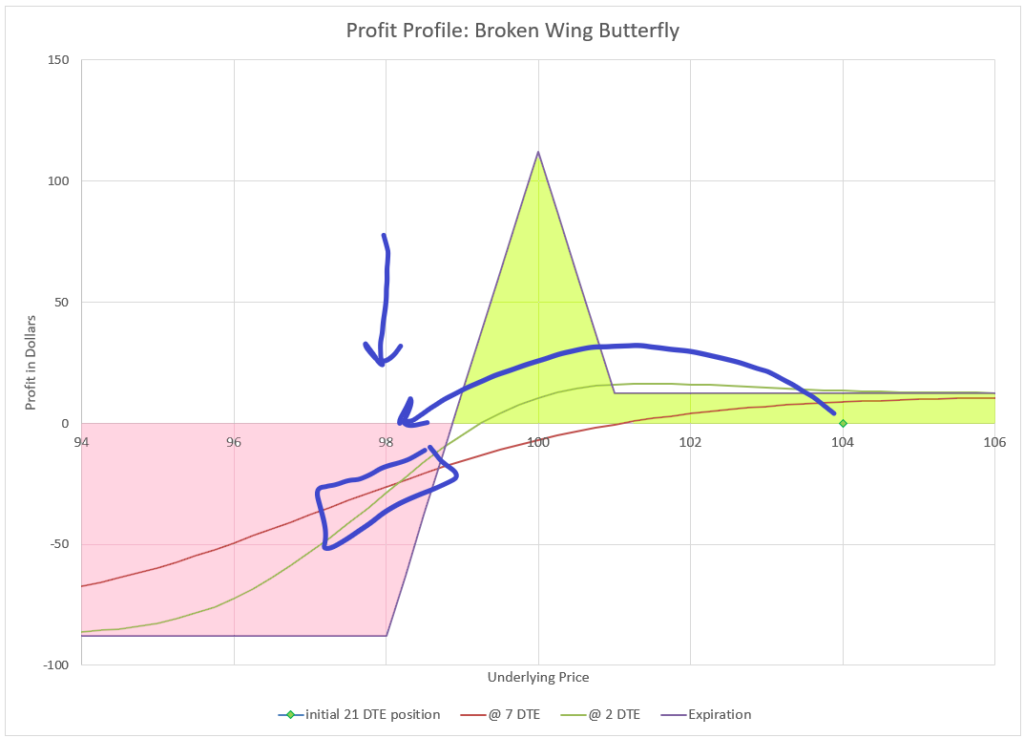
The quick answer is to simply close the spread and take a loss. The butterfly structure helps keep the loss reasonable as the price moves through the strikes. Until the last few days before expiration, you can get out without a lot of damage. For example, when the price goes below the mid-strike with more than 3 days left, the premium is about 30% of the width. Closing would be losing likely 15% (30% minus the 15% you collected initially). Or, if you wait for the lower strike to be breached, the premium will be around 40% of the width until the final few days. The loss would still be under twice the premium collected in most cases. Just set a stop loss at a point where you are okay getting out.
But, do you really want to close? The probability of touching the break-even point of half-way between the mid and lower strike is about 50% before expiration, based on that point having an initial delta of 25. And 50% of those touches will end up profitable. If you put on a stop loss, you may often find yourself stopped out right before the position turns around and profits. Still, when you are starting out, I’d suggest getting out if the lower strike is breached, saving well over half your capital for another day.
Roll the losing side?
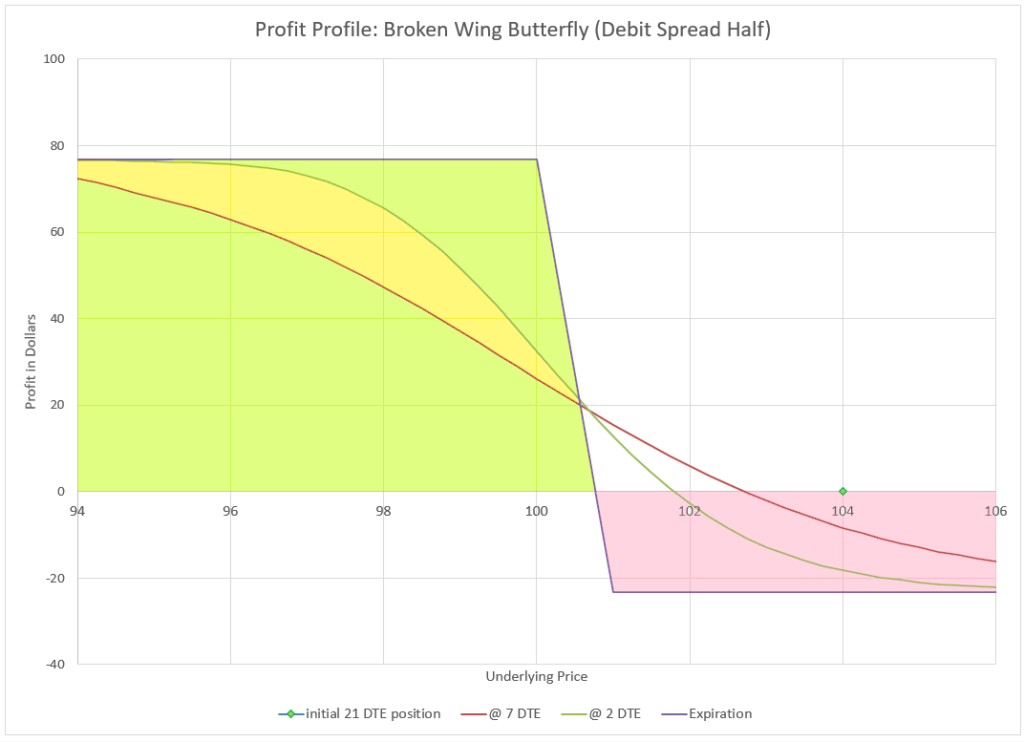
Alternatively, you can split the butterfly into two spreads and manage them separately. The upper spread is a debit spread, and when tested, it will have a positive value. The lower, wider spread is a credit spread that loses money when tested. The upper debit spread will be more in the money and hedge the wider spread for much of the price decline. A potential action is to sell the debit spread collecting a big premium and roll the wider credit spread to a later expiration, and wait for the market to turn around and reward you. The debit spread will have over 50% of its width as premium when the mid strike is breached, and the credit spread could be rolled to a later date for a credit if the price hasn’t dropped too far, but if a debit roll is required, the part of the proceeds of the sale of the debit spread can be used to pay the debit required for the roll.

Once the credit spread is rolled, it can be paired with a call spread and create an iron condor, or be used in a number of ways. The big watch out is that since the credit spread is twice as wide, it requires twice the buying power to maintain going forward. If the price recovers, the credit spread can be bought back for less than the debit spread was sold for.
Why/how does the buying power requirement double? It may not be obvious, but in our example, initially the max loss is $100. The debit side is $1.00 wide and the credit side is $2.00 wide. If the market drops below the strikes at expiration, the debit side will be positive $100 in value, the credit side will be a negative $200, and the net will be the difference, which is negative $100. So, let’s say I sell the debit spread for $60, and roll the credit spread out for a $30 debit, my cost basis would go from $12 credit to $42 credit, while my capital at risk would go from $100 to $200, because I now only have a credit spread. In addition, the new position will require a big move up to get to our new breakeven premium value of $42. There’s a lot of moving parts in this close and roll, and it takes some study to see what has happened.
Or hold for a shot at the big win?
Finally, there is a third option, turning a potential loss into a big win. At expiration, if the price lands at the mid strike the debit spread is maximum profit at 100% of its width, and the credit spread is worthless. So, a trader could collect 10-15% of the width when opening the trade and then collect another 100% of the width at expiration. Unfortunately, the odds of this happening are really small. But, there is a decent possibility of the butterfly having a positive balance on expiration day- if the underlying index price is close to the short mid-strikes. So, it is possible to close a tested butterfly for a credit on expiration day, maybe even a day before. You could actually collect a credit to open and a credit to close!
So, what to do? It all depends on time and how convinced a trader is that the market will bounce back. Was there some big event that temporarily scared the market, or is the market trending down with no end in sight? I try not to predict where the market is headed, because generally I don’t know. But some people use technical analysis to help them decide how strong moves are and the likelihood of a reversal. If a reversal is coming and there is time, then it makes sense to let the position ride. Three weeks is actually a long time if the market moves against a position, so a snap decision isn’t critical, but an overall strategy is.
My plan is that if the market moves strongly down and through all my strikes, I close the position and move on. If it slowly drifts down, and goes through the mid-point while there is more than 7 days, I look to sell the debit side and collect as much as I can, and then roll out at least a week on the credit side and either collect additional premium or roll down a strike if possible.
If I reach 7 days and the price is sitting near the upper strike, I keep the trade on until either the price moves up far enough that I have a profit, or it drops below the bottom strike and I close. Otherwise, I hold on and wait to see if I can collect premium when the butterfly switches to positive premium. This means there are a few tense days waiting in an in between zone. At 2-3 days left, the lowest strike starts to have very little premium if the price is at or above the mid-strikes, and the butterfly can show a small positive value when price hits the mid-strikes. As expiration approaches, the amount of potential positive value increases. In these situations, I put in an order to collect a credit, perhaps 10% of the width of the upper spread with 3 days to go, and bump it up to 20% for the last two days. If I still have the position by mid-day of expiration day, I look for a reasonable exit position. While I could hold all the way to expiration, I’d rather control what I collect and avoid a late day move that turns a reasonable profit into a large loss.
Fortunately or unfortunately depending on your perspective, I’ve only been in a position on expiration day a few times. My goal with this trade is low drama and low maintenance, and not to try to hit the elusive 100% profit strike. The last time I had a position on expiration day, I closed by collecting an additional 10%, so I made around 22% in three weeks. On that day the price movement didn’t look like it was headed for the point of maximum profit, so I closed when the credit opportunity was available.
The most I’ve made on one of these trades is when I closed the narrow side for a 70% credit, and bought back the wide side several days later after rolling for 30% of the narrow width, meaning a net closing credit of 40%, in addition to the 12% initial credit I collected to open the position. When things go wrong, there is actually the most potential for the most profit.
The thing that gives me confidence when the position gets tested is that the market has a positive bias. Over time the most likely direction for the market is to go up. If I stay patient, more often than not, the market will reward my patience. It also helps that this is a defined risk trade- I know my maximum loss when I start, so in many situations I’m willing to hold on waiting for a turn-around. If I end up with an in the money credit spread, I can collect money from an equal width call spread to finance rolls until I get out.
The “free” butterfly
There is one more unique choice for managing a winning broken wing butterfly. Instead of buying back the whole butterfly when the profit has been made before expiration, the bottom strike could be moved up to an equal distance away from the mid strike for a small debit. So, in our example, we would move the short 98 strike up to 99. The result is that the position is now a regular butterfly, like the one we reviewed at the beginning of this discussion.
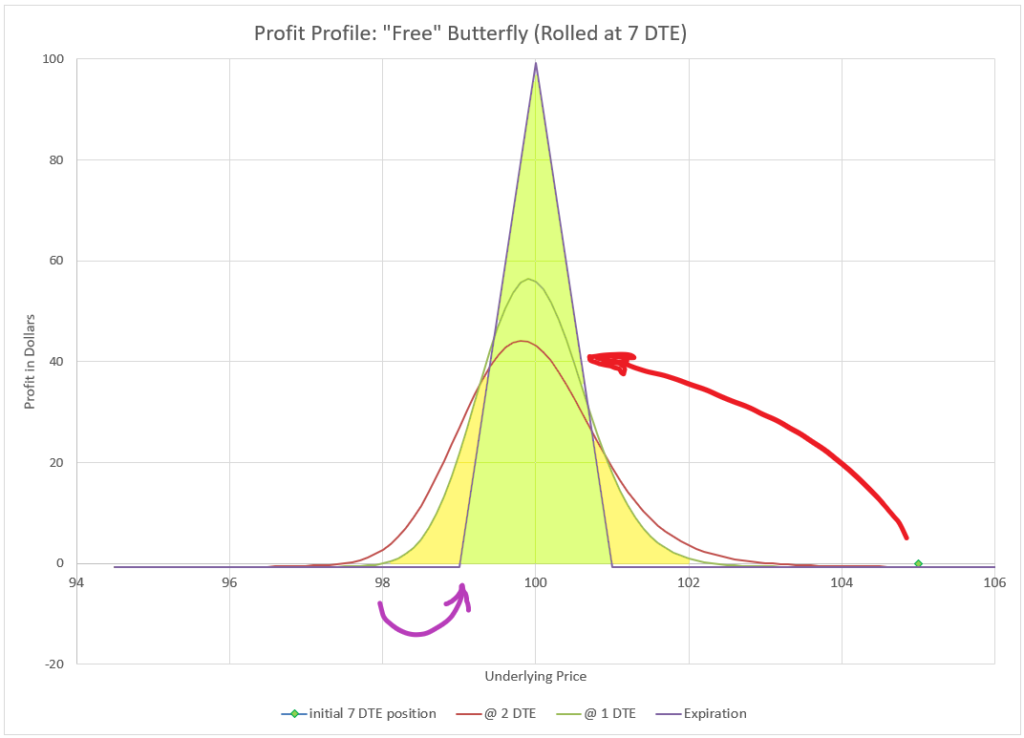
The advantages of this approach are that:
1. All risk is removed from the position.
2.The position has a slight posibility of making a very large 100% additional profit.
3. If the broker charges a fee to close each contract, it is cheaper in fees to roll up one contract than to close all four contracts.
4. Sometimes it is easier to get an order filled to roll the lower strike than to get an order filled to close all the positions at once.
It typically costs a little more to roll up the lower strike to create a free butterfly than to close the whole thing, but usually not much more. Another consideration is that for this roll-up to make sense, the price of the underlying asset will have gone up, so the probability of it dropping back to a profit at expiration is very low. But there is a possibility, so I think of it as a lottery ticket. I’ve done this a number of times with this trade, and have never hit the “lottery” with a fall back to the profit area of the butterfly. Maybe someday.
Final thoughts
There are many ways to set up butterflies and broken wing butterflies. The methods I describe here are in line with my philosophy of trading and risk/reward expectations. Many people trade butterflies aggressively aiming for the big reward, but I’m more excited about the rapid decay when the price is away from the strikes.
I’ve been very successful with this trade, and made a 500% return in a year in one account only trading this strategy. I wrote a post on this experience that you can refer to. However, I was using most of the capital in the account, compounding my winnings, leaving myself without a lot of wiggle room. Losses can be quick in this trade when the market turns against me, and rolling requires doubling up on capital to stay in the trade. While I was able to recover every one of these positions, many times it looks weeks or even months of rolling to get out whole, tying up capital along the way. So, someone trading this strategy has to be prepared for situations where a loss can occur and have a plan of defense. I’ve explained my logic for stop, roll, or hold, but it is emotionally hard to maintain a position that is showing a loss of 50% or more of the capital at risk. I’ve learned that if I plan to roll losers, I must have plenty of capital on the sideline to add when the debit side is closed and the capital requirement doubles.
Most of the time, this trade is just easy money, but the tested positions can get very dicey especially when trying to hit the mid-strike. So, I’ve lately used the broken wing butterfly more when the market is down, and use a slightly different version, the broken wing put condor, when the market is at highs. And in true bear markets, I often use the 1-1-2-2 put ratio trade for more protection.
Of all the trades I do, this one is the hardest to explain, even to experienced option traders. So, this is one of the last trades I suggest to new option traders. Don’t feel bad if it doesn’t make sense at first. My suggestion to someone considering this trade is to set up a one contract trade and use a stop loss to prevent a big loss. After seeing how the trade works a few times, consider other management techniques.
Ideally, I open this trade on a Friday with 21 days left to expiration. Then, I close it two weeks later with 7 days left to expiration and open a new position immediately with 21 days left. It isn’t exactly continuous rolling like many of my other strategies, but the idea is the same- to profit continuously from time decay. For me, this just works.
For additional explanation, see my post with a video made in 2025 about this trade.
You write very well. It would have been even better if you had used some more examples explaining how you manage losers.
Do you have alert service? I would not mind paying you for executing with me.
Adjustment after a week 1 if it is going away is the key I guess. Bwb gives an edge and adjustments ( if market goes up or down after 1 week) makes it sure way.
There is no alert service. The whole point of this site is to help people to learn to make trading decisions for themselves.
I love this strategy myself as well.
I have developed a scanner and alert tool for this specific case and wrote an article about it.
https://www.ninjaspread.com/flat-spx-broken-wing-put-butterfly/
Little confused on your tp, sold one for $43 credit on xsp, what would be your tp… great site by the way 👍
Darren- Thanks for the kind words.
These days, I typically try to sell for about 10-15% of the risk/buying power required and try to close for 2%. So, if I sold an XSP BWB 3×6 ($3 risk), I’d want to sell for 0.30-0.45. I don’t know if this is the trade you put on, but since you collected $43, that sounds like 0.43 per unit. So, in total money that’s likely $43 sold against $300 risk. I’d want to buy back for 0.06/unit or $6. If I opened at 21 DTE, I’d like to be out by 7 DTE.
To be clear, when I say 3×6, that’s a debit spread of 3 and a credit spread of 6 wide, say +389 / -2×386 / +380, or something like that.
Can you explain what you mean by “close for 2%” of the width? I see we take our premium credit divided by the max loss, which should equal 10% or more of the width of the narrow wing. By “narrow wing” does that mean the upper strike minus the lower strike (101-98) or the width of profit at B/E at expiration? (B/E looks like about 98.5 at expiration). So if premium credit is 12% (credit-max loss) for example, and you buy back 2%, you keep 10%…I’m confused by what that means…how do you “buy back” 2%? I’ll try re-reading but hoping you can tell me percent of what.
Good question. The numbers and concepts can be a bit confusing. Let’s take an example to illustrate the math.
Let’s say we open with a broken wing butterfly in SPX with strikes of selling 2 put contracts of 3950, and buying a contract each of 3975 and 3900. So, there’s 25 points between the upper long strike and the short mid strikes, and 50 points between the mid strikes and the lower long strike. Some would say this is a 25×50 wide broken wing butterfly. So where is the risk in this trade?- At expiration the position is in the money below 3925, so we have 25 points at risk- we could lose up to $2500 less our premium collected. So, when I refer to the width of the trade, in a broken wing butterfly, I’m really interested in what the risk width is. It’s a bit of a carryover from simple spreads, and honestly a bit lazy on my part, because there are two widths- the width of the long spread (25) and the width of the short spread (50). The risk is the difference in the widths. Since my typical trades have the short side twice as long as the long side, it’s fairly easy to come up with a width that represents the potential losing side of the trade. So in this case, I’m saying the width is 25.
So, to collect 12% of the width, we’d want to get $3.00 premium, which assuming the strikes are around our target Delta values, we should be able to achieve. Remember, we choose the strikes that meet our targets and we decide when to enter- nothing forces us to take less or enter at a time we don’t want to.
The goal of closing for 2% of the width would mean that we would buy back all four option contracts for a net 2% of the 25 width, or $0.50. So, we want the position that we collected $3.00 with 21 days to expiration to decay to $0.50 by 7 days to expiration. Our profit would be $2.50 in premium, or $250 for the contract, which is 10% of the 25 width, or the $2500 risk.
Technically, we only have $2200 at risk because we collected $300 at the start of the trade and if the end value was a debit of $2500, we would still have the $300 we started with, so a net loss of $2200. But for short hand calculations, I still find it more useful to look at the width of the risk separate from the premium I collect for quick back of the envelope analysis when entering and exiting. So, if you hit the targets, your true return is $250 on $2200 risk, or 11.36%- it’s actually better! But I needed a calculator because I couldn’t do that math in my head. My shorthand calculation underestimates the upside slightly and overestimates the downside percentages. The difference in this case is fairly small, and for me it’s close enough for thinking through the mechanics of the trade.
I hope that answers your question. It gets a bit complicated, and often it often helps to make some simplifying assumptions that make the math easy. With a background in engineering, formulas can be overwhelming, and it is often useful to use rules of thumb that get an answer that is close enough when precision isn’t critical. In this case, it’s a concept- every trade is slightly different and you aim to get as close as possible to your targets, following a plan.
Hi Carl,
How much of the capital in a given portfolio do you typically use for this position – do you keep any cash in reserve for rolling/defending the credit spread?
Thanks for publishing this – I have always wanted to find a way to employ the Tastyworks butterfly but never found a “battleplan” I liked. Great read.
Thanks,
Bryan
Bryan- Thanks for the nice comments.
You bring up a great point on maintaining a cash reserve. While this is a high probability trade with defined risk, it also can lose a lot on occasion. We don’t know when those occasions will be, so we always have to be prepared. How much to set aside partially depends on how much portfolio volatility a trader can tolerate on a percentage basis, but also on the diversification of strategy and underlying securities. For the broken wing butterfly, a big consideration is management strategy for tested positions, and the capital implications. Cash reserves have to be in place to account for worst-case scenarios.
If a trader stops out a position when tested, the loss is limited to the amount set by the stop. The account has that amount less capital for the next trade. Many traders look at situations like this and back-test to look for the maximum drawdown to determine how much capital might be needed in bad times.
If a trader wants to roll a tested broken wing butterfly into a spread, the capital required approximately doubles for the trade. For example, a 25×50 wide BWBF in SPX would require $2500 minus credit received in capital, but when rolled to a 50 wide spread, it would require $5000 capital minus the credits received. So, the capital requirements can expand quickly. If an account were doing the trade exclusively, having less than 50% cash reserves is a ticking time-bomb. And that doesn’t take into consideration the maximum drawdown impact if the rolls don’t recover, or losses pile up one after another.
This is why most people try to keep 50% or more of their options capital in cash reserves. These days with short-term interest rates of 5%, we don’t need the cash to be just cash, but it can be in interest bearing cash funds that can easily be accessed in a day or less. I recently realized I had way too much cash sitting in my account not getting interest and bought no commission 5% funds that compound daily.
The higher up the risk ladder we go, the more important it is to have cash available to provide stability and buying power in a crisis. The big irony is that the time you need to be hanging onto cash the most is when everything looks great and volatility is low. Volatility spikes can really do a number on positions that are based on net short option trades. So, it makes sense to up your cash when the market is quiet, and get more active when the market is in chaos. That goes against our emotions, but all studies show that particularly for options, this is the best path for hanging onto your capital over time.
The only exception is covered option trades with covered calls and cash secured puts. These have less volatility than stock alone, so we can treat cash reserves like we would for an all stock portfolio. The cash for cash secured puts is a forced reserve, so it really isn’t extra cash from my perspective.
Long term success in the market isn’t about how much you make in good trades, but much more so about how well you can preserve capital when the losses come.
Great article, thanks for all the detail. I really like a lot of Tasty’s approaches, but not this one. I’m not crazy about the free butterfly approach, or their wanting to enter these at 45 DTE. I’ve also recently been trying putting on broken wing butterflies at around 7-10 DTE, collecting a lower credit and playing at a small shot of getting close to max profit, but that’s been inconsistent at best. It ends up being either too small an initial credit, or so close to the money that there’s a decent chance of going through all the strikes for a max loss.
I also appreciate your thoughts on sticking with puts and indices, along with the 21 DTE. I’ll be trying this for sure, thanks!
This post is awesome. When u say 32/28/20, do u mean for example selling the (2) put at 28 delta, and buying each of the put at 32 delta & 20 delta respectively? Or u meant something else? I might have misunderstood…
Thanks for the kind remarks. Yes, buy the 32 and 20 Delta puts and sell two of the 28 Delta puts. You got it!
I’m curious Allen, have u tried it on the IWM or RUT or QQQ? Does this 21 Day Broken Wind Butterfly work well on those too?
Good question. There’s a trade-off with RUT and QQQ. There is more Implied Volatility and more premium which is good. The products are lower priced, except if you use NDX for your Nasdaq 100 options. But that higher IV is because they move a lot more than the S&P 500. In a bull market, all of these things can be great, but in a choppy or bear market, a broken wing butterfly can go into the money more quickly and unpredictably- at least that’s my experience. But trading all three provides some diversification to different parts of the market, as long as you realize that they are all market indexes that have a fairly high level of correlation, and when the market goes down, they all go down.
Have you tried doing this on mini’s? I’d have to assume there’s not a lot of difference? or is that not the case? Very cool writeup.
Sure, you can do this on /ES, but brokers won’t generally allow three legged orders on futures options, so the order has to be made in two parts. Also, you can’t set a limit order to close all three legs, so only a limit order to move to a equal wing butterfly would work to take off risk early. You’ll get some span margin relief on buying power, but this is defined risk to start with and so buying power is mostly defined to start with.
You can also trade XSP or /MES, but watch trade costs and liquidity.
Also, are you still using this method? Has it been successful over time?
I still use this method and it works well most of the time. The only time it has issues is in down markets. As I write this, we’ve had a bit of a decline in the markets over the past few weeks and I had to do a defensive roll on a couple of these trades that were nearing expiration with the short strikes in trouble. But since these positions are a small portion of the account, I have capital to work with and the impact is small on my total account.
One big watchout to remember is that to roll down and out on the credit side when closing the debit side is that more capital is required. So, a trader can’t have all capital tied up in this trade, or a downturn could wipe out an account quickly. A total loss is very possible in a steep downturn, so this is not a trade to put all the eggs in one basket.
This trade can go for months and months without a single loss, and then have a situation that wipes out everything earned.
I often add positions on days when the market is down and volatility is up to have more room for future downturns. It seems like the trades that get tested most were those that were opened on days when the market was trading near an all-time high.
Fantastic. I’ve been reading a lot of your posts on this site and got into TastyTrade which is significantly more user friendly than Etrade for these because I can set the profit target and stop losses automatically. I’m curious how often you’re putting these trades in action? With the BWB and the Broken wing Condor (not quite ready for the 1122) are you liking to put in one of those (BWB or BWC) on every Friday if it looks right? Are you adding some midweek? Do you ever put a BWB and a BWC on at the same time?
I generally try to add a BWB position each week. I try to wait for a down day and then pick the Friday closest to 21 days. Lately, I’ve been using mostly BWB in SPX with 20 x 40 wings, collecting a little over $2.00 premium with a closing target of $0.35. I could probably have used BWC more in the last few months with the market so high, but hindsight is 20/20.
On times trading all time high like as of todays current trend. Would a call broken wing butterfly be better as there’s resistance at 585 right now?
Skew simply doesn’t favor Call broken wing butterflies. But, you can do whatever you want.
Thanks for this article really helpful, with clear and concise information.
I have been following your guidance with success and some failures. Today I noticed Bracket Orders and wondered if you had used them to set up your BWB Trades. It would be interesting to understand any considerations you may apply to Bracketed Orders for BWB’s.
Hope you can help
Chris- thanks for the kind words. I haven’t used bracket orders, but it seems like a good way to set up and manage the trade.
Just set your profit target for closing as well as a stop loss, if that’s the way you want to do it.
Hey There!
I’m in a trading group that uses a lot of the 11-X trades mainly on futures. after getting beat up pretty bad on 8/5 many are considering more risk defined trades, hence the BWB on RUT. One of the mentors in the group has said that this trade has been working well, slightly different management style but same concept. I’m curious, were you running this strategy to scale on 8/5? How did it fare for you? My understanding is that others took about a 50% hit, but in your case if you rolled the trade you likely bounced back pretty quickly? Thanks for the thorough post. Very excited to add this to my arsenal.
Eric- Thanks for the kind words.
Yes, lots of people took big hits in 11-X trades on 8/5/24. I’m working on a write-up on that event and the implications. I added an addendum to one of my write-ups, but more to come.
I didn’t have many BWB trades on during 8/5, and they were the least of my worries. I either held or rolled them and came out fine. If I had more of them, I might have been in a different situation and been forced to liquidate. But, since these are defined risk, there’s nothing that forces a trader to get out during a sudden downturn.
Hello,
I have found your nicely written article after searching for more information on put broken wing butterflies. For similar reasons as you I arrived at these as a very practical strategy. I will disclaim not having done the math yet however my mind goes to improving this strategy by moving the upper or even both purchased put expirations out. My reasoning is twofold. First, you should effectively pay less for decay; second should the underlying value plummet, the increase in IV should provide a bias of value towards your long put positions. In the game of high win percentages I find this adaptation could be highly advantageous especially for enabling a higher volatility (read: pay out) play for the same risk.
Just came across your blog and love your BWB article, very detailed and well structure. Still finding time to read all your articles as I venture to option trading world 🙂
Clarifications on the BWB, any particular reason to do on Friday? For time decay? What is your experience on BWB trades in Sep, which mostly a down month. Thanks!
Don-
Thanks for the kind words.
September has not been kind to any type of bullish trade, including this one. If a trader chose to avoid September positions based on historical precedent, I would understand.
Hi! This seems like the perfect strategy. I was actually thinking of doing something similar at 7dte. After some backtests the results were impressive. I want to know if you’re still doing this and the broken wing condor. If so, would you mind if I ask how it performed in 2024? Would you trade this with a 2k account?
Thanks for the kind words. I haven’t traded this strategy consistently this year, so I don’t have any results to share. The watchout with shorter duration is that the strikes need to be closer to the money, and IV tends to be a little lower at 7 DTE than 21 DTE. But the decay is fast. Every choice is a trade-off- the key is to understand the trade-off and determine if which side is best for you.
Thank you for your response. Would you mind if I ask which strategy have you been trading recently?
I’m personally trading a variety of the strategies mentioned on the site. I tend to have a few credit put spreads, a few broken wing butterflies, a few 111 trades, and I’m currently trading a “new” strategy that I’m gathering data for a write-up on diagonal spreads. I call it the “Daily Diagonal,” where I roll a short put near expiration every day, while hedging it with a much longer duration put. I hope to have a series of write-ups on variations of the strategy soon.
Carl,
I would love to make a video about this strategy for Theta Profits. Are you up for it?
John Einar
Sounds great. Let’s do it!
Hi, and many thanks for sharing your BWB strategy. My question is, for those of us newbies that want to use a stop loss, what percentage stop loss do you use (i.e. how do you determine your stop loss)? Thanks
Most traders look at closing at 2-3x the initial credit received. For example, if you collected 2.50 credit to enter, the stop loss would be 5.00 to 7.50, which is actually a 2.50-5.00 loss. The closer the stop loss is to your entry price, the more likely it is to be triggered, but the less you lose on a single trade. I tend to want to give the trade more time to work out, so I prefer stops to the bigger side of the range, but some may not be comfortable with that risk. So, in the end it is a personal choice.
Thank you
Saw your interview on this strategy. You mentioned that these days you just use a stoploss because some times it didn’t work out all too well with, I imagine, keeping the spread. You also said that with a 2x stoploss(=3 x initial credit) the profit probability goes from 80% to 70%, so 70% of the time that would be 0.83x (10% / 12%, leaving 2%) profit and 30% of the time would be losing 2x.
0,83 * .7 = +0.581
2,00 * .3 = -0.60
Does not seem to be working out too well, what I’m I missing here?
Not every trade is max win or max loss- it isn’t either/or. Many end up in between.
I also spoke without having the data, which is clearly not data driven. Over longer periods, the stop loss at 2x doesn’t impact win rate quite that much, and wins with and without are somewhat higher than I quoted. The stop loss does lower win rate, but can improve total profits because it cuts off the worst losses. How much profit and exact win rates depend a lot on what time periods you analyze this trade over.
If you look at the last year, and especially if you do any data set that includes the crazy late summer of 2024 and April of 2025, the numbers are more like your calculations, we’ve had lower win rates overall compared to longer datasets. We have seen big sudden drops with more frequency.
This trade does really well in slow steady up markets. It can also perform well when entering when the market is down compared to recent levels, essentially buying dips. But any position will lose when the market drops several percentage points within a few days of entry, which has happened more often lately.
Please pardon my ignorance, as I am just learning options. With reference to Dave’s post, my understanding of this stretegy is you aim for 10% of the narrow width. So, if the narrow width, for example is 30 wide, that would be $3, which is $3.60 (12% of the narrow width credit collected minus $0.60 (2% of the narrow width you close the spread for). And your stop is twice the credit collected, which will be $7.20, but you lacually ose $3.60 ($7.20 – $3.60 credit collected). So 70% win rate results in 3 x 0.7 = 2.1. 30% loss rate results in 3.6 x 0.3 = 1.08. Am I missing something, or is my understanding/interpreatation completely out of whack?
The stop is 2x the credit received on top of the credit received, so in your example the 2x stop would be $10.80. $7.20 is $3.60 more than the credit received or 1x the credit received. The wording and notation can be confusing. When people write about these stops, read what they are saying carefully, as it is easy to confuse which one is which. There are probably better ways to word it that are less confusing.
Hello – thanks for your site its great. When I go to enter this trade in ThinkorSwim I have to do a multi leg trade. I select the 2 short puts first, and then the 1 lower side long put and it stays red in TOS meaning I will get a credit. As soon as I set the higher side long put it changes to green and shows a negative debit such as $-3.45. Is this correct? Is there something I am doing wrong? Thanks again.
Here’s what I see:

Thanks for all you are doing here.
Exactly and I figured it out also with help of the Chat Support in TOS. One thing they have not been able to help me with is the setting the Stop Loss. Trade on SPX the BWB 21 DTE. I go in a set stop loss at 3x the credit received (example received $3.00 credit so Stop Loss is $9.00) on the entire Butterfly. Within the same day, or the next day or two, the trade stops out but at a much different price than $9. Sometimes it was even at a small profit. TOS rep said its because SPX moves so quickly they cannot really figure out why this is happening other than the wild swings that come with SPX.
Have you run into this? If yes how are you setting your stop loss? If not could you send a screen shot of a stop loss you are going to enter or would enter so I can make sure I am doing it correctly (TOS rep tells me I am absolutely doing it correctly)?
I could also set it to trigger on the 2 shorts and then auto close the longs if the shorts are stopped out. But how do I figure out what price to set the stop on the shorts?
Thanks again.
This may be an unpopular opinion, but I really don’t like Think-or-swim. I find that it often won’t allow me to enter or modify option trades in the ways that I want to. This is especially true for multi leg option trades. However, I’ve found that I can often enter the same trade using the Schwab.com website basic interface. For some reason it seems to allow a wider variety of option trades to be entered. I’d try that.
Thank you again for doing all of this for everyone. So I can enter the stop loss in TOS that isn’t difficult. It just then triggers wrongly … so do you enter the stop loss n Schwab.com for the entire butterfly and don not have that issue? I have no problem doing that if that is the case. Thanks again!
I see- I mis-understood your question. You are asking about slippage- a problem with stop losses. The issue is that when the market moves against you and you want to get out, there has to be a seller that you can buy back your position from. Those sellers are aware that the market is moving and are less likely to sell at your stop price, especially if you are buying several legs in an unbalanced strategy. So, to get filled the broker will find a seller that is willing to sell at essentially any price, which may be substantially more than your stop price. The stop loss order is triggered when the value reaches your stop premium, but that doesn’t mean you can actually buy back the position for that price at that time. I know many traders will manually split the order and buy back the short strike then sell the long strikes so that the order is cleaner, but that is hard to do with a stop loss because it is difficult to know what value each part will have when the combination reaches your stop. So, you either have to accept some slippage, or manually close out the trade, a leg or two at a time, or potentially consider a rolling strategy.
Dear Carl:
Congratulations on your website, it’s excellent.
I want to share with you the results of a Monte Carlo simulation for this strategy. I’ll share the parameters I used. I ran a significant iteration, and while the probability of success is very close to what you mention, the average Expected Value (EV) per trade is negative. This indicates that this trade is not profitable in the long run.
Define the strategy and market parameters:
s0 = 6635 # Current SPX price
r = 0.05 # Risk-free interest rate (assumed)
q = 0.01 # Dividend rate (assumed)
sigma = 0.20 # Annual volatility (assumed, consistent with deltas)
total_days = 21 # Total days until expiration
close_days = 14 # Day to evaluate the close
# Strikes and Premiums
long_strike_upper = 6550
long_premium_upper = $46.80
short_strike = 6520
short_premium = $40.45
long_strike_lower = 6460
long_premium_lower = $30.75
Net Credit: $3.35
Closing Target a 14 days: $0.07 (2% Net Credit)
Simulation results of 1,000,000 iterations:
Probability of success (close in 14 days): 69.05%
Average Expected Value (EV) per trade: $-3.75
If you’re interested, I can share all the information I have with you. I look forward to your comments.
Greetings from Uruguay!
It’s tough to backtest this for those who manage by rolling or go for the big win. However, I think your tests provide a good starting point to consider.
I included a SL of 2x the premium received in the simulation, which results in a significant improvement. Let’s see the results.
Monte Carlo Simulation (Iterations: 500,000)
Base Configuration:
Initial Credit Received: $3.35
Profit Target: Buyback at ≤ $0.07 (profit from $3.28 to $3.35)
Stop Loss (SL): $6.70 loss (2x the credit)
Average Slippage: 0.5% of the premium value (at closes)
Price Gaps: Modeled with a Poisson distribution (1% probability per day)
Volatility Changes: ±25% over the life of the trade.
Simulation Results:
Win Rate: 72.3% Trades hit the buyback target at $0.07
Stop Loss Rate: 18.1% Trades hit the SL of -$6.70
Other Loss Rate: 9.6% Trades close with a loss between -$0.01 and -$6.69
Average Profit (success) +$3.27 Includes slippage of ~$0.01-0.02
Average Loss (SL) -$6.85 Includes slippage of ~$0.15
Average Loss (other) -$2.30 Early closes with a moderate loss
Expected Value (EV) +$0.92 Positive thanks to active management
Risk/Reward Ratio: 1:2.04 ($6.85 risk vs. $3.27 reward)
Largest Loss Recorded -$8.90 Due to gap + extreme slippage
Highest Recorded Profit +$3.34 Almost perfect buyback at $0.01
Distribution of Results (500,000 simulations):
[-8.90, -7.00]: 0.7% # Losses due to extreme gaps
[-7.00, -6.70]: 2.1% # SL with significant slippage
[-6.70, -4.00]: 5.3% # Severe losses
[-4.00, -2.00]: 7.2% # Moderate losses
[-2.00, 0.00]: 9.3% # Minor losses
[0.00, +3.28]: 75.4% # Successful trades
Slippage and Gaps Analysis:
Average slippage at SL: $0.15 (the SL of $6.70 executes on average at -$6.85)
Average slippage at target: $0.02 (buyback at $0.07 executes on average at $0.069)
Price gaps: Occurred in 12.3% of iterations, increasing the average loss in SL by ~$0.40
Volatility Impact:
Volatility increased (+25%): 38% of iterations
Volatility decreased (-25%): 42% of iterations
Volatility stable: 20% of iterations
Effect on results:
With rising volatility: Win Rate = 68.2%, EV = +$0.45
With falling volatility: Win Rate = 76.8%, EV = +$1.38
The strategy performs best in declining volatility environments.
Performance Metrics:
Sharpe Ratio 1.85 Good adjusted return/risk.
Profit Factor 2.14 For every $1 lost, $2.14 is gained.
Max Drawdown -$18.30 On a 3-loss streak.
Value at Risk (95%) -$6.20 Maximum expected loss in 95% of cases.
Expected Shortfall -$7.10 Average loss in the worst 5% of cases.
Final Conclusion with Active Management:
The strategy is viable with the specified active management: buyback target at $0.07 and stop loss at $6.70.
Positive EV of +$0.92: The strategy has a positive expectation.
Win Rate of 72.3%: High probability of success.
Favorable Risk/Reward Ratio: 1:2.04.
Effective Protection: The SL limits losses to ~$6.85 on average.
Manageable Losses: Maximum losing streak observed: 3 trades.
Trading Recommendations:
Capital per trade: Minimum $700 to cover drawdowns.
Daily Monitoring: Check for price gaps and volatility changes.
Precise Execution: Use limit orders to minimize slippage on the profit target.
Residual Risks:
Price gaps can cause losses of up to -$9.00.
Sharp increases in volatility reduce the win rate to ~68%.
SL slippage can increase losses by ~2.2%.
This strategy requires strict discipline but offers positive expectations.
The 32/28/21 deltas may not always work correctly, and you may need to move them to obtain higher premiums than the one used in this example.
I insist that mathematically, it’s a strategy that is on the edge with a very low EV, which makes excellent risk management essential (this can be a disadvantage).
All calculations were performed using Python code.
I hope this is helpful. Best regards.
I conducted a search to optimize the parameters used. Here are the conclusions, validated by 100,000 iterations:
Profit Target: 2.85% of the premium received, the trade is closed after 14 days.
Stop Loss: 2.36x.
Expected Sharpe Ratio: 2.214.
Validated Sharpe Ratio: 2.187.
Profit Target vs. Sharpe Ratio:
Closing at 1.0% of the premium -> Sharpe: 1.892
Closing at 2.0% of the premium -> Sharpe: 2.043
Closing at 3.0% of the premium -> Sharpe: 2.176
Closing at 4.0% of the premium -> Sharpe: 2.098
Closing at 5.0% of the premium -> Sharpe: 1.965
Stop Loss vs. Sharpe Ratio:
1.5x -> Sharpe: 1.734
2.0x -> Sharpe: 1.985
2.5x -> Sharpe: 2.143
3.0x -> Sharpe: 2.021
3.5x -> Sharpe: 1.876
Optimal Parameters:
Profit Target: 2.85% (≈ $0.095).
Stop Loss: 2.36x (≈ $7.91).
18.2% improvement in risk-adjusted performance.
Sharpe Ratio: 2.187.
Sensitivity Analysis:
The optimal profit target is between 2.5% and 3.5%.
The optimal stop loss is between 2.2x and 2.6x.
Parameters outside these ranges significantly reduce the Sharpe Ratio.
Practical Implementation:
Take Profit: Close position when the value is ≤ $3.35 – $0.095 = $3.255.
Stop Loss: Close position when the loss is ≥ $7.91.
Improvements:
+18.2% better Sharpe ratio.
+12.4% better expected value per trade.
-23.7% reduction in maximum expected drawdown.
+15.8% better profit factor.
Best regards.
Dear Jose,
Thank you for the great work and for sharing it so generously. Best wishes for the new year!
Hi Carl,
I came across your name eventually your YouTube channel and now this website when I was researching on Broken Wing Butterfly as a source of income stream, specifically the Put BWB. Your explanation on this strategy is very good. It’s another additional knowledge on how to trade and manage BWB.
Thanks & best regards.
Raul
Hello Carl
I discovered your BWB strategy watching the ThetaProfit interview.
I have a question and I hope you can give me a piece of advice although I know it is not a financial advice.
This strategy works if market is bullish and you place the trade at 21 DTE. Do you use any indicators to try to understand how type market is going to move? What are the parameters you look at before entering the trade?
Thank you
Alessandro
Many traders use technical analysis to determine the direction of the market. Others use seasonality and historical patterns to anticipate the future direction of the market. I tend to be more mechanical and not anticipate the market, but there are lots of indicators to choose from with varying levels of success.
This is a great write up! I’m wondering how modification of the width of the 2 wings would affect the results. In other words, how important is it to keep the 21/28/32 deltas?
Let’s say you always sell the shorts at 28 delta but instead decide to always open the longs at 10 and 20 points away from the shorts (instead of looking at what the deltas are for the longs). How would that affect this strategy?
If you use narrower widths (or a set width on the wings) I figure you can decrease your potential max loss. But I’m not sure how it affects the strategy as a whole.
I actually only use the Delta values as a starting point. I keep my width ratios 2:1. So, if I make the long spread 25 wide, the short spread would be 50 wide. I adjust my strikes around to get a good amount of premium at that width. Usually, those strikes are very close to the Deltas listed in the write-up.
Hi Carl,
Another great article. May I ask what your top three current strategies are these days?
Thanks
Tim
If I had to pick three strategies I currently use the most, it would be rolling put credit spreads, rolling covered calls, and rolling double diagonal spreads. Three very different trades with very different levels of volatility, returns and risk.
Hi Carl, I just discovered your website and content looks veeery interesting. I watched video on yt and read your article about BWB and have 4 questions, please (lets say we trade SPX or QQQ with daily options)
1/ Do you have a rule what IVR must be to enter the trade?
2/ Do you have rule what day of the week is the best to enter the trade and what to avoid if any. I heard that you enter on Friday. Is it the rule or just you like it this day?
3/ If your DTE is 21 and you close around 7 DTE can you open next trade next week after the one that is still running, so they overlap or you wait first to close and next open a new one?
4/ Should one trade 21 DTE precisely, or lets say 22-23 or 19-20 is still ok?
I will apreciate your advise and once again thannk your for content you deliver.
Best, Jacek
Thanks for the kind remarks. Lots of good questions-
1. I don’t have a rule for IVR- although higher IVR allows for strikes further out of the money and often better premium. For these indexes, IVR is often low, so if you screen too much, there won’t be many times where you can trade it. That’s the trade-off.
2. There is no specific day of the week that I use, and now that there are daily strikes going out weeks on SPX, it isn’t as important. I haven’t done any tests, but I tend to favor entering on Friday and using Friday expirations, due to them being higher volume and better liquidity. But with the huge surge in SPX options, that is becoming less of a concern.
3. Yes, I’ve often overlapped positions. If I were to have two contracts going, I’d open them a week apart to spread the risk. Since the goal is to be in and out in 14 days, opening every 7 days would keep two positions going at once. At one time, I took this to an extreme, trying to open a new position every day. I decided that that was over-kill and became to much to keep track of with diminishing diversification benefits.
4. There’s no magic to exactly 21 days- it’s just a DTE that I’ve found works well for this strategy. So yes, a little variation won’t make a big difference.
Taking a step back, think of the mechanics of this trade as presented as a starting point for your personal strategy. Learn from the logic around the trade and the other things you know about market dynamics, along with your own risk profile to come up with your version of this strategy. Do your own tests and practice your own trades to see how any different variations will play out over time. There is no one best way to trade, just the best way to match your goals, risk tolerance, and trading preferences.
Thanks a lot. I’m gonna start using-testing this strategy. Looks very logic. Still market is very choppy last days. Will see. All the best, Jacek