The expected move is a concept that is important for option traders to understand and use. It took a while for me to grasp this when I started trading options, but now it is something I consider in trading on a regular basis. Expected move allows a trader to put into context what implied volatility and option prices are predicting for the future. While expected move isn’t a Greek, I’m including it in the group of Greeks because it is derived value from option prices and is closely related to some of the Greeks and the ways they are calculated.
Option prices increase and decrease with changes in implied volatility. Actually, since implied volatility is just an “implied” concept, Implied Volatility is the explanation of why option prices go and down after taking into account the other key pricing factors of time and price movement. Implied volatility is a percentage that represents the standard deviation of price movement for the next year, as implied by an option’s price. In any normally distributed data set, approximately 68% of the data will be within one standard deviation of the mean of the data. Stock prices aren’t typically normally distributed (they won’t perfectly fit in a bell curve), but for simplicity most people make the assumption that they are and understand the differences in outcomes to consider. I won’t dig any deeper down this hole, because for most purposes the statistics work pretty well for stocks and options, despite the simplifying assumptions that most traders make.
Options have the unique ability to express how the market in general expects prices to vary between the current time and option expiration. This is possible because the market of buyers and sellers settle on prices that balance risk and reward for future outcomes based on all currently available information. The result is that we can determine how much the market is expected to move in any timeframe, based on option prices. It is kind of like sports gamblers betting on the over/under of a game score- the betting line is determined by the cumulative expectations of those wagering based on what is known about the scoring and defensive ability of each team.
Ways to measure the expected move
One very quick way to determine how far the market is expecting the market to move by a given expiration is to add together the put and call premium of the option strike closest to the money. As I write this, the S&P 500 index (SPX) sits at 4108.54. The closest option strike is 4110. Looking 40 days out, the midpoint value of the 4110 call is 125.60, and the 4110 put is 123.15. Adding these together, we get 248.85. Why is this significant? Let’s say one trader buys these two options (a straddle) and another sells the two options. The break even is a move of plus or minus 248.85. Both the buyer and seller would feel like this is a fair trade. The market of buyers are hoping that the market moves more than expected, and the sellers are hoping it moves less. As a balance, it is a measure of the expected move.
Studies by TastyTrade.com show that this at the money straddle pricing often over estimates actual future moves slightly. For their TastyWorks.com trading platform, they use a modified formula that takes the at the money straddle and the first two out of the money strangle prices in a weighted average to calculate an expected move that historically is closer to the moves that actually end up happening. For the same timeframe, Tastyworks has an expected move of +/-263.83, so for some reason at the moment their calculation is slightly higher than the at the money straddle. Only a few trading platforms actually show an expected move calculation, and it is done differently at different brokers as there is no default standard.
How does this relate to implied volatility? Well, as it turns out the implied volatility multiplied times the price of the underlying stock can match fairly close to expected moves calculated by at the money straddles. The straddle or similar TastyWorks method come out to approximately a one standard deviation move. So a very quick calculation is to take implied volatility multiplied by underlying price multiplied by the square root of the fraction of a year until expiration. The square root part is a little much to begin with, but it is based in statistics and math. So, for our previous example, we will use the current VIX value for volatility of the S&P 500, which is currently 24.79. We have 40/365 of a year for 40 day move, and the square root of that fraction is 0.33. With the current SPX price still at 4108.54, we multiply by 24.79%, then by 0.33, and get 336.10. This would imply that the market is expecting something less than a one standard deviation move in the next 40 days. However, the calculated one standard deviation move is just 27% more than the TastyWorks expected move. For something that is “implied” from option prices and calculated in a couple of different ways, that actually is fairly close- close enough for us to have a ballpark estimate of what the market is likely to do in the future.
So, what is the best way to determine an expected move? Well, there is no right answer because no one really knows what the future holds. But, we know that more often than not, options are overpriced for the moves that eventually happen, so implied volatility will typically be more than realized volatility, so methods that show smaller expected moves will likely be closer over time. But to use the straddle method, a trader must have access to option tables for every expiration of interest and do calculation after calculation to see how the move evolves with time. Using the calculation of volatility and the square root of time allows a quick way to estimate moves over a broad range of time. For option sellers looking to “play it safe,” this calculation may encourage the choice of wider short strikes.
Charting Expected Moves
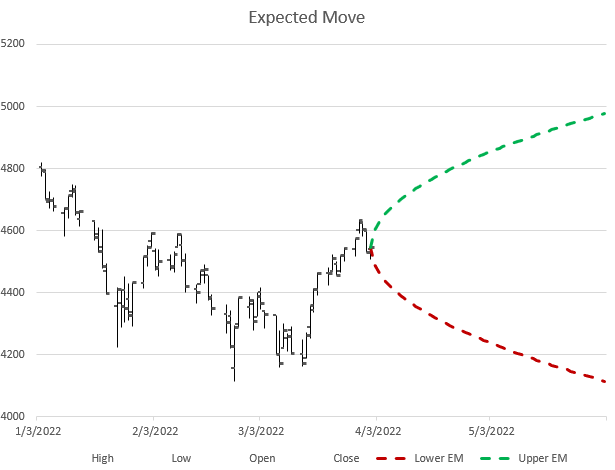
Once a trader understands the concept of the expected move, it often helps to see how this works out on a chart over time. Let’s look at a chart for early 2022 for SPX.
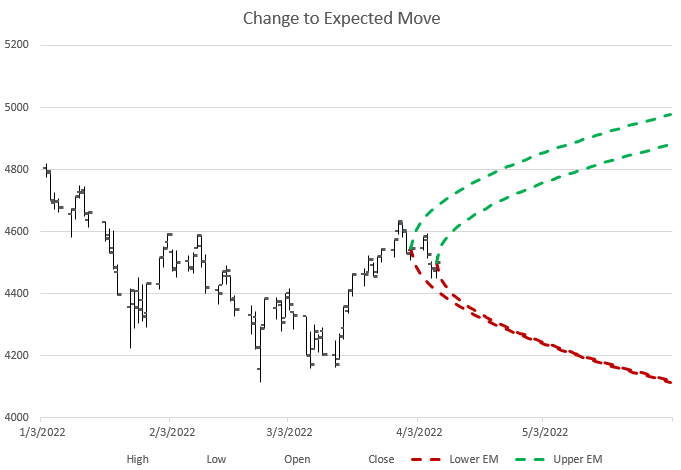
After a week we can see that the moves stayed inside the expected move. With another week of information, we can update our expected move chart.
As it turned out, this period of time included a fairly strong bear move down that was outside the expected move for a while, but then returned inside.
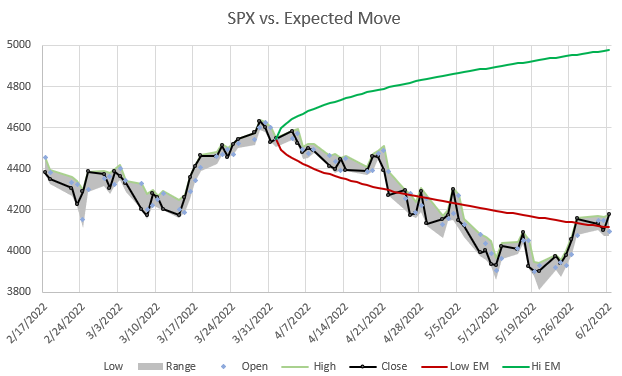
This example illustrates a point worth noting. The longer the time duration, the more likely that the realized move will stay within the expected move. Time allows probabilities to play out more.
Another factor with expected moves to consider is that implied volatility can vary significantly over time and those variations can dramatically impact expected moves of the future. Consider that an expected move when VIX is 30 will be twice as large as when VIX is 15. When implied volatility is high, the market is expecting big moves in the future. When IV is low, the market is expecting calm in the future. When the market gets volatile, it tends to take a lot of time to calm down. On the other hand, when markets are very calm, sudden changes can cause sudden spikes in implied volatility and future expected moves. It is far from an exact science, but it is the best real time future indicator of movement we have.
Regardless of how we calculate the expected move, it gives us a good idea of what the market currently collectively thinks the future movement of pricing will be. For planning option strategies, this can be very helpful.
Excellent work! I’m learning more from your articles than from any source I ever found before. If you compile your articles into a book, it will be much more useful than Natenberg’s or McMillan’s.
Wow, that’s high praise! Thanks for the kind remarks!
Sir if you are going to convert this to a book, kindly be more explicit, at many instances I was lost because I was not sure whether the PUT or CALL was being referred to. Especially the Skew article left me having to construe the context, a little guidance for the slower folks will be appreciated. It felt like we were talking of a drawing in words, the context thread being a challenge to string together.
Thanks for the feedback. I try hard to be clear, but these are complex topics and I sometimes get in a hurry and don’t add enough detail. But that’s no excuse- I’ll work to do better. I also know that I have a few pages that were written several years ago and are in need of a re-fresh- the skew page comes to mind. I know it needs some work.