There is normally a lot of variation in Implied Volatility when comparing options in any option chain. One form of variation is called skew, a statistical measure. Differences in Implied Volatility can be observed in a few different ways besides skew. When comparing the same strike price on different expirations, there is a difference in Implied Volatility, which is described as the term structure of options. But the skew in Implied Volatility is the change from options with low strike prices to high strike prices, and is typically the difference that most traders notice as they dig into the data. Let’s explore the ways Implied volatility values differ and why it matters.
Term structure between different expirations
In normal situations, IV moves around more when closer to expiration than in contracts that are far out in the future. When market volatility goes up, near term options will have higher volatility than longer term options, and when market volatility is low, near term options will be lower than long term. The idea is that volatility will even out over time.
There are some exceptions to be aware of. Often, options expiring in the next few days or so will have higher Implied Volatility than those 1-3 weeks out. As options near expiration, the premium for risk takes on a bit more value than statistics might suggest.
The other exception in Implied Volatility term structure due to known future events. When there is a known event in the future- earnings report for a stock, a Federal Reserve meeting, an election, or other action where the outcome is uncertain, Implied Volatility will be higher after the timing of the event than before. When comparing premiums in different time frames, be aware of when these events are scheduled. As the events approach, Implied Volatility will likely go up unless the outcome becomes more certain. Once the event happens and the outcome is known, Implied Volatility will likely drop significantly.
Being aware of differences in Implied Volatility between different expirations can be very helpful in picking an expiration that matches the trading strategy being used. Many trading platforms show an IV index value for each expiration date that can give you a sense of the term structure of IV between various expirations at a glance.
Skew within the same expiration
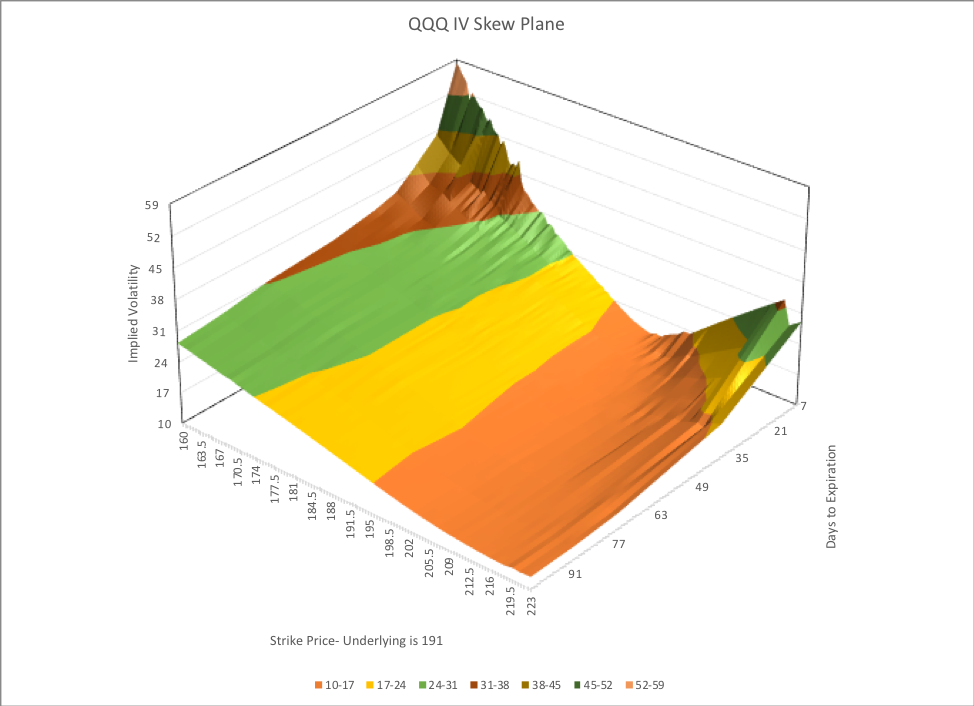
More common in analysis of Implied Volatility, skew is the measure of the difference in Implied Volatility between strikes with the same expiration. Generally, there is some pattern to these differences. If the Implied Volatility values are graphed in comparison to strike prices, they usually form either a “smile” or a “smirk.”
Skew is actually a statistical calculation, a third order analysis of a data set. Not to go too deep, but the average or mean value of a data set is the first order calculation, adding all the values together and dividing by the total number of values. Standard deviation is a second order calculation, taking each point’s difference from the mean, squaring it, adding the squares together and dividing by the number of values and finally taking the square root of that- coming up with a value that describes how far away values are distributed from mean, but not distinguishing if those distances are positive or negative from the mean. Skew then is a third order calculation, taking each point’s difference from the mean and cubing it, adding the cubes together, and dividing by the cube of the standard deviation and dividing by the number of values. This value then represents a positive or negative value of how much of the total distribution is to one side or the other of the distribution curve. It’s a bit complicated to understand numerically, but conceptually, a skewed distribution is concentrated with the most common values on one side of the mean and a long tail of values on the other side of the mean.
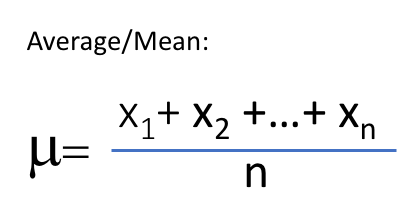
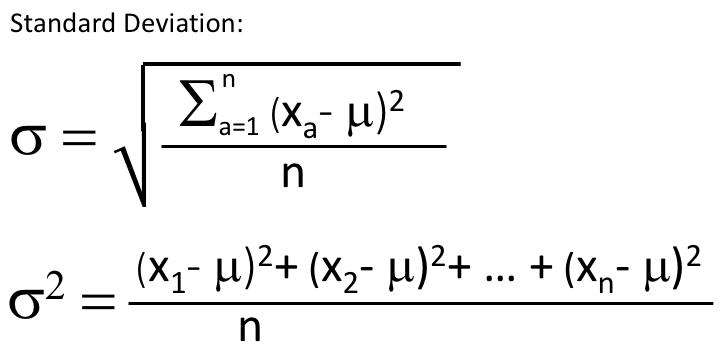
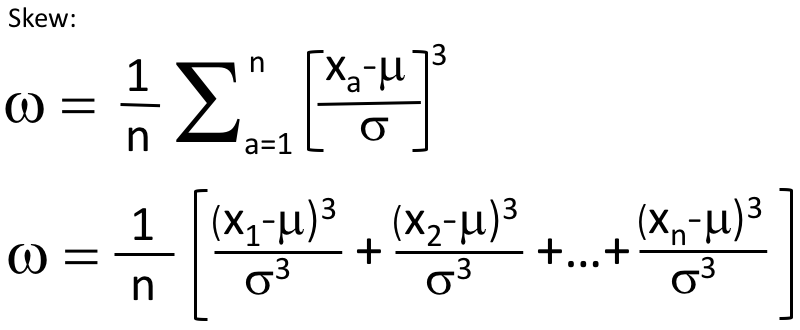
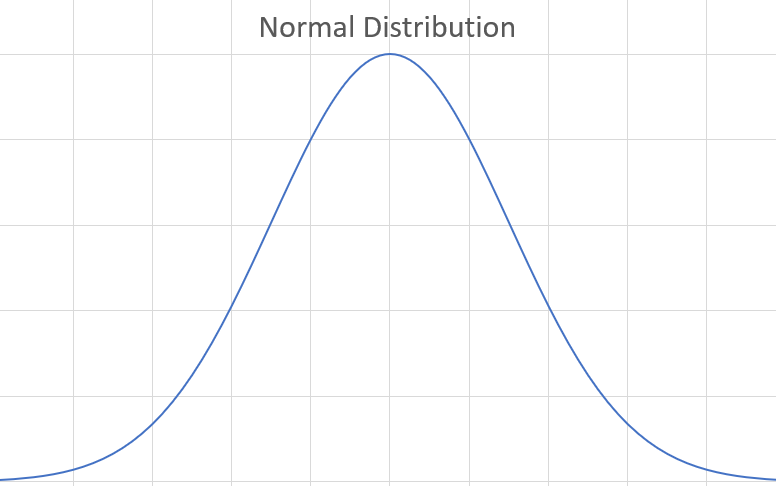
Above are the formulas written in a couple of different ways to illustrate how these different calculations are done. However, sometimes a picture is more valuable to understand the concept. Let’s look at the chart below of a normal distribution. A normal distribution has a distinctive bell shape with the same amount of data on each side of the peak, and the peak would represent the mean or average.
On the other hand, the graph below is a histogram of actual performance of the S&P 500 looking at every 15 day period over a 18 year period. It doesn’t take much to see that there is more data to the left of the peak value (or mode), and the data tails off more gradually to the left. On the right side of the peak the numbers of occurrences drop off much faster. To keep the graph from getting too big, I stopped at +/- 15%. There are actually a number of three week periods that had a return less than -15% which shows in the far left bar.
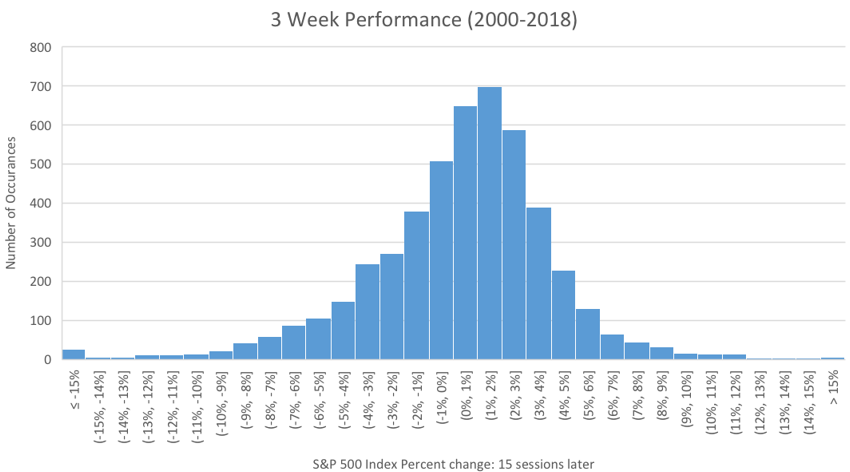
This is an example of skew. The data is skewed to the negative side of the histogram, although the most common outcome is slightly positive. If we calculate the mean return of this data, it is actually 0.29%. So, on average a three week period between 2000 and 2018 had an increase of 0.29%, with a lot of periods somewhat better. In fact, the median value of returns was 0.74%, half the data is above that and half below. But while there is a lot of positive data, the negative values when they came, were very negative. This reflects what most traders intuitively understand- markets generally creep up and crash down.
What does this have to do with Implied Volatility Skew? Well because the market behaves in a way where occasional big moves down can be very detrimental to the return of a stock or index, the market has to imply a more expensive premium on the downside for options than the upside to account for how the market has a tendency to behave. We see this in Implied Volatility Values and in the extrinsic (time) value of option premium.
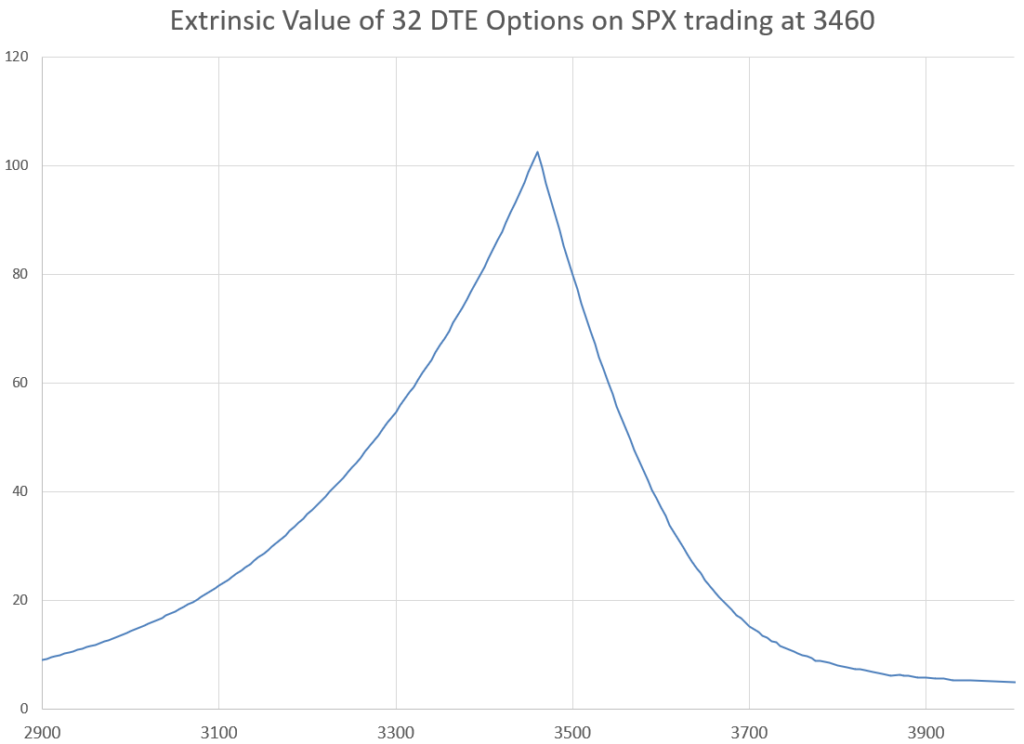
Here in a chart from an actual option table with lots of put strikes with 32 days left until expiration, we can see that the time value portion of the put option price peaks at the current price of the underlying index, but trails off much faster to the upside than the downside. This reflects the fact that there is more potential for big moves down than up. If there was no skew, the prices would drop down equally on each side. Option prices are a combination of time until expiration, distance of the strike price, from the underlying, and Implied Volatility. Since the time until expiration is the same for all the options in the chart, and the distance from the underlying price is scaled the same on both the upside and downside, the only thing that can be varying is Implied Volatility. So, lets look at what Implied Volatility does.
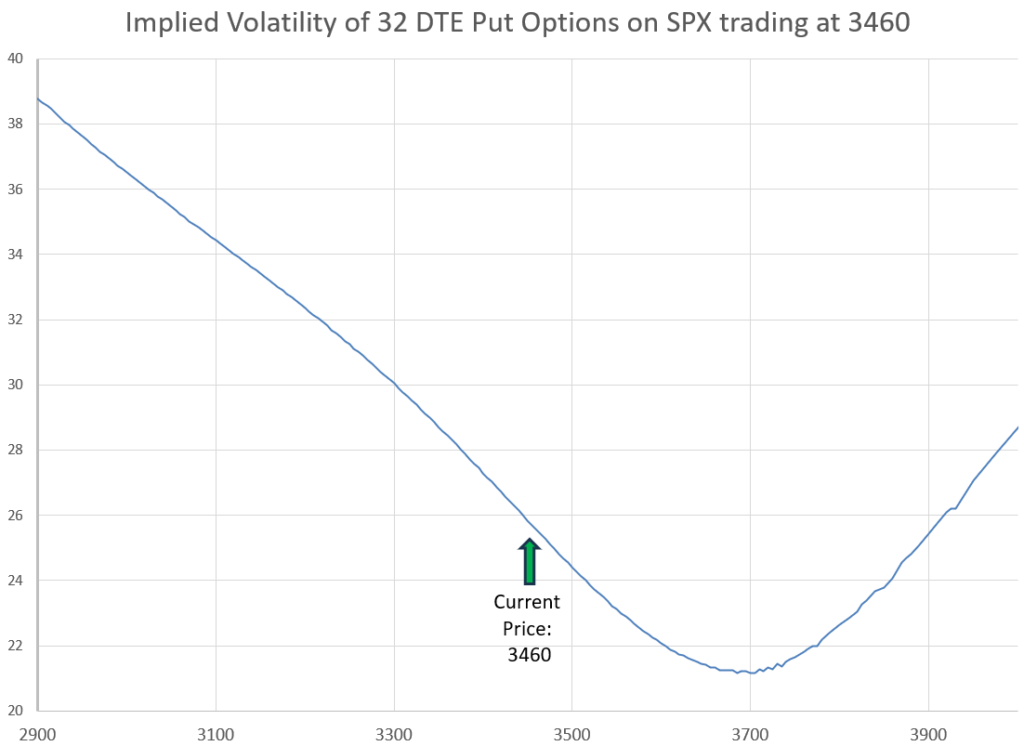
A pattern emerges where there is a curve in Implied Volatility values that resembles a smirk, or a sideways smile. Notice that the values bottom out well higher than the current sales price of the underlying. The bottom point typically is somewhere between 1 to 2 times the expected move in the time frame of the option, or a 5-10 Call Delta value.
A volatility smirk is where Implied Volatility is much higher either on low strike price options or higher on high strike price options. These two types of smirks are called either reverse skew or forward skew.
Options with reverse skew have higher Implied Volatility at lower strike prices. This is common most of the time in stock index options, and in the majority of stocks. This is because there is more perceived risk to the downside, so sellers require more premium for out of the money puts than for out of the money calls. As calls go further out of the money, the chance of the underlying price becomes almost non-existent, while puts far from the money still carry some risk. Sometimes this is also referred to as put skew.
Not all securities have this risk profile. Option chains with forward skew have options at higher strike prices with higher Implied Volatility. This skew is often seen in commodities, bonds, and in speculative stocks that are quickly rising in price. Forward skew happens when there is more risk of underlying prices going up rapidly than prices going down rapidly. This may also be referred to as call skew.
A true smile pattern of skew occurs when traders are pricing the risk of underlying prices going up to be about the same as underlying prices to go down. Strikes further from the current price have higher Implied Volatility than those close to the current price. Because these strikes are increasingly less likely to be approached, sellers require premiums with higher Implied Volatility to cover the risk of these options being breached. Only a small number of securities have a true smile pattern of skew in Implied Volatility.
As an aside, the Implied Volatility values of puts and calls at the same strike price are typically about the same. In theory, they should be identical, but in practice, they are extremely close.
Changes in the slope of skew
Skew can actually be calculated and tracked for changes. The CBOE maintains a SKEW index that can be monitored on most market quoting sites. The index calculates skew as the difference between the Implied Volatility of puts and calls that are out of the money and expire in approximately 30 days, using actual prices and implied volatility from SPX expirations in the week before and after 30 days away. The calculation is quite complex, similar to how VIX is calculated. From this definition, reverse/put skew is positive, with out of the money puts having higher IV than out of the money calls. At this writing, the SKEW index has tracked between 110 and 180 in the several years. Individual stocks and other types of securities would see very different values.
If you actually do a calculation of skew using the statistical formula, reverse/put skew is a negative number. To get around this the SKEW index, takes an equivalent of statistical skew, multiplies it by 10 and subtracts it from 100. So, if we ever had no skew in SPX options, SKEW index would be 100. But since we always have negative statistical skew, the SKEW index is always over 100 and goes up when there is more skew to the put side. The actual calculation of the index is way more complicated, but all you really need to know is that higher SKEW is more skew to the put side or strikes less than the current underlying price.
Higher SKEW values are in place when the market concludes that there is less chance of a large up move in the market, perhaps concluding that the market is overbought, or close to overbought. SKEW decreases when the market makes a sudden drop, because a large up move becomes closer to the same likelihood as a large down move. But always, at least for SPX and SKEW, the option market is always skewed to price out of the money puts with higher Implied Volatility than out of the money calls. SKEW and VIX often move in different directions, but not always.
Uses of Skew
Skew within the same expiration of an option chain can be used to pick appropriate strategy. Ideally, traders have an advantage to sell options with higher IV and buy options with lower IV. With reverse skew, premium on out of the money puts is relatively higher than out of the money call premium. Puts on indexes are priced higher for a given level of risk than calls. This extra premium helps make put selling much more successful than put buying.
Since calls on equity indexes typically have lower IV, there is not as big of an advantage to selling calls over buying. I’ve lost way more positions selling calls than selling puts. Some studies I’ve seen by tastytrade.com suggest that the average profit and loss of selling out of the money calls is about the same as buying calls. Since equity markets tend to have a slight upward bias, this makes a lot of sense, and matches my personal experience. As a result, I often sell calls as part of a call backspread to have positive upward price exposure.
However, while I use these strategies for equity index options, skew can guide me to take an opposite approach when an underlying security has forward/call skew.
Skew in Implied Volatility causes the amount of premium difference for a specific width of strike prices to be very different between calls and puts. Even the difference in Delta for the same spread width will be different based on the skew. For equity indexes with reverse/put skew this means a put spread will have a smaller difference in Delta than an equal width call spread on the same expiration. The calls will likely have more premium for the same width of spread as puts. Interestingly, premium pricing indicates that there is more risk for calls at the same Delta as a similar put. Selling an equal width Iron Condor in SPX will provide a negative Delta position because of SKEW. To have a Delta neutral position, a trader must sell a dynamic Iron Condor with strike width determined by Delta difference, not strike width difference.
Even though there are calculations possible as mentioned earlier, for me I just look at the Implied Volatility column of the option chain and see whether IV increases with strike price (forward skew) or decreases (negative skew). Occasionally, a chain will be higher on both out of the money puts and calls, with at the money IV the lowest (a skew smile). A quick look is generally enough to pick the type of skew present.
So, more than just an interesting pattern, skew tells a lot of information about direction of increased risk and premium pricing. It informs the choices I make around strategy for typical trades, and for unique situations I always look at it as part of picking strikes and strategies.
Enjoyed the read. Thank you. Very well explained