What are the optimal expirations and strikes?
I recently published a couple of studies on two different variations of a trade that sells what many would call a “Poor Man’s Covered Put,” a diagonal trade focused on collecting income from rolling a short put day after day. After a lot of review of some different daily diagonal rolling trades using SPX puts, I’ve continued to question whether the choices for strikes and expirations I’ve been trading are optimal. Could a backtest help?
To dig into details of the trade, including suggestions for managing outlier events, check out Very Long and Very Short Put Diagonal, and Daily Diagonal Covered Put. One uses a long put with a 5 year expiration and the other uses a long put with 60 days, while both sell a short put with just a few days until expiration.
Without going into every detail of the trade, we are talking about buying a long-dated put and selling a short-dated put as a combination trade. The two options will have different expiration dates and different strike prices, which is considered a diagonal trade. The idea is that the put that was sold, the short put, will decay faster than the put that was bought, the long put. To maintain the trade, we just continuously roll the short put day after day, collecting more and more premium- at least that is the plan. When the market moves, we have alternative plans to manage the positions, which are detailed in the other write-ups.
A couple of things bothered me about each trade. With 5 year expirations, interest rates play an outsized role in the performance of the long put, plus the trade ties up a lot of capital. At 60 days, having a long strike lower than the short caused some buying power issues when rolling strikes. In both cases, extended down moves greatly impacted the short put losses, while the long put didn’t provide that much protection. So, are there better choices out there?
As I researched the previous two articles, it struck me that higher Deltas would provide better long protection on the downside, and more short premium on the upside. I wanted to see if that played out in real life. I also realized that the shorter the duration of the long put in the trade, the less capital is tied up, making gains greater as a percentage of capital used. But it cuts both ways, the shorter duration long puts can’t provide the ballast of big capital and the day to day profit and losses as a percentage of capital are much bigger. So, is there a better setup to consider?
I turned to two sources to try and find some better answers- theoretical modelling and backtesting. For backtesting, I used the free service from TastyTrade.com. Their application only allows options with expirations up to 365 days and it can’t show results of trades closed in the past if the expiration is later than the time the backtest was done. But otherwise, I was able to get some meaningful data from trying different values in the tool. I also couldn’t put any complex rules for rolling just one side or managing rolls differently when the strikes get into the money, so I just set up to trade the same diagonal positions based on DTE and Deltas every day and close the trade after one day in trade. So, in effect, this backtest would similate rolling both sides of the trade back to center every day, a different approach than presented in the earlier articles, but similar enough that the data should directionally help point out better trade choices, if they exist.
Optimizing the 60 Day Long for Best Delta
In the write-up on the Daily Diagonal Covered Put, I used a 60 DTE long put and a 3 DTE short put, both at 40 Delta, which when I first started trading this strategy seemed high. When selling puts, typically Deltas in the 20-30 range seem to perform best, but in a diagonal situation, there just isn’t much room for error. Moving to 40 Delta helps by giving more bearish protection from long, and more premium on the short side to contribute in an up move. I put a backtest together for that trade, and it showed a 106% return on used capital for 2024, with a maximum drawdown of 34%. You can see it in the other page by following the link.
So, what if we kept going to 50 Delta on both the long and short options, keeping the same expirations? We get similar results:
60/3 DTE Diagonal with 50 Delta strikes Held for One Day- Entered every day
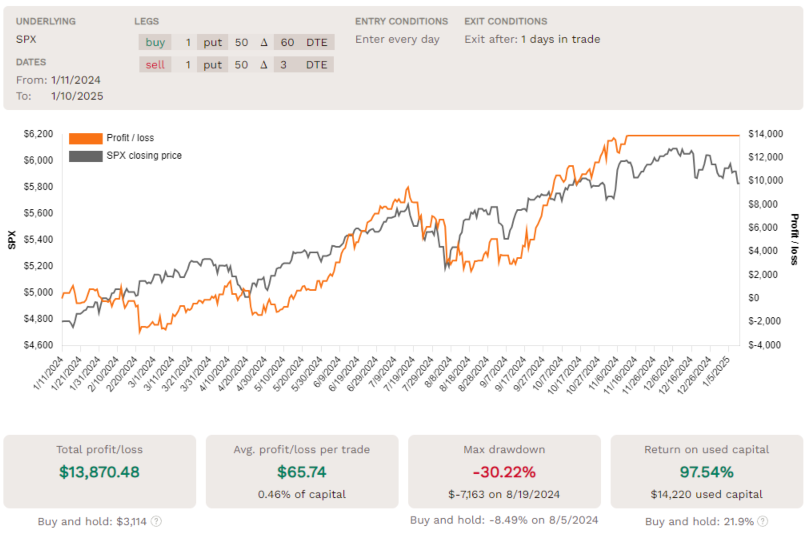

You can compare these side by side, but here are the takeaways from my point of view. The 50 Delta version requires a slight bit more capital. It also made more profit in dollars, but the percentage return total is slightly less. However, the 50 Delta version also looks a little less volatile, with a max drawdown of 30%. Interestingly, the biggest daily gain is bigger on the 50 Delta version, but the biggest daily loss is smaller- that’s two benefits I was looking for- better protection and more premium.
For reference, here is the setup of this trade, assuming the SPX index is trading at 6000:

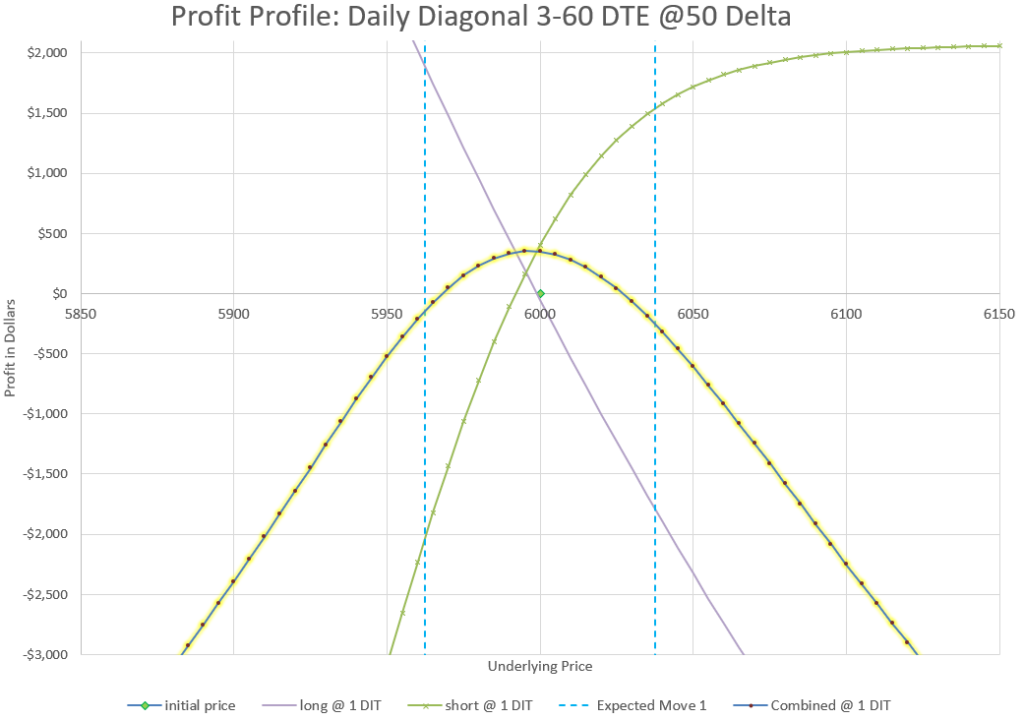
I didn’t color in the profit and loss areas on this chart, but you can see that essentially after one day there is a profit if the index stays within the expected move. The backtest shows a 64% win rate, which looks to be right on what we would predict, as the profit curve isn’t completely covering the whole expected move. As a reminder, we expect to stay within the expected move 68% of the time. For more about Expected Moves, see the linked article.
It looks like our backtest profit per day is about 1/5 of the theoretical Theta value. If we can keep 20-25% of the Theta we have available, that’s a good trade.
Where is the maximum return?
Okay, it’s great that a little tweak can make some minor improvement to results, but let’s try other values. I spent a few hours entering different long and short duration values, and also playing around with different Delta values, and finally settled on 10 days for the long put and 2 days for the short put. Here’s the backtest results:
10/2 DTE Diagonal with 55 Delta strikes Held for One Day- Entered every day
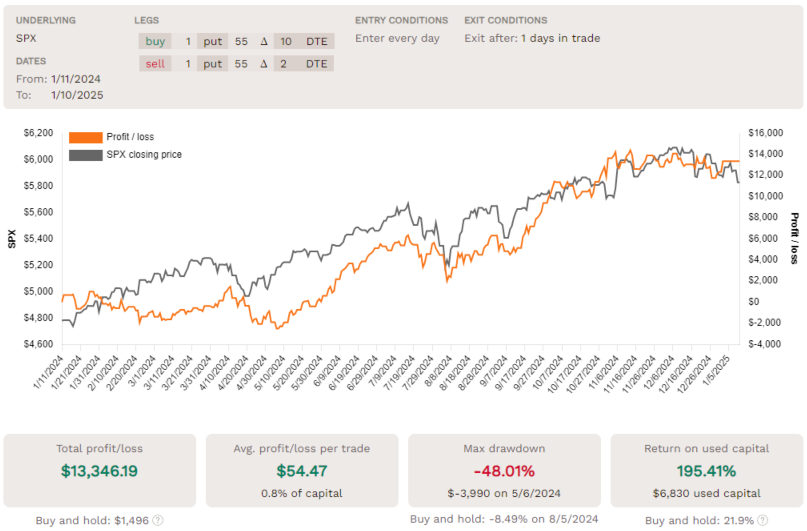
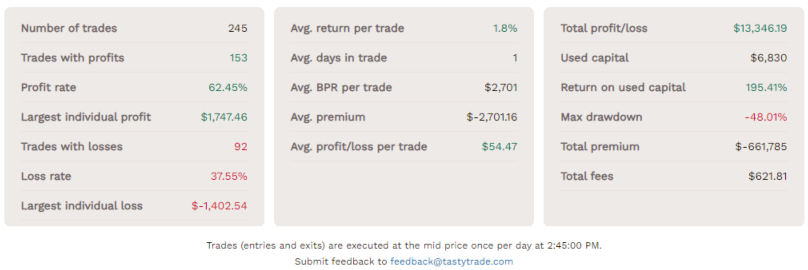
This backtest really is impressive! Start with 195% Return on used capital, essentially 1% per day! This trade makes about the same dollar profit as the 60 DTE trade above, but uses half the capital. Additionally, the biggest one day gain is bigger in absolute dollars in this version than the 60 Day version and the biggest daily loss is much less, in fact in this trade the biggest daily loss is smaller than the biggest daily gain. The maximum drawdown on a percentage basis is slightly bigger, but much less on a dollar basis.
Let’s look at the setup of this trade on a theoretical basis, and see what kind of strikes we would be trading if the market were at a current price of 6000:

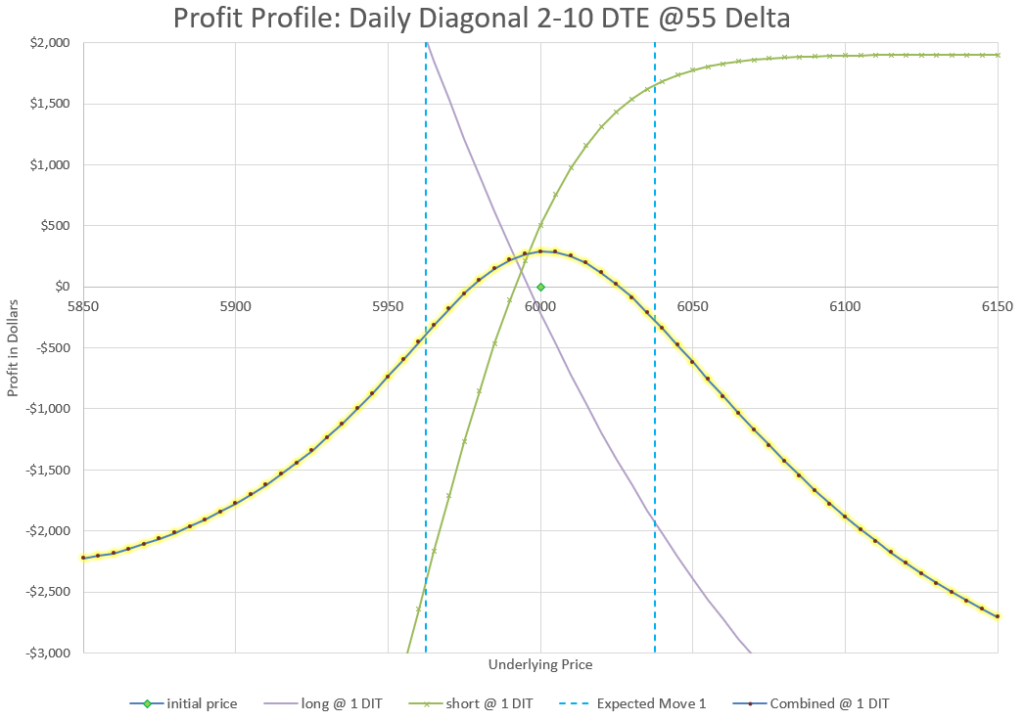
Notice again that the profit area of the chart is mostly inside the expected move, but not quite as much as the 60 Day version. And that plays out in the backtest where we have a 62% win rate. However, if we widen this chart, we see a big difference on downside risk:
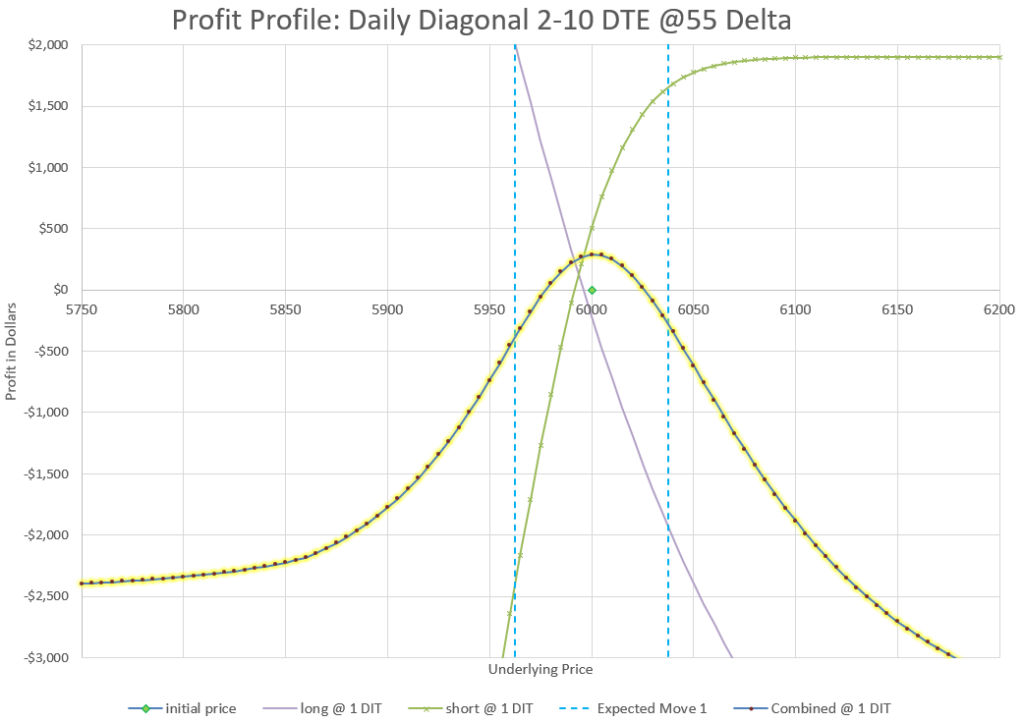
Notice that the lowest one day loss flattens out to a little less than $2500, where other versions of this trade go down much further before they flatten out. With less duration in the long, the Delta of the long quickly catches up with the short as they approach 100, and there is the added benefit that the long is a higher strike than the short, so the very deep in the money value is less than the premium paid to get into the trade. So, even though we show the debit paid for the trade as the risk, the max loss is actually less on the down side. And if we look at the back test, we can see that the biggest daily loss was about $1400, which is less than this model predicts, probably due to different Implied Volatility at the point in the year when the loss occurred.
Before going further, you may be curious if I looked at even higher Deltas? Yes, I did and they started showing lower returns, probably because the increased capital required didn’t provide additional profit. What about 9 days, or 7? Or maybe 11? I looked at all the DTEs around 10 and 10 was best. I can only assume that maybe that has to do with 10 DTE being where IV tends to be minimized in the term structure, so premium has the best bang for the buck there? That’s only a guess, but it seems to be the best point in time according to the backtest. To be fair values a few days more or less or a few Deltas higher or lower weren’t that much different in the backtest results, but I found 10 DTE long, 2 DTE short, and 55 Delta optimized results.
Can we improve the 60 Day Diagonal?
After seeing that 2 DTE for the short worked better at our best spot along with 55 Delta, I went back to see what would happen with those changes with a 60 Day long put. Here’s the results:
60/3 DTE Diagonal with 50 Delta strikes Held for One Day- Entered every day
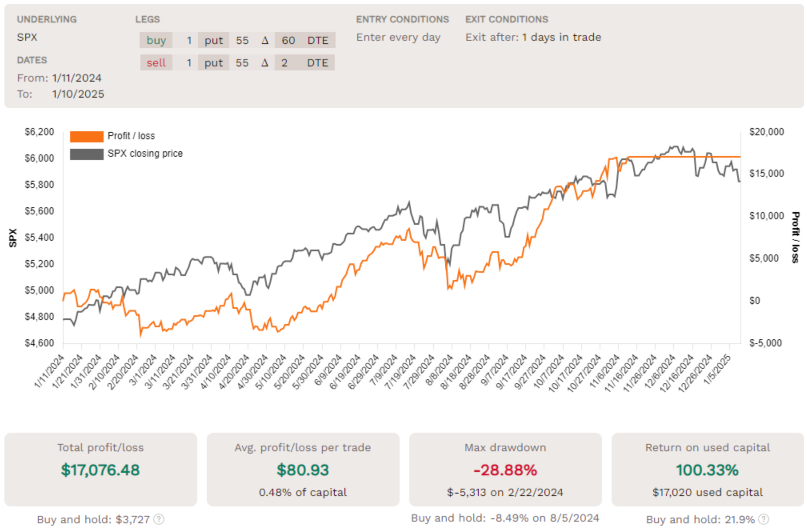
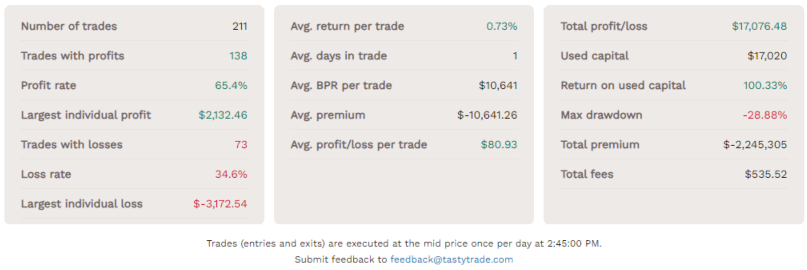
How about that! We improved our percentage return to 100% of used capital. We reduced our maximum drawdown. We raised our maximum daily profit more than we increase our biggest daily loss. We did need a little more capital. So, I’d call it marginal improvement over the earlier 60 day option.
Final Thoughts
One point to make sure everyone understands is that past performance in no guarantee of future results. Backtests show how something would have performed in the past. They also are completely mechanical and don’t take into account any human element of decision making, either good or bad. It also matters what timeframe the backtest was run, and 2024 was a mostly up year. However, I do think that they can point to help directionally compare different choices and show which kinds of trades have a tendency to do well and which don’t. Looking at values like biggest drawdown and largest daily loss starts to give you an idea of what the risk can be of a trade, and backtests with big upsides show possibilities for profits if conditions repeat.
I also studied different underlyings to see if similar results were possible, even if using weekly expirations. I’ll save that for another write-up in the future, but intial backtests look promising, matching what some of my option trading buddies have shared with their use of diagonals.
After working with the backtest and modelling different results, the conclusion is that our optimal setup appears to be much shorter duration long puts and much higher Delta values than what has been presented previously. Because my starting point was 5 year long puts, it took a while to realize that the better choice was much less convoluted and much easier to manage. Sometimes, it is easy to over complicate things. Here’s to keeping it more simple.
Feel free to leave a comment and share your experiences with this style of trade.