I recently published a couple of studies on two different variations of a trade that sells what many would call a “Poor Man’s Covered Put,” a diagonal trade focused on collecting income from rolling a short put day after day. After a lot of review of some different daily diagonal rolling trades using SPX puts, I’ve continued to question whether the choices for strikes and expirations I’ve been trading are optimal. Could a backtest help?
To dig into details of the trade, including suggestions for managing outlier events, check out Very Long and Very Short Put Diagonal, and Daily Diagonal Covered Put. One uses a long put with a 5 year expiration and the other uses a long put with 60 days, while both sell a short put with just a few days until expiration.
Without going into every detail of the trade, we are talking about buying a long-dated put and selling a short-dated put as a combination trade. The two options will have different expiration dates and different strike prices, which is considered a diagonal trade. The idea is that the put that was sold, the short put, will decay faster than the put that was bought, the long put. To maintain the trade, we just continuously roll the short put day after day, collecting more and more premium- at least that is the plan. When the market moves, we have alternative plans to manage the positions, which are detailed in the other write-ups.
A couple of things bothered me about each trade. With 5 year expirations, interest rates play an outsized role in the performance of the long put, plus the trade ties up a lot of capital. At 60 days, having a long strike lower than the short caused some buying power issues when rolling strikes. In both cases, extended down moves greatly impacted the short put losses, while the long put didn’t provide that much protection. So, are there better choices out there?
As I researched the previous two articles, it struck me that higher Deltas would provide better long protection on the downside, and more short premium on the upside. I wanted to see if that played out in real life. I also realized that the shorter the duration of the long put in the trade, the less capital is tied up, making gains greater as a percentage of capital used. But it cuts both ways, the shorter duration long puts can’t provide the ballast of big capital and the day to day profit and losses as a percentage of capital are much bigger. So, is there a better setup to consider?
I turned to two sources to try and find some better answers- theoretical modelling and backtesting. For backtesting, I used the free service from TastyTrade.com. Their application only allows options with expirations up to 365 days and it can’t show results of trades closed in the past if the expiration is later than the time the backtest was done. But otherwise, I was able to get some meaningful data from trying different values in the tool. I also couldn’t put any complex rules for rolling just one side or managing rolls differently when the strikes get into the money, so I just set up to trade the same diagonal positions based on DTE and Deltas every day and close the trade after one day in trade. So, in effect, this backtest would similate rolling both sides of the trade back to center every day, a different approach than presented in the earlier articles, but similar enough that the data should directionally help point out better trade choices, if they exist.
Optimizing the 60 Day Long for Best Delta
In the write-up on the Daily Diagonal Covered Put, I used a 60 DTE long put and a 3 DTE short put, both at 40 Delta, which when I first started trading this strategy seemed high. When selling puts, typically Deltas in the 20-30 range seem to perform best, but in a diagonal situation, there just isn’t much room for error. Moving to 40 Delta helps by giving more bearish protection from long, and more premium on the short side to contribute in an up move. I put a backtest together for that trade, and it showed a 106% return on used capital for 2024, with a maximum drawdown of 34%. You can see it in the other page by following the link.
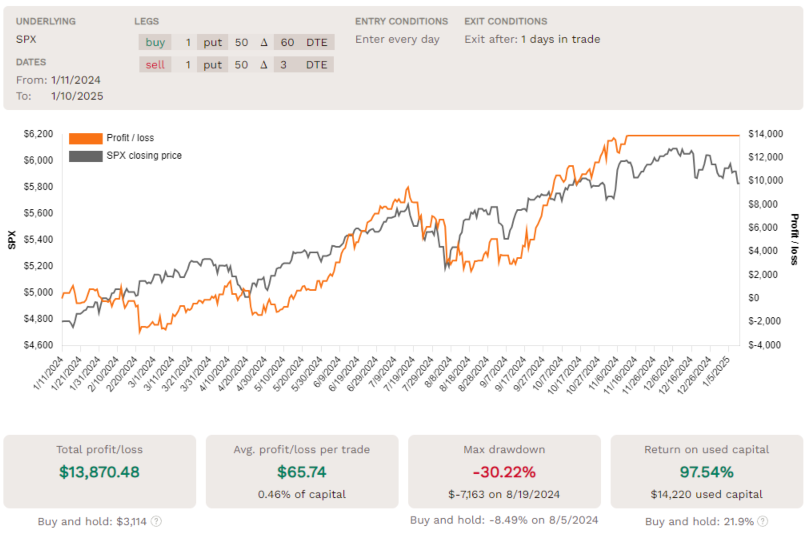
So, what if we kept going to 50 Delta on both the long and short options, keeping the same expirations? We get similar results:
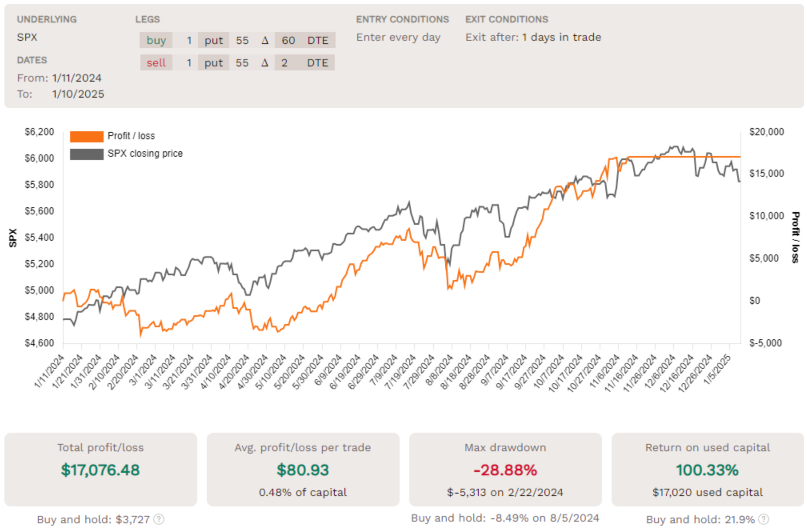
60/3 DTE Diagonal with 50 Delta strikes Held for One Day- Entered every day
You can compare these side by side, but here are the takeaways from my point of view. The 50 Delta version requires a slight bit more capital. It also made more profit in dollars, but the percentage return total is slightly less. However, the 50 Delta version also looks a little less volatile, with a max drawdown of 30%. Interestingly, the biggest daily gain is bigger on the 50 Delta version, but the biggest daily loss is smaller- that’s two benefits I was looking for- better protection and more premium.
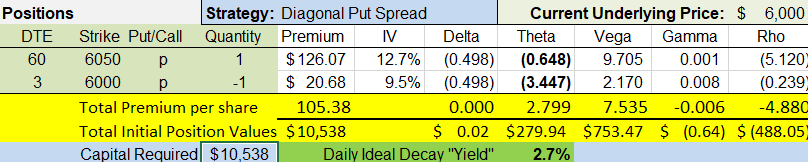
For reference, here is the setup of this trade, assuming the SPX index is trading at 6000:
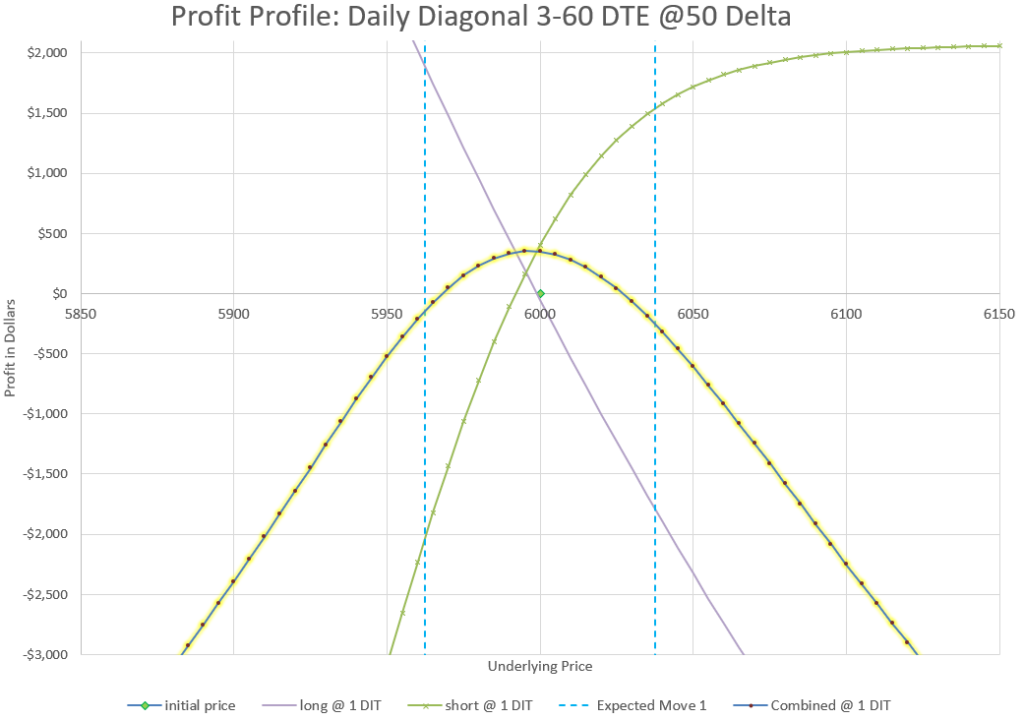
I didn’t color in the profit and loss areas on this chart, but you can see that essentially after one day there is a profit if the index stays within the expected move. The backtest shows a 64% win rate, which looks to be right on what we would predict, as the profit curve isn’t completely covering the whole expected move. As a reminder, we expect to stay within the expected move 68% of the time. For more about Expected Moves, see the linked article.
It looks like our backtest profit per day is about 1/5 of the theoretical Theta value. If we can keep 20-25% of the Theta we have available, that’s a good trade.
Where is the maximum return?
Okay, it’s great that a little tweak can make some minor improvement to results, but let’s try other values. I spent a few hours entering different long and short duration values, and also playing around with different Delta values, and finally settled on 10 days for the long put and 2 days for the short put. Here’s the backtest results:
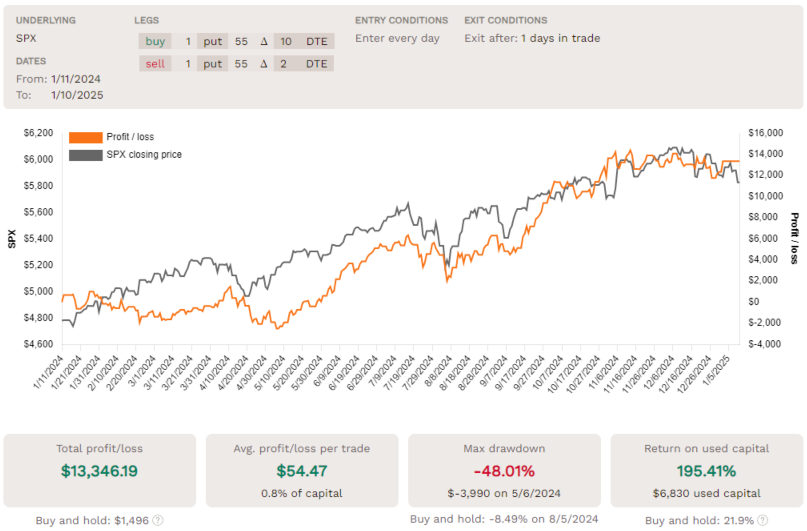
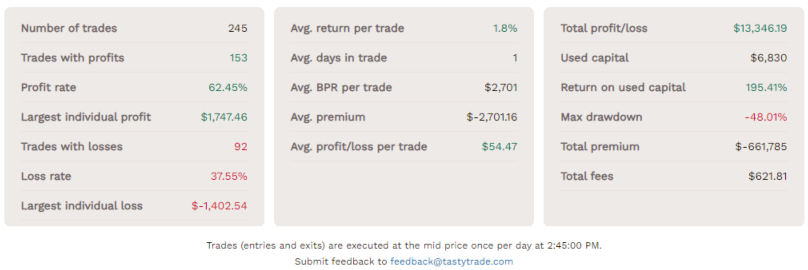
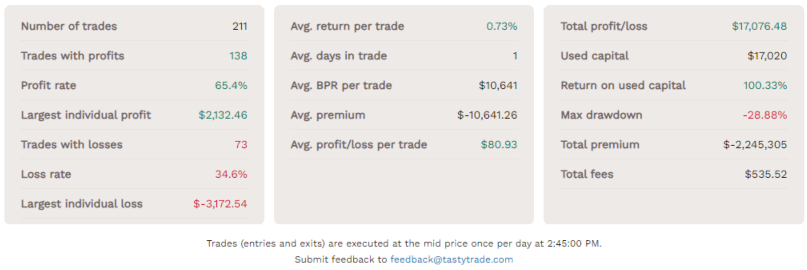
10/2 DTE Diagonal with 55 Delta strikes Held for One Day- Entered every day
This backtest really is impressive! Start with 195% Return on used capital, essentially 1% per day! This trade makes about the same dollar profit as the 60 DTE trade above, but uses half the capital. Additionally, the biggest one day gain is bigger in absolute dollars in this version than the 60 Day version and the biggest daily loss is much less, in fact in this trade the biggest daily loss is smaller than the biggest daily gain. The maximum drawdown on a percentage basis is slightly bigger, but much less on a dollar basis.
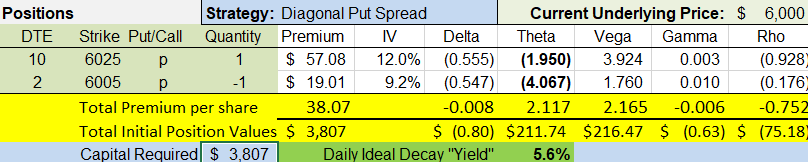
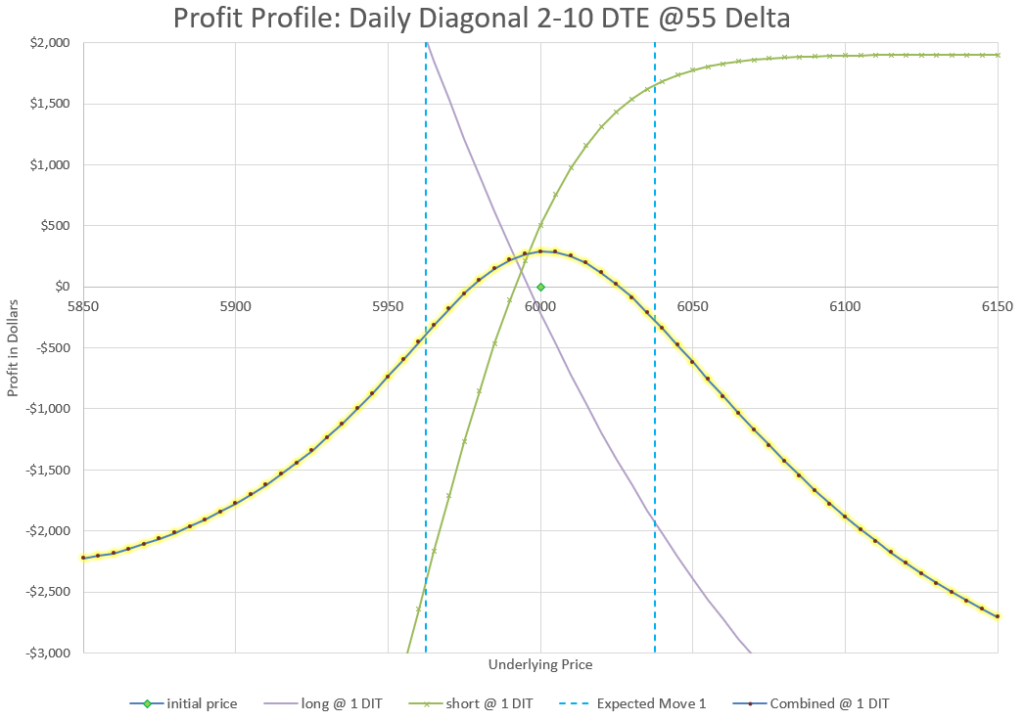
Let’s look at the setup of this trade on a theoretical basis, and see what kind of strikes we would be trading if the market were at a current price of 6000:
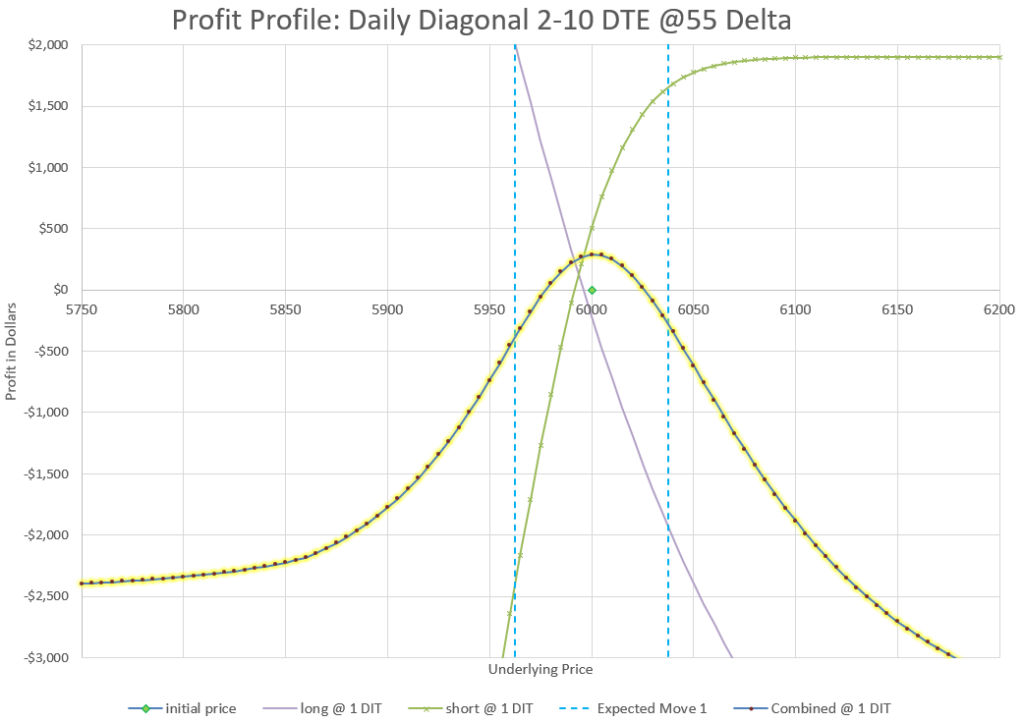
Notice again that the profit area of the chart is mostly inside the expected move, but not quite as much as the 60 Day version. And that plays out in the backtest where we have a 62% win rate. However, if we widen this chart, we see a big difference on downside risk:
Notice that the lowest one day loss flattens out to a little less than $2500, where other versions of this trade go down much further before they flatten out. With less duration in the long, the Delta of the long quickly catches up with the short as they approach 100, and there is the added benefit that the long is a higher strike than the short, so the very deep in the money value is less than the premium paid to get into the trade. So, even though we show the debit paid for the trade as the risk, the max loss is actually less on the down side. And if we look at the back test, we can see that the biggest daily loss was about $1400, which is less than this model predicts, probably due to different Implied Volatility at the point in the year when the loss occurred.
Before going further, you may be curious if I looked at even higher Deltas? Yes, I did and they started showing lower returns, probably because the increased capital required didn’t provide additional profit. What about 9 days, or 7? Or maybe 11? I looked at all the DTEs around 10 and 10 was best. I can only assume that maybe that has to do with 10 DTE being where IV tends to be minimized in the term structure, so premium has the best bang for the buck there? That’s only a guess, but it seems to be the best point in time according to the backtest. To be fair values a few days more or less or a few Deltas higher or lower weren’t that much different in the backtest results, but I found 10 DTE long, 2 DTE short, and 55 Delta optimized results.
Can we improve the 60 Day Diagonal?
After seeing that 2 DTE for the short worked better at our best spot along with 55 Delta, I went back to see what would happen with those changes with a 60 Day long put. Here’s the results:
60/3 DTE Diagonal with 50 Delta strikes Held for One Day- Entered every day
How about that! We improved our percentage return to 100% of used capital. We reduced our maximum drawdown. We raised our maximum daily profit more than we increase our biggest daily loss. We did need a little more capital. So, I’d call it marginal improvement over the earlier 60 day option.
Final Thoughts
One point to make sure everyone understands is that past performance in no guarantee of future results. Backtests show how something would have performed in the past. They also are completely mechanical and don’t take into account any human element of decision making, either good or bad. It also matters what timeframe the backtest was run, and 2024 was a mostly up year. However, I do think that they can point to help directionally compare different choices and show which kinds of trades have a tendency to do well and which don’t. Looking at values like biggest drawdown and largest daily loss starts to give you an idea of what the risk can be of a trade, and backtests with big upsides show possibilities for profits if conditions repeat.
I also studied different underlyings to see if similar results were possible, even if using weekly expirations. I’ll save that for another write-up in the future, but intial backtests look promising, matching what some of my option trading buddies have shared with their use of diagonals.
After working with the backtest and modelling different results, the conclusion is that our optimal setup appears to be much shorter duration long puts and much higher Delta values than what has been presented previously. Because my starting point was 5 year long puts, it took a while to realize that the better choice was much less convoluted and much easier to manage. Sometimes, it is easy to over complicate things. Here’s to keeping it more simple.
Feel free to leave a comment and share your experiences with this style of trade.
Beginning option traders like to buy calls to start their option trading, and over time often learn the advantage of selling options and probability. But there’s a reason that long trades involving calls exist- the market goes up more than it goes down. We need strategies that use call trades to benefit from market moves up without experiencing huge amounts of time decay, or huge swings in positions. These 5 strategies provide some choices to get in on a bull market with calls.
(Without losing a lot of Theta decay)
Option buyers typically have low probability of profit because of the need to overcome Theta decay, the measure of how much option premium loses value every day. But often selling calls in a bull market is a loser as markets don’t offer much premium and go up more than expected. And the market is bullish 70-80% of the time. Are there call trades that take advantage and balance risk and opportunity better than others?
Each of these trades is built for a different type of trade mentality, so it is a personal choice based on risk, time frame, and how active a trader wants to be in the market. However, with the exception of the covered call, all leverage capital and risk a total loss of premium paid but with big potential gains.
When is a good time to do these kinds of trade? Selling options is best when IV is high. Buying options is best when Implied Volatility (IV) is low and option premium is cheap. When IV is high, big moves are anticipated, but even if the market goes up, IV can contract quickly and significantly counter the gains from an up move. One overall measure to watch is the VIX volatility index. VIX has a long-term average level of 18, and when it gets in the low teens, between 12-14, it doesn’t have much lower it can go. Individual stocks can be checked for their IV level by looking at IV rank or IV percentile. When VIX is low and a stock has an IV percentile or rank below 10, I’d consider the stock IV as low. This scenario happens frequently, especially in bull markets, which occur much more of the time than bear markets. On the flip side as the market goes up and IV goes down, selling options get less lucrative and more risky.
Let’s take the five strategies one at a time. There are also detailed write-ups of each on separate pages, so this is an introduction to these trades and to contrast the risks and benefits of each before digging in deep.
Covered Call Trades
Of the five trades listed above, the Covered Call is the most conservative and the only trade that is based on a net sale of options. The trade is a combination of owning 100 shares of stock and selling a call against the shares. Because the amount of capital at risk is essentially the value of the shares of stock, which are owned in the account, this trade has no leverage from options- instead it reduces leverage and risk by adding a hedge against the shares owned.
Let’s say a trader sells a call with a Delta of 30 against their shares. The net Delta of the Covered Call position becomes 70. This means the two part position acts like 70 shares instead of 100, making the position less volatile. Since the only option involved is one that was sold, time decay always works for the call seller.
Many traders love Covered Calls because it allows them to collect premium as a source of income on shares they already own, without taking on any additional risk. For many conservative option traders, this is the one and only option trade ever needed. Depending on the underlying and tactics used, it is possible to make 5-15% income on stocks in a portfolio. Because the trade involves selling options, the probability of profit is greater than 50%, the highest probability of the five trades listed.
Covered calls improve the probability of profit over owning stock alone in exchange for giving up unlimited upside.
So, what’s not to like? It depends on your perspective, but the Covered Call limits upside gains, but does only a little to reduce downside risk. If a Covered Call owner has stock that goes up a huge amount, the call will limit how much profit can be made. The trade will be a profit, but without the call, the profit could be more. By selling a call, the Covered Call trader is collecting premium in exchange for the possibility of missing out on a big up move. On the downside, collecting premium might be a small consolation if the stock drops dramatically.
For a conservative trader, the Covered Call is a way to reduce risk compared to simply owning stock outright. For an aggressive trader, the Covered Call uses a lot of capital to get a return potentially the same as the market, with no real downside protection. I’ve come full circle as a trader myself, going from a big fan, to dis-illusioned by the lack of upside, to recognizing the benefit of a less-volatile, positive probability trade.
Stock Replacement Call Trades
The next strategy is one that is often referred to as stock replacement. With this strategy, we can buy options that have the same upside as shares of stock but at a fraction of the cost. In theory any time someone buys a call, there is the same upside as stock, but some set-ups give a trader more of the upside benefit than others.
When I think of using options in place of stock, I’m looking for two things, relatively high probability and low Theta decay. When buying a option with no hedge, the natural way to lower time decay is to buy a call well out in time where it will decay slowly. To get it to move with the underlying stock, having an in-the-money option can get most of the move up (or down).
So for this strategy, I look for options 6-12 months out with a Delta value of 75-80. These options will likely cost 10-20% of the cost of the shares as they have significant intrinsic and extrinsic value. With over 6 months until expiration, time decay is slow, but still present.
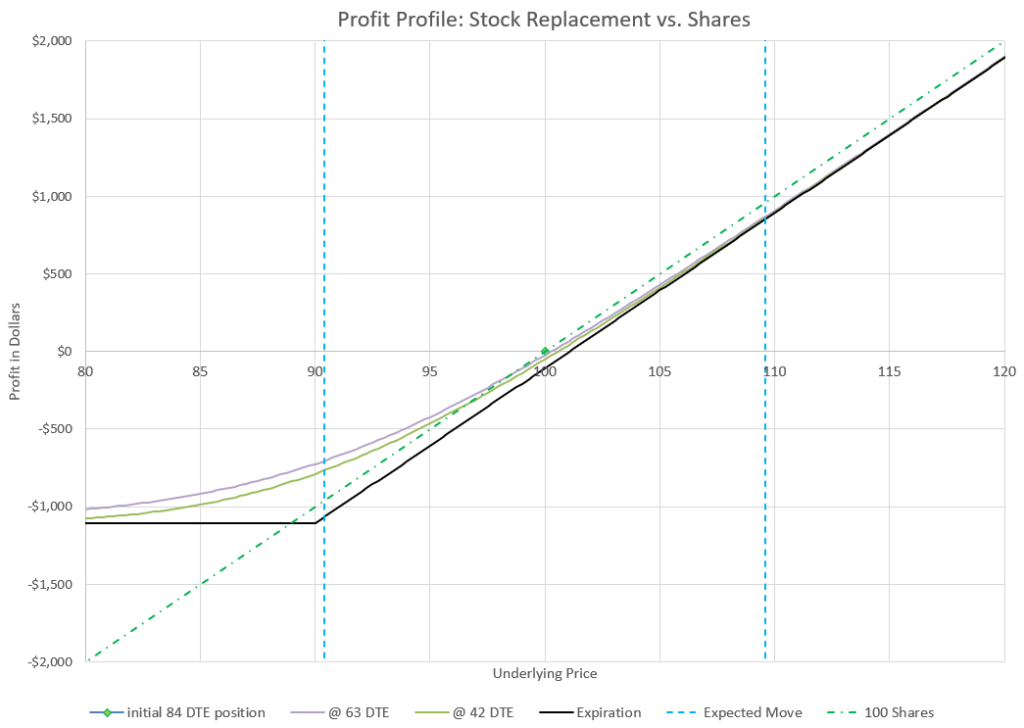
In this example, a call is purchased with 84 days until expiration with a Delta of 0.78. Notice that even after several weeks, the profit curve is very close to that of owning stock around the money. Purchasing even longer duration options than this would provide less daily decay with even better downside protection.
Because I’m buying an option with a Delta of 75-80, I have the equivalent of 75-80 shares of stock from a price movement stand-point. If the price goes up, over time the Delta will increase and the option will behave closer and closer to the movement of 100 shares of stock.
The risk to the downside is limited to the amount paid for the options, so a big market drop could wipe out the position, but even a big drop would still likely hold some value, but mostly the extrinsic time value. However, the really good news is that losses in the options on a downturn are less than the losses that would come from 100 shares of stock.
My goal in this trade is not to hold until expiration, but to either exit or roll to a longer duration before we get into the last quarter before expiration. If the stock price has gone up, I can roll to a new time at a higher strike price and collect the amount the stock has appreciated less the time decay that was lost.
This trade needs a small move up to break even, so the theoretical probability of profit is a little less than 50%. But, by getting out way before expiration, the odds get ever closer to 50/50, and in a bull market the unlimited upside with limited downside is a pretty compelling proposition.
One watchout with this trade (and the others as well) is thinking that since we use just one fifth or one tenth of the capital of buying stock that we can now buy five or ten times as many options and really cash in. We have to respect the downside risk. A big move down will wipe out this position. So we don’t want to put all our eggs in this basket.
But when the market is frothy and looking like it is going nowhere but up, this is a good way to participate in the upside while protecting the downside, assuming that there’s plenty of capital left to deploy if the market suddenly goes against the position.
Poor Man’s Covered Call Trades
Covered calls have a number of trading advantages- they reduce volatility, provide some income, somewhat cushion a position from a fall. But, to have a covered call, you have to own stock first to sell a call against it. However, we just discussed the idea of using long calls as a substitute for stock, so if we sell a call against our stock equivalent we can have a low cost equivalent of a covered call, in other words a Poor Man’s Covered Call.
One difference is that our long calls have decay, and we want to counter that decay by selling calls with the same or more decay in our favor. A great way is to create a diagonal spread, selling calls that are closer to expiration while buying calls that are further away.
By selling a call with faster decay against our long call with slower decay, we can actually get a trade that has a greater than 50% probability of profit. The trade-off is that we limit the upside. The trade has defined risk and defined maximum profit.
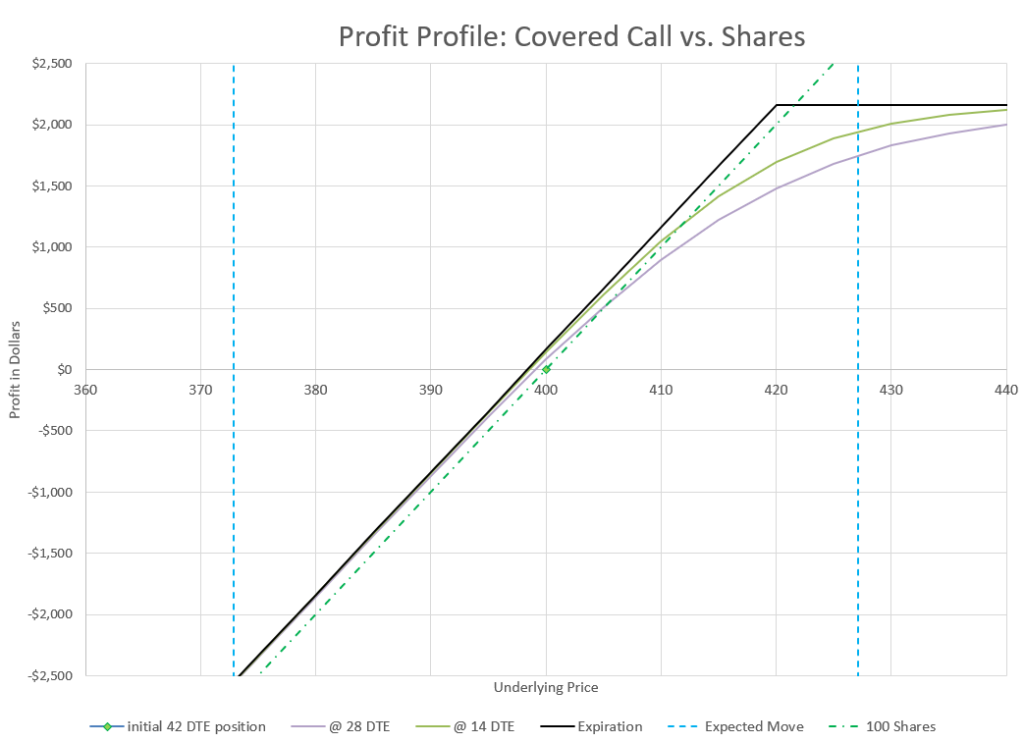
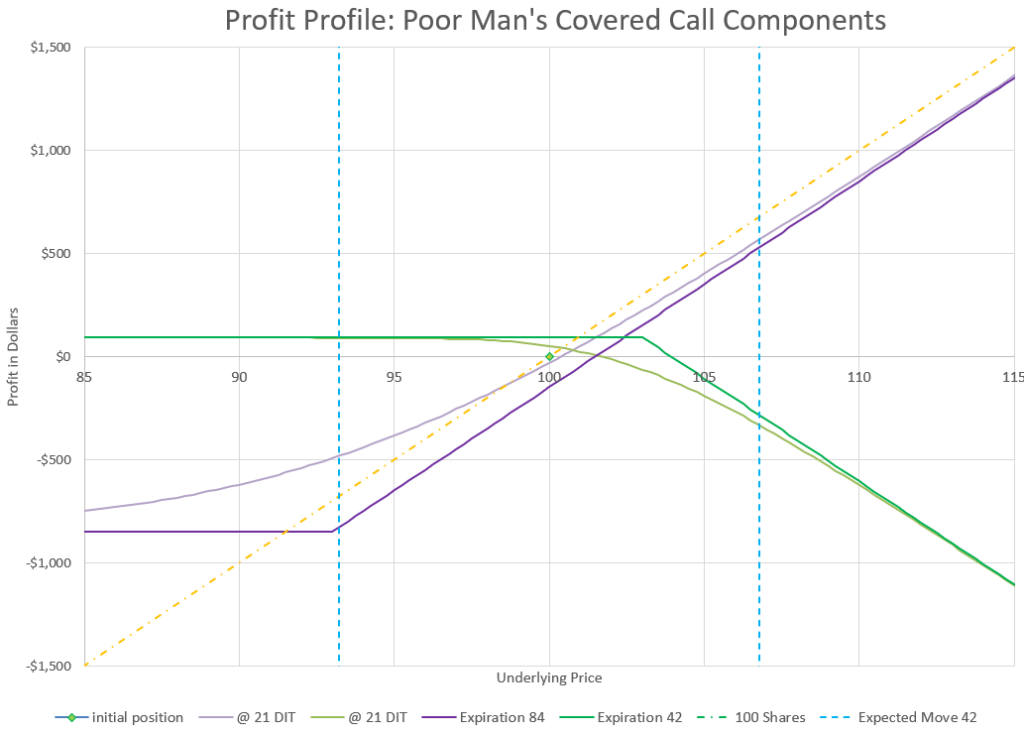
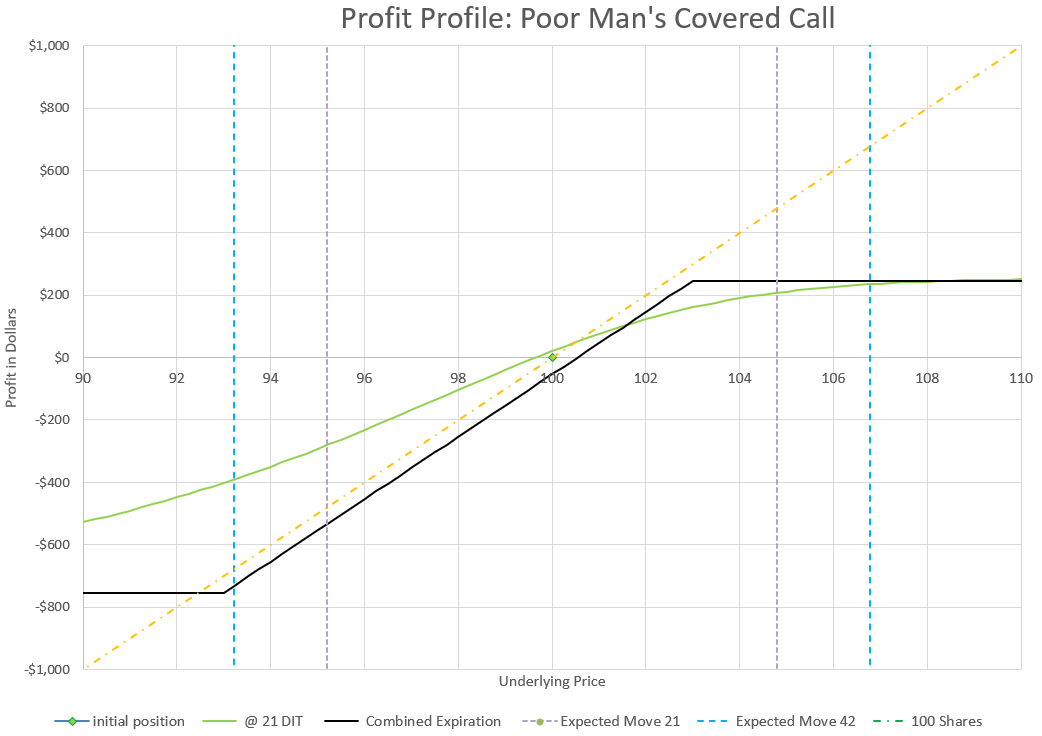
My typical setup is to buy a 75 Delta call about 12 weeks out and sell a 25 Delta call about 6 weeks out, or half the time. If we look at a chart of each of the options profit potential along with how they compare to just owning stock, we get a bit of a complex chart:
In this chart we have two options with their own profit profiles at expiration. But, since they don’t expire at the same time, it is more important to see how they will perform at a certain point in time, like half-way to expiration for the shorter duration short call. After 21 days, the short call profit profile hugs the expiration profit profile much closer than the longer duration long call.
The key thing when looking at diagonal spread positions is that we really can’t think that much about expiration, especially for the long duration portion of the trade because it expires later. So, we really have to pay attention to how the projected values will behave at different points in time prior to expiration.
Another thing to notice is that the short call we sold has a strike price much closer to the current price than the long duration call. This means that there is more potential downside than upside, but that’s true with a regular covered call as well, actually even more so. At least our downside on this trade is limited.
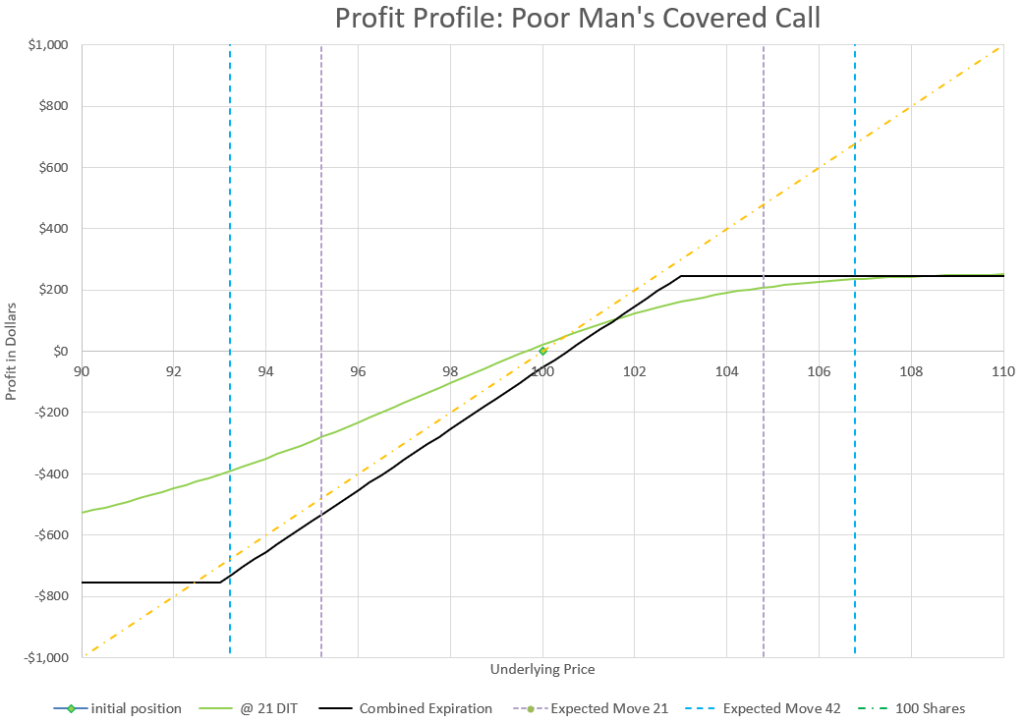
When we put it all together in a chart, we can see how the trade profits not only when the market is up, but when the market is flat as well. Profitability with no underlying price change is due to the faster decay of the shorter duration short calls.
Notice the 21 days in trade profit line is profitable even in a slight down move.
Looking at the overall Delta of this trade, it opens with a net Delta of 50, or the equivalent movement of 50 shares of stock. So this position is half as volatile as owning 100 shares of stock for a cost equivalent to about 7.5% of owning 100 shares.
From a profit standpoint, our capital required was $750 and the maximum profit is $250. This shows how much upside we’ve given up by selling the call, compared to unlimited upside with the call alone. However, if we look at a “sweet spot” on the profit chart above, we can see that if price goes up from 100 to 102 in 21 days, the profit is around $150, a 20% return on capital for a 2% move. In comparison, a 2% price move on the earlier long call option only would yield about a 7% return on capital, and owning stock outright would net the owner, well, obviously 2%. one way or the other, I can roll out at the same time I’m repositioning the short leg.
Is there any magic to 84 and 42 days? Not really, it’s just a time frame that I find fairly manageable without a lot of stress, but with plenty of premium to collect on the short side of the trade. Longer durations have less stress, and shorter durations are more volatile with more potential profit. It’s a choice that depends on your trading preferences and risk tolerance.
There’s a lot of ways to manage the Poor Man’s Covered Call, and I’ve written about them in an extended post.
Buying an Out of the Money Call Spread
Buying an out of the money call spread seems counter to every theoretical calculation a person can do. The probability of expiring in the money is low by definition and time decay is the enemy big time. But, over the years I noticed that when I sold call spreads that were supposed to be profitable, either alone or as part of an Iron Condor, those spreads seemed to lose money often, and often lost a lot. One thing I’ve learned in trading is that if a strategy you use continually loses, try doing the opposite. So, here we are. I’ve done a lot of back-testing and trading my own positions to come up with a low probability strategy that actually wins over time.
As I tested different variations of this strategy, it became clear that the key was to keep the amount of capital required low with lots of upside potential, but high enough that the position has a chance for success. Also, this is a trade that works best when the trade is closed for a win and not held to expiration. It also does best with low implied volatility in a bull market.
There’s a lot more upside than downside for an out of the money call spread.
Buying a spread helps compared to buying a single out of the money call, because the sold call has similar Theta decay to the long call and counters the biggest reason for quick losses from buying calls.
With a little time and early management, this trade has a history of an actual positive average profit, even though the probability of profit from a single trade is well below 50%. Big wins can outpace a larger number of small losses. Read the detailed post about this strategy to find out the specifics to success with this trade that goes against virtually every concept I tend to advocate for.
The Call Back Ratio
In front ratio spreads, usually the goal is to sell more options than what is bought to have lots of decay protected a hedge of a long option. Front ratios are so much more common, that most people just call them ratio spreads and don’t even consider an opposite version, a back ratio.
A back ration spread involves buying more options than selling to take advantage of a big market move. With a call back ration, we may for example buy two calls and sell one call. If the market goes up, the two long calls will make more money than the short call will lose. The disadvantage is that Theta (time decay) can be a big problem. So, I have two variations of this trade that I use that somewhat counter this problem, but not completely.
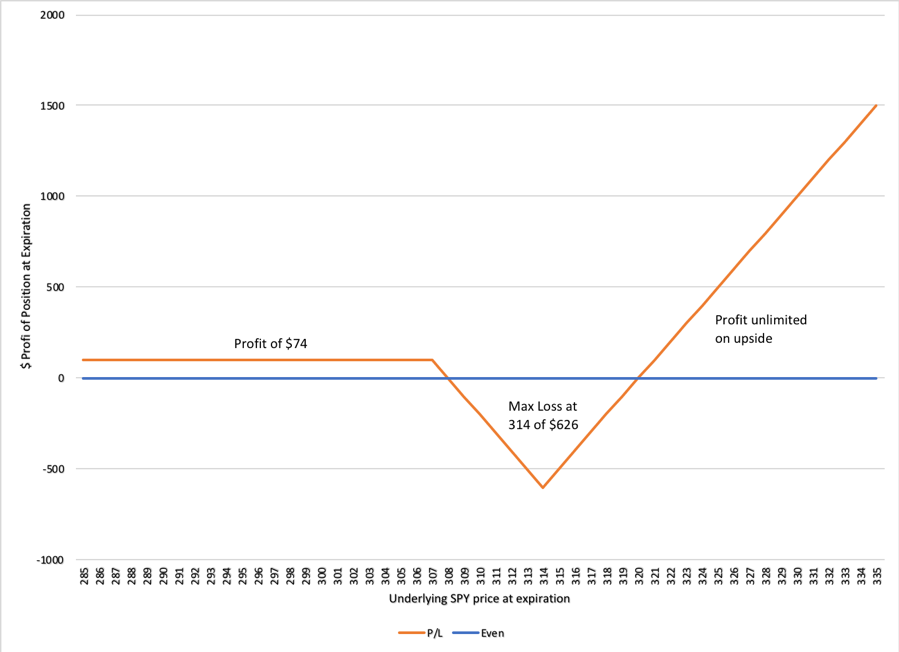
A Delta neutral back ratio call spread is created by selling a call and buying two calls with exactly half the Delta of the call that was sold. The net Delta is zero, and the trade should net a credit- a trader is paid to enter the position. If both call strikes are out of the money, like when selling a 30 Delta call and buying two 15 Delta calls, it is very possible that the position will expire with everything out of the money and worthless, so the trader keeps the premium. If the market goes way up, the long calls will start to overcome the value of the short call with unlimited profit potential. Sounds great, doesn’t it? The downside is that the trade could end up with the short call in the money and the long calls out of the money worthless, so the trader is stuck with a loss quite a bit bigger than the credit received to start with.
A Delta-neutral call backspread makes money at expiration in a flat to down market or a big move up, but loses in a small move up.
An almost opposite variation flips the position of the long calls to make the trade a net debit and create the equivalent of 100 shares with zero extrinsic (time value). I picked up this concept on TastyLive.com. The Zero Extrinsic Back RAtio trade, or ZEBRA, buys two 75 Delta calls and sells one 50 Delta call for a net Delta of 100, or the equivalent of 100 shares of stock. The extrinsic value of these positions tend to cancel each other out, with twice as much time value in the short call as each of the long calls. So we get the movement of 100 shares of stock for a fraction of the cost and no extrinsic value for the position. In many ways this is a lot like the stock replacement discussed earlier.
The zero extrinsic value is a little deceptive in that the extrinsic value doesn’t decay equally. The extrinsic value of the two long calls decay faster than the extrinsic value of the short calls at the money. So, in the short term, Theta is negative, and we still need the market to move up to make money.
Beginning option traders like to buy calls to start their option trading, and over time often learn the advantage of selling options and probability. But there’s a reason that long trades involving calls exist- the market goes up more than it goes down. We need strategies that use call trades to benefit from market moves up without experiencing huge amounts of time decay, or huge swings in positions. These 5 strategies provide some choices to get in on a bull market with calls. Share your favorite bullish call trades in the comments.
Over the years I noticed that when I sold a call spread that was supposed to be profitable, those spreads seemed to lose money often, and often lost a lot. One thing I’ve learned in trading is that if a strategy you use continually loses, try doing the opposite.
Buying an out of the money spread seems counter to every theoretical calculation a person can do. The probability of expiring in the money is low by definition and time decay is our enemy big time. But, over the years I noticed that when I sold call spreads that were supposed to be profitable, either alone or as part of an Iron Condor, those spreads seemed to lose money often, and often lost a lot. One thing I’ve learned in trading is that if a strategy you use continually loses, try doing the opposite. So, here we are. I’ve done a lot of back-testing and trading my own positions to come up with a low probability strategy that actually wins over time.
Just to be clear, this trade can be named a lot of different things. Some may choose to call it a bullish or bull call spread because it benefits from prices going up. Others may call it a debit call spread because a trader pays a debit to get into it, versus a credit spread where the trader collects a credit. So, it’s a debit spread, a bull spread, and it means we are buying one call and selling a less expensive call.
As I tested different variations of this strategy, it became clear that the key was to keep the amount of capital required low with lots of upside potential, but high enough that the position has a chance for success. Also, this is a trade that works best when the trade is closed for a win and not held to expiration. It also does best with low Implied Volatility in a bull market.
In high Implied Volatility environments, options are expensive, and it is hard to justify buying them. A big move is needed to make up for the large amount of premium paid, and time decay eats away at the position.
In low Implied Volatility environments, the cost of options is low, and strikes with fairly low deltas are often inside the Expected Move. This is much more true for calls than puts, due to skew. So, for not much cost, we can get into a position that often out performs its probabilities. And with active management we can greatly improve the long-term profit and loss.
Why buy a call spread and not just buy a single call option, you might wonder? Two reasons, cost and time decay. Buy selling a lower probability call, I can significantly reduce how much I pay for the position, but see an even bigger decrease in Theta, the Greek variable measure for daily time decay.
A key relationship to know is that the Delta values of the two options in the spread give a relative calculation of the value of the spread. The average of the Delta values taken as a percentage represent roughly the percentage of the spread width that the premium is worth. A call spread of a 30 Delta call and a 20 Delta call will have a premium value of about 25% of the width of the spread. So, if the strikes are $2 apart, the premium will be approximately 50 cents. The percentage is usually a little closer to the Delta of the higher Delta strike due to skew, but as a rough estimate, the calculation works well. Why would we care? Because if we double our Delta values, we double the value of our premium in a spread. That will be a key theme for this particular trade.
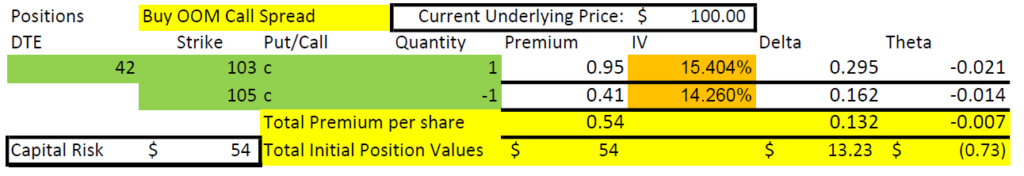
Call Spread Set Up
Here is the set up of my preferred strikes for an out of the money call spread. I try to open this trade with somewhere around 6 weeks until expiration so that time decay isn’t too bad and I have plenty of time to manage the position. Like most option trades, I choose my strikes based on Delta values. For this trade I look for a call to buy that has a Delta value in the 20s, and a call to sell with a Delta in the teens. I want the difference in Deltas to be somewhere between 10 and 15.
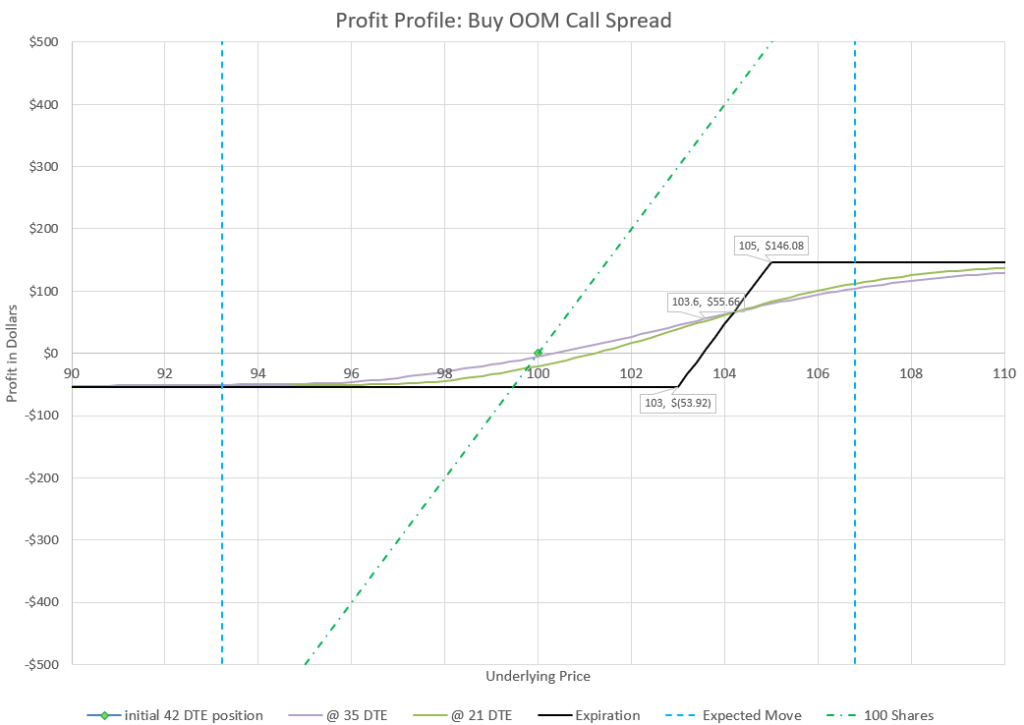
Let’s look at an example of a stock or ETF currently trading at $100 per share. I find that the 103 and 105 strikes meet my criteria with 42 days until expiration. The Delta values are 29 and 16, a difference of 13. The premium is 54 cents, or 27% of the $2 width between the strike prices. We are closer to 29 than to 16 as a percentage value. Our short strike has 2/3 of the Theta decay as the long, despite being less than half the premium to start, a contrasting relationship to our advantage. The net Delta of 15 also represents that we have the equivalent of 15 shares of stock, but instead of paying $1500 for them, we only pay $54.
There’s a lot more upside than downside for an out of the money call spread. The key is to avoid expiration and limit time decay.
Looking at the profit chart, most analysis of this trade by others would focus on the expiration values, and note that at expiration we need the price to rise to around 103.54 to just break even. That’s true if the trade is held to expiration. But look at the colored curve lines that represent the value at different stock prices in a week or in three weeks. Those lines don’t need much of an increase in price to be profitable, and hold decent value in a small downturn as well. These curves are the secret to succeeding consistently with this trade.
The curved lines also bear out that Delta tells us how much we make or lose based on a dollar change in the underlying stock. We should make or lose about $15 for a dollar move in the stock price, and we can see from the 35 DTE curve that this is about what we’ll get.
Finally, notice that the colored curved lines of profit and loss don’t drop very far below the starting point of zero profit at $100 stock price. This is because there is only a small amount of Theta or time decay at the beginning of the trade compared to the days that come as expiration nears. Our goal will be to avoid the times when time decay kicks in.
We also would like to act based on the part of the curve that is better before expiration than at expiration. If we hold until our position is in the money, Theta switches and moves our profit toward the maximum at expiration. But the probabilities are that we won’t see these positions go into the money and Theta will be taking money from us in ever increasing amounts every day.
Managing the Out of the Money Call Spread
Like most option trades, I like to evaluate the trade with three possible management tactics, hold, fold, or roll. Holding to expiration lowers the probability of success, but might make sense if the market jumps up shortly after entering the trade. Folding or getting out early isn’t a bad strategy to lock in gains or limit losses with this trade by using limit orders. Rolling out regularly is best if the goal is to stay in the trade for the long haul. Let’s take these one at a time in more detail.
Holding a Call Spread to Expiration
Call Spreads are an interesting contradiction in the way Theta decay works. Theta either works for the trade or against the trade, and it can switch depending on whether the trade is in the money or out of the money. Theta is driving the value of the trade toward either zero or maximum value. When we own a Call Spread, Theta works against positions out of the money, but works for positions in the money. Since this particular version of the trade starts with strikes well out of the money, we need the underlying price to go up in a substantial way to make money.
The best time environment to trade this strategy is when IV is low and markets are rising. So, a nice move up can often happen. When it does and the position is in the money, the call premium will be less than maximum profit because the two call options have different levels of extrinsic (time) value left. We can hold the position until expiration to get the last bits of decay and get maximum profit. The risk is that the price can also reverse back out of the money and make the call spread decay toward zero value. For this reason, this is a trade that I don’t like to hold to expiration, I like to get out with a big profit, either with a profitable limit order, or rolling to a longer duration while taking profit.
If the market goes down instead of up, I think it makes even less sense to hold, because the probabilities will have gone down for profit, and the remaining premium will decay even faster. A turnaround to get into the money is needed and there probably isn’t enough time. So, I’d again fold or roll.
Folding with Limits
Many traders like to use limit orders to cash out wins, or limit losses. For traders that are inclined to use limits, this call spread trade set-up has some natural places to get out. Since the upside is higher than the downside, but the probabilities are that the trade loses more often than wins, we need to make sure that wins are much bigger than the losses. One easy natural limit is to take a win when the position doubles in value, or fold for a loss when the position is cut in half. Doing this means we need win better than one out of three trades to make a profit over time on the trades that close on a limit. Let’s look at each scenario, plus the scenario of hitting neither limit.
This trade starts with a long call that has somewhere around a 25% probability of expiring in the money. But it also has about a 50% chance of a touch- the price reaches the strike price sometime before expiration. Depending on exactly which strikes we started with in our call spread, our initial premium is likely 20-25% of the width of the spread, as we discussed earlier, based on the Delta of our two strikes. That means we need the width of the spread to move up to 40-50% of the width of the spread to double in value. Getting our long strike to go in the money, even briefly, should do the trick. Are you with me on the logic and statistics here? Based on all these assumptions, we have somewhere around a 50% chance to double our money on this trade at some point before expiration. But we don’t have a 50% chance to expire in the money. So, if and when it happens, the logical thing to do would be to take the money and run.
Wait, isn’t there some old trading rule that you are supposed to let your winners run and stop your losses? If we close for doubling our money, we give up the chance to get triple or hit max profit. Yes, but with options, time is limited. Markets go up and down, and nobody knows what will happen next. When we get a big win, it makes sense to take profit before it evaporates, and then don’t look back. Usually by the time we hit double our initial premium, a lot of time has passed and there isn’t that much time left in the option, and the probability of making more is still no better than 50/50. We started with a low probability trade, and have a shot to double our money 50% of the time, let’s take that.
A couple of additional factors to consider. Theta decay increases as the trade goes on, so if we can get out early before Theta has a big impact, the big decay at the end can be avoided. Second, one assumption going into the trade in a low Implied Volatility environment is that we are in a bull market, which actually helps our chances of a win.
What about limiting the loss? If we enter a stop limit at half the premium collected, are we giving up too early? Looking at our initial Deltas and how that relates to the width of the spread, our call spread will lose half its value if our Deltas drop in half. Whether that happens due to a downturn or due to time passing, the probabilities of a winning trade or especially doubling the initial value of the trade decline significantly, and the probability of the trade expiring worthless if left alone will have increased significantly. So, the idea is to cut our losses and save some of our capital for another day. Additionally, Theta decay is only going to increase and quickly doom the trade to zero if we don’t exit.
If we enter this stop loss limit order, how often will it execute? Somewhere close to 50% of the time, maybe a little more. But we can’t have a profit limit order executing 50% of the time, and a stop loss limit order executing over 50% of the time. That would be over 100% of the time, and we haven’t even talked about a third possibility. The issue is that if we use a stop limit, some of the occurrences that we are stopped out on are situations where we would have doubled our money if we hadn’t been stopped out. So we actually reduce our odds of doubling to less than 50% with a stop loss, but not a whole lot, because to go from a 50% loss to a 100% gain would take a 4x gain from that low point, a low probability, but not zero.
Let’s look at the math. If our long call Delta falls to the 12-15 range, our chance of that strike being touched would then be 25-30%. But if that situation happened in 50% of our total occurrences, we would be giving up 12-15% of our occurrences that are destined to win, so now our doubles are 35-38% of all occurances.
There’s a third possibility with our fold strategy. We could have neither limit order execute and the trade expire somewhere between losing half and doubling. This is a fairly low probability with the two limit orders in place, because as expiration nears, the trade gets more likely to move toward max loss or max gain. To expire between the long call needs to expire in the money and the short call out of the money. And the position would have to have crept into that position and been very stable especially in the last few days to not trigger either limit order. The probability of this happening are difficult to calculate, but will be well under 10%, maybe less than 5%.
If the trade gets close to expiration and hasn’t triggered a limit, it might be a good time to consider closing early to reduce drama and hopefully collect a profit on the trade. But again, that will change the overall probabilities slightly.
With the bull market on our side, let’s assume we can double our initial premium 40% of the time, stop loss limit out 55% of the time for a 50% loss, and hold on somewhere between to expiration 5% of the time. If these probabilities held up over time, we’d average a 13% gain on this trade.
For these probabilities to play out in actual results, a trader would need to trade the same amount in dollars or in number of contracts each trade. So, set aside the winning amounts to use for making up for losing trades. It’s likely that there would be many winning trades in a row, and many losing trades in a row. Having a variable amount of cash to both compensate for losses and bank winnings would be critical.
Alternatively, letting the size of the trade double or be cut in half based on the result of each previous trade wouldn’t work. Since there are more losses than winners, the account would get cut in half more often than it doubled, and eventually be cut to essentially no value.
Thinking about this way of managing the trade over time and the implications of huge wins and huge losses, this management tactic seems pretty extreme. It provides very extreme volatility, even if a trader consistently trades the same amount of capital trade after trade. As such, this would only make sense as a very small portion of a portfolio.
Continually rolling a credit spread
If you’ve read very many other trading strategies I’ve written about, you’ll know I generally like the concept of rolling my option trades. Rolling is the concept of closing an existing trade and opening a similar trade at a later expiration and/or different strike prices. In most platforms, this can be done in a single simultaneous transaction, so that the net result is clear- is the trade collecting a credit, or paying a debit to re-position?
With a debit call spread (a spread that we are buying), we can still collect a credit to roll from one position to another. This is because we can sell a call spread that has increased in value to buy a cheaper spread that is further out of the money. If we roll to new positions over and over, and the total of our credits are more than the total of our debits, this is a winning management tactic. Both back-testing and my experience show that this tactic works for this trade most of the time, particularly in bull markets.
I like to set up a trade like we’ve used as an example earlier in this post with 42 days to expiration, and then roll after a week. After a week, time decay is relatively small, and a price move up in the underlying of a percent or two makes more than a price move down of a percent or two loses on the trade. The longer the position sits, the more time decay moves the profit curve down, requiring a bigger up move to be profitable. If the market chops up and down, the trade can eke out a profit over time. The reason is that there is much more upside than downside because of the strikes that were chosen to start the trade. But, because the underlying market is bullish, the wins should be more frequent than losers, which really makes this strategy work over time.
Let’s take an example. We buy the call spread in our example for $54 with 42 DTE. After a week the stock is up 2% and our position is worth $80, a $26 gain. We roll this trade by selling our now 35 DTE call spread for $80, and buying a new 42 DTE call spread for $54 again, but now at $2 higher strikes than the week before to have essentially the same Deltas as the position we started with a week earlier. We collect a credit of $26.
A week later, the stock goes down 1% and our call spread is worth $34, a loss of $20. We roll out to 42 DTE again, and this time pay $20 to buy more expensive strikes at $1 lower prices. Now, we have a total of $6 collected from our two rolls.
The next week, the stock jumps 3.5% and our call spread is now worth $110. We roll our position out again to 42 DTE and buy higher strikes for $54, a net credit of $56. Now, we have $62 collected.
The next week, stock drops back 4.5% to our starting price of 100 and our call spread is only worth $3. Ouch- a $51 loss! But, we roll back to 42 DTE and our original strikes paying $54, paying a $51 debit.
After 4 weeks with a stock going up and down and ending in the same place, we have collected $11 total on a $54 use of capital. That’s a 20% return on capital on a stock that didn’t move.
But, we haven’t accounted for broker commissions. At 50 cents a contract, that’s $2 each week, or $8 for 4 weeks, most of our profit. So, we might want to look for stock that has a little higher price where the commission is less of a percentage of the likely profit.
We also expect the market to trend up in a bull market, so that winning weeks outnumber losing weeks.
The advantage of rolling and staying well away from expiration is that we avoid the rapid decay near expiration and we achieve much of the same result as the previous “folding” limit management tactic with constant trade size, but in a more disciplined drum-beat approach. We aren’t tempted to bump up our trade size or cut it way down, because we are just rolling the same number of contracts out week after week, adding or subtracting cash as we go.
From a practical standpoint, each week we have to evaluate what the right strikes to choose are. I try to maintain the same width, but then look for Delta values that meet my criteria. The higher the strike prices, the further out of the money the strikes are, and the lower the cost and the lower the Deltas. I can maneuver around a little to make my new position cheaper than the one I’m closing and collect a credit.
Also, if we have a big move in less than a week, I may choose to roll up my strikes in the same expiration to bank my profit and limit the downside in case of a reversal. In our example, if the stock price went up $4 in a couple of days, I’d roll up my strikes $4 and collect $65 to get my Deltas back to the starting range.
Why this Delta range works
Delta is a very handy measure for options. And for this call spread trade, its many uses really illustrate how this trade works. For call spread, we can take the combination of the Delta value of the two call options to get a net Delta value. In this example, with Deltas of 29 and -16, the net Delta is 13. (Call Deltas are positive. Owning a call is positive Delta, being short is negative Delta.)
If we look at Delta’s definition as a relation of change in price of the stock to change in price of the call spread, we can see that if the stock goes up $1 in price, our call spread premium goes up 13 cents, or $13 for the full contract. As a representation of equivalent stock, 13 Delta means we have the equivalent of 13 shares of stock.
Now, we could have this same price movement and share equivalent with any number of call strike price combinations. We could have bought a 50 Delta and sold a 37 Delta, or bought a 93 Delta and sold an 80 Delta and had the same behavior. 13 Delta is 13 Delta. So, what is the difference?
Remember, Delta is also a measure of probability and value of a spread. Both of these are tied to the individual Deltas more than the net Delta. Probability informs us of what is likely to happen to each option if held to expiration, or how likely it is that the stock price will touch the strike price before expiration. These probabilities inform our management of the option, as we’ve discussed earlier in this write-up. If we chose different strikes, we’d probably want to consider management tactics differently to optimize the trade.
But the real key is the relationship of Delta as a measurement of the value of the spread. Earlier, we mentioned that the average Delta of the two options in a spread roughly approximates the premium when calculated as a percentage of the width of the spread. Sounds complicated, but not really. In our example, our strikes are 103 and 105- the width of the spread is 2. The average of our Deltas is 23.5, so we should expect premium to be around 47 cents (23.5% of $2)- it’s actually 54 cents, but close enough for a rough estimate.
The value of our call spread can vary anywhere from 0 to $2 by expiration, so there is a lot further to go up than to go down. Picking lower delta strikes limits our downside, but gives us lots of upside. That plays out over time with this trade, as long as we don’t plan on holding on too long.
If we chose strikes deep in the money, we’d be virtually guaranteed to expire in the money, but our profit potential would be very limited, while our potential loss would be high. I think there are better ways to use deep in the money calls like a stock substitution strategy using calls, or a poor man’s covered call.
At the beginning of this writing, I mentioned how initially I used to sell call spreads, but realized I was consistently losing money. I looked at a lot of different ways to trade the opposite, to buy call spreads instead of selling. One tool I use for analysis is back-testing. As commercials like to say, “past results is no guarantee of future earnings,” but with big samples back-tests can provide a clue as to what works more often than not. I back-tested a wide variety of call spread values at different Deltas, different expirations, different management strategies, and different market environments before settling on this variation. I’ve traded it a lot myself with good results.
The example I’ve used in this writing is a little closer to the money than I’d ideally prefer. A little further out of the money would get the premium more around 20% of the width, which would cost less to start. The net Delta is fine, but if there were more choices, I might make is slightly less. Wider spreads are good for selling spreads, narrower is better for buying spreads, due to Theta differences.
Can we get too far out of the money, or too narrow? Yes, at some point the premium we pay and the potential profits get too small compared to the commissions and fees required. So, small spreads on cheap stocks may not make enough to pay for trading costs. And for those that might get options trades for free or close to free, there is still the cost of bad fills if an option is not extremely liquid.
This isn’t to say that other variations won’t work. There are pros and cons to every element of this trade. The differences in returns and risk can be adjusted many different ways. I’ve tried to illustrate the trade-offs so each trader can make their own informed choice.
Assignment Risk
One factor we haven’t discussed yet for buying call spreads that can’t be ignored is the risk of having a short call exercised while still holding the long call. As with other strategies that have an element of selling calls, there are some call assignments that can be avoided and some that can’t.
There are three situations that greatly increase the chance of a short call being exercised by the buyer. They are having a call in the money, having a call near expiration, and being short a call when a stock goes ex-dividend. The good news is that the way I execute this trade, these factors should rarely come into play.
First off, the short call is much less likely to end up in the money than the long call. If we start by selling a call with less than 20 Delta, it has less than a 40% chance of having the stock even touch its strike price.
My plan is never to hold until expiration, so that part of the assignment risk is mostly avoided. For those who hold in the money spreads near expiration to try and get max profit, this is a double dare to the buyer of the trader’s short call to exercise early. So, someone who holds a winning trade until expiration shouldn’t be surprised to wake up short 100 shares of stock instead of being short a call option.
Dividend risk is probably the hardest call exercise to avoid, but the key is to have a short call with more extrinsic or time value than the anticipated dividend, and have strikes further out of the money than the dividend. If a trader can do that, there is no reason for a call owner to execute from the other side of the trade. The easiest way to keep a high extrinsic value lines up with the other tactics- get out of positions close to the money and keep expiration away by closing or rolling anything with short duration.
As I’ve explained in other write-ups, having a short option assigned/exercised isn’t that big of a deal to undo, especially when it is part of a spread. A trader may wake up and find a large amount of short stock and a large amount of cash that wasn’t in the account the day before, but that’s what happens when shares that you don’t have get called away. In this case, the intrinsic/in-the-money portion of the long call will always be worth more than the intrinsic value of the short call, so the long call can be sold and the short shares that were assigned can be bought back, all in one transaction, for a tidy overall profit.
Final Thoughts
Buying a call spread like the trade discussed here should not be the core of a portfolio- the trade is simply too volatile for anything other than a way to supplement returns in appropriate market conditions. But, as used as a part of broader portfolio of trades, it can be a way to take advantage of a bullish market with low Implied Volatility. Buying calls out of the money doesn’t have to include a lot of decay. Using a spread reduces the time decay and makes what would seem like a losing trade show profits over the long haul.
if we sell a call against our stock equivalent we can have a low cost equivalent of a covered call, in other words a Poor Man’s Covered Call. One difference is that our long calls have decay, and we want to counter that decay by selling calls with the same or more decay in our favor. A great way is to create a diagonal spread, selling calls that are closer to expiration while buying calls that are further away.
Covered calls have a number of trading advantages- they reduce volatility, provide some income, somewhat cushion a position from a fall. But, to have a covered call, you have to own stock first to sell a call against it. However, we have discussed the idea of using long calls as a substitute for stock, so if we sell a call against our stock equivalent we can have a low cost equivalent of a covered call, in other words a Poor Man’s Covered Call.
One difference is that our long calls have decay, and we want to counter that decay by selling calls with the same or more decay in our favor. A great way is to create a diagonal spread, selling calls that are closer to expiration while buying calls that are further away.
By selling a call with faster decay against our long call with slower decay, we can actually get a trade that has a greater than 50% probability of profit. The trade-off is that we limit the upside. The trade has defined risk and defined maximum profit.
My typical setup is to buy a 75 Delta call about 12 weeks out and sell a 25 Delta call about 6 weeks out, or half the time. If we look at a chart of each of the options profit potential along with how they compare to just owning stock, we get a bit of a complex chart:
In this chart we have two options with their own profit profiles at expiration. But, since they don’t expire at the same time, it is more important to see how they will perform at a certain point in time, like half-way to expiration for the shorter duration short call. After 21 days, the short call profit profile hugs the expiration profit profile much closer than the longer duration long call.
The key thing when looking at diagonal spread positions is that we really can’t think that much about expiration, especially for the long duration portion of the trade because it expires later. So, we really have to pay attention to how the projected values will behave at different points in time prior to expiration.
Another thing to notice is that the short call we sold has a strike price much closer to the current price than the long duration call. This means that there is more potential downside than upside, but that’s true with a regular covered call as well, actually even more so. At least our downside on this trade is limited.
When we put it all together in a chart, we can see how the trade profits not only when the market is up, but when the market is flat as well. Profitability with no underlying price change is due to the faster decay of the shorter duration short calls.
Notice the 21 days in trade profit line is profitable even in a slight down move.
Looking at the overall Delta of this trade, it opens with a net Delta of 50, or the equivalent movement of 50 shares of stock. So this position is half as volatile as owning 100 shares of stock for a cost equivalent to about 7.5% of owning 100 shares.
From a profit standpoint, our capital required was $750 and the maximum profit is $250. This shows how much upside we’ve given up by selling the call, compared to unlimited upside with the call alone. However, if we look at a “sweet spot” on the profit chart above, we can see that if price goes up from 100 to 102 in 21 days, the profit is around $150, a 20% return on capital for a 2% move. In comparison, a 2% price move on the earlier long call option only would yield about a 7% return on capital, and owning stock outright would net the owner, well, obviously 2%.
Managing the Poor Man’s Covered Call
How do we manage a Poor Man’s Covered Call? Generally, there are three ways to manage positions like this: hold, fold, or roll. Let’s take them one by one.
Hold means we just hold until expiration. But, remember these options expire at different times, so we could hold until the short leg expires and close the long. We’ll get good Theta decay and not really need to pay much attention. Probability of profit is over 50%, so it’s a viable strategy. However, if we let both options expire independently, we can see from the expiration profit chart that we need an increase in price to be profitable, so we do need to get out of the long call before expiration, preferably when we exit the short call.
Folding or getting out with an early exit isn’t a bad choice either. We can set a profit target, say half the maximum profit and set a limit order and also have an equal stop loss or slightly larger stop loss, and let the trade play out. Probability is over 50%, so hopefully we catch a modest up move and miss any big down move, collect a nice profit, and move on. As a short term strategy, this can be a good approach, especially if we were to set up a ladder of ongoing versions of this every few weeks and just let each one play out individually.
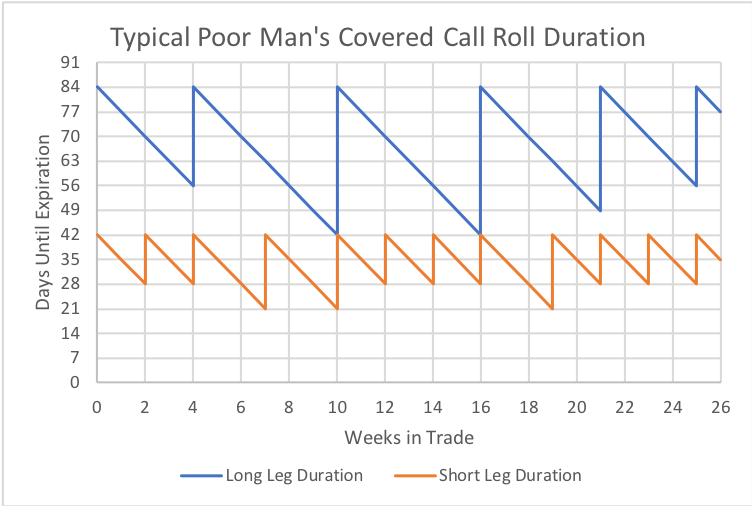
If you’ve read much of the other parts of this site, you know that I tend to favor rolling strategies, often continuous rolls. I like to roll positions out in time, over and over, adjusting them up or down with the market. Generally, the plan for this trade is to actively manage the short duration leg more than the long duration leg, but keep the long duration out in time and the short duration around half the time as the long, give or take a bit.
Here’s an example of rolling a position that starts with a short call at 42 days and a long call at 84 days. Typically, the short leg will get rolled more often, since it is decaying faster and is more prone to changes in Delta value and its premium.
In the chart above, I’m illustrating the concept. The idea is that every two to three weeks the short leg gets rolled out in time. Well, which one is it, you might ask, two or three? I would look at it based on criteria, if the short has gotten way out of the money, say below a 12 Delta in two weeks, I’d roll out and establish a new 42 day position and collect a net credit. Or, if the short strike is being tested and has moved to a Delta of 40 or more, I’d roll out and try to reduce Delta and collect a credit in the process- it’s easier to roll a single short leg for a credit than to roll a spread, so I should be able to improve my position in the process. If however, the price keeps Delta between 12 and 40, let’s just keep collecting Theta and wait until 21 days left to roll. At that point, we roll out to 42 days again and pick a nice strike and get a nice credit for our effort.
For the long call, I mostly just leave it alone. I let it do its thing until it gets down around 42 days and kick it back out to 84 days. If the market is up, I can move the strikes up to 75 Delta and get a credit. If the market is down, I’ll have to pay to roll out. If there is a really big move one way or the other, I can roll out at the same time I’m repositioning the short leg.
Managing Big Moves
So, we can set up rules to guide our rolls and generally just let the data from the market dictate our actions. The only other thing to consider is what to do if the price jumps way outside our strikes? With individual stocks, this is a clear possibility, so there needs to be a plan. On a huge jump up, the choices are to close for a max profit and move on figuring that all the good news is priced in, or reset with a roll to new strikes in anticipation of further up moves. On a huge down move, we can close out both sides for whatever premium is left on the long call if it looks like the bottom has fallen out for good, or just hang on to the long call and hope for a reversal, maybe selling a new call at the same price to cushion the blow. There’s no right answer, just the right answer for each trader’s personal tolerance for risk. But, every trader needs a plan. The one strategy that many traders take by default is to cash in small gains and hang on to big losers, which pretty much guarantees a losing portfolio over time.
Overall considerations
Is there any magic to 84 and 42 days? Not really, it’s just a time frame that I find fairly manageable without a lot of stress, but with plenty of premium to collect on the short side of the trade. Longer durations have less stress, and shorter durations are more volatile with more potential profit. It’s a choice that depends on your trading preferences and risk tolerance. Many traders of this strategy like to go to much longer durations with their long strike, to six months or even a year, to keep Theta less, but the trade-off is that the cost and downside risk is more.
Similarly, is there magic to 75 and 25 Delta? Not magic, but the goal is to have more decay in the short strike than the long, so equally distant Deltas at different expirations should achieve that. Many traders will buy call strikes deeper in the money to make this advantage greater, with the trade-off of a higher premium cost and having more more capital.
Between time to expiration and the Deltas chosen, we can significantly adjust Theta of our long strike. We can also greatly control the amount of capital required for the long call, from around 5% of the cost of stock to 20%. Understand that this is the trade-off, capital cost and downside risk vs. decay. The ultimate extreme is going back to a covered call, where we own stock instead of a call. Buying a call instead saves capital, and also limits the loss. So, in choosing the long side of the strategy, consider the choice of time and Delta as part of a continuum of risk and reward.
Trade Sizing: Leverage and Risk
Finally, remember that just because a poor man’s covered call has less capital required than a standard covered call, it doesn’t mean that it is a good idea to do 10 poor man’s covered call positions instead of a single covered call. Just because a trade is affordable, it doesn’t mean it is a good idea to bet the farm on it. The poor man’s covered call is a trade of leverage. It can be a trade to reduce volatility or greatly enhance volatility.
Let’s look at our example trade on $100 underlying stock on a $10,000 account. We could buy 100 shares of stock for $10,000 as a base case and use all our capital and we have market risk all the way to zero with a Delta value of 100.
If we set up one contract of the poor man’s covered call like our above example, we risk $750 and have the equivalent of 50 shares of stock, so much less volatility and downside risk, while still controlling a notional 100 shares through our contracts. Our loss is limited to $750, which will occur if we hold our long to expiration with a stock price change of more than 7%. This becomes a very conservative trade compared to owning stock or a traditional covered call, if we keep the rest of the account in cash.
If we trade two contracts, we have 100 Delta in total portfolio for a cost of $1500. At this point, our volatility is the same as 100 shares at the current price. However, our loss is limited to $1500, not $10,000 like stock. But now, we lose 15% of the account value on a 7% down move as we are controlling 200 shares of notional value through 2 contracts. We also get double the benefit to the upside compared to one contract. We also get double the Theta of a covered call, or a single contract of a Poor Man’s Covered Call. So the trade acts like stock when the price stays close to the opening price, but shows some leverage on moderate price moves. Arguably, one could say the extra benefits of leverage are worth the potential added risk to the downside- we still are only risking 15% of the account value, not all of it.
What if we take the trade to an extreme? We can easily do 10 Poor Man’s Covered Call contracts for $7500 cost. Our Delta increases to 500, so we get 5 times the movement of owning 100 shares, and our ten contracts now control 1000 shares of stock, a notional value of $100,000! With all this leverage, we get huge Theta. We also get a lot of volatility. If the stock goes up 1%, we make 5%, but the downside is the opposite. The big risk is that we can now lose 3/4 of our account if the stock goes down just 7%. Now we’ve made this trade into a virtual roulette wheel, big wins or big losses. Our probability of profit is still over 50%, but we’ve taken on a huge risk. Our max loss is a move down of just one standard deviation, which is not that unlikely. In fact, if we trade like this for very long, we will surely hit max loss within a small number of trades. We can potentially limit worst case scenarios by cashing out when the going gets tough, but that goes against natural instinct and can be hard to follow as a plan. The bottom line is that this would be a clear example of way too much leverage.
The point of these capital use examples is to show that a trader has to really understand the advantages and risks of leverage in a trade like this. The same trade can be very conservative, or extremely risky, depending on the context of the account it is in. So it is up to each trader to evaluate how the combination of trades affects the performance of the full account. You can read more about these concepts in my write up on Portfolio Management.
Assignment Risk
Since the Poor Man’s Covered Call involves selling calls, there is always the potential for those calls to be exercised by the buyer. With an actual Covered Call, the exercise means the covered shares are sold to fulfill the contract. But with a Poor Man’s Covered Call, there are no covered shares, just a long call in the money. Assignment in this trade means that the account has to sell shares that aren’t in the account, so the account holder will end up with short shares plus cash from their sale.
From our example we have been using, let’s say that the stock goes up to $105 and the short call of our position gets exercised by the owner of the call. We wake up the next day with -100 shares of stock and $10,300 added to our account. And we still have our long call contract well in the money. It’s a mess. A lot bigger mess than just having our long stock sold, because there are more moving parts. But it’s a good mess, because our positions have made a nice gain, especially our long call.
We can untangle our mess by buying our short shares back. We can also sell our long call at the same time to get a clean slate and then decide whether we want to open new positions at Deltas that are closer to where we’d like to be. So it isn’t that hard to straighten everything out.
In my write-up on Covered Calls, I wrote a long section on how to avoid assignment. The discussion is the same for this trade, so I won’t repeat it. Read the Covered Call write-up if you want to explore those tactics. There’s really less concerns about assignment with a Poor Man’s Covered Call because eventually the long call needs to be sold or rolled and the combination of the two can be re-positioned together if needed.
Final Thoughts
The Poor Man’s Covered Call has a lot of advantages compared to owning stock and selling calls. The trade provides a bullish outlook with positive Theta decay, while limiting risk to the downside. It typically has a greater than 50% probability of profit, while being a debit trade, which is rare in options trading. The trade does provide leverage, so care must be taken in managing the size of the position within any account.
Selling put spreads is a fairly simple trade that can generate one of the highest returns on capital of all option trades. The trade is fairly flexible to adjust for higher returns with higher risk, or more consistent, but lower returns with lower risk based on choice of duration until expiration. While I’ve written about put spreads in detail before, I recently did some additional studies to see if my earlier conclusions on best Delta values for entry were still accurate.
I’ve noticed from Google Analytics that many traders are searching for the answer to “What are the best Delta values to use for selling put spreads?” or some variation. While I think my earlier webpage on put spreads covers that fairly well, there have been enough people question me, and enough questions pop up from my own trading to cause me to go back and dig into the data a little deeper. The quick answer that I usually give to anyone on Delta values for a put spread is to sell the put strike with a 20 Delta value and buy the strike with a 13 Delta value. This optimizes position Theta, and also provides a nice, relatively high probability of profit. But is that answer true if the expiration timeframe is short, like just a few days, or really long, like several months?
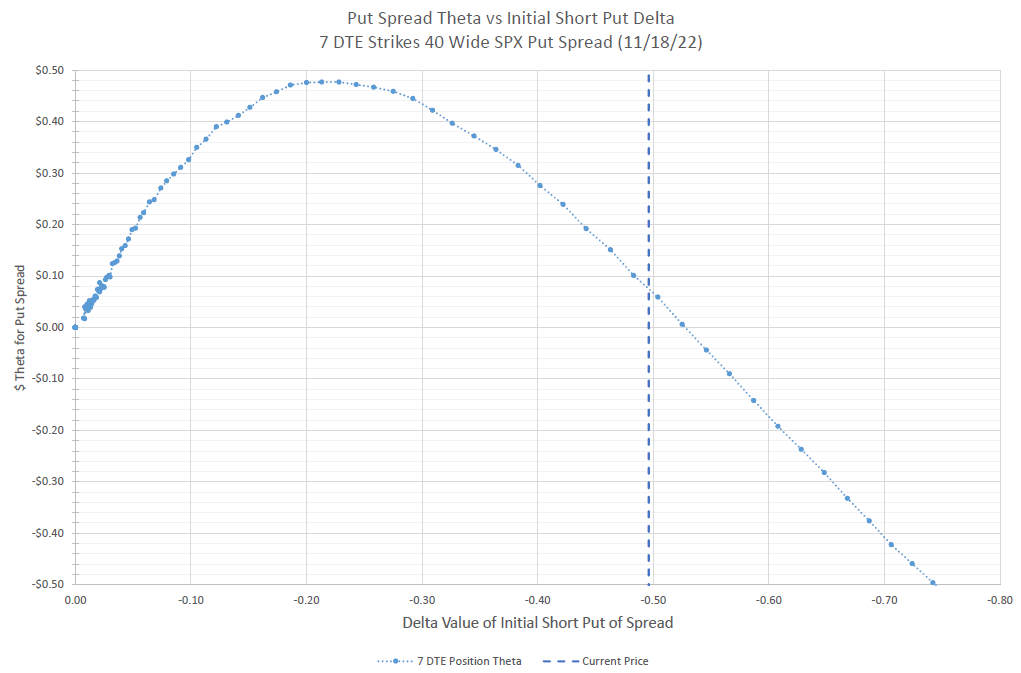
Readers likely have a hint at results from the featured chart image at the top of this post. I decided to look at all the possible Theta values of short put spreads at different strikes. For the first example, I looked at 7 days to expiration (DTE), and chose 40 point wide spreads on SPX, the S&P 500 index. SPX is generally my go to choice for options on the S&P 500, but as I wrote in another post, there are lots of different ways to trade options on the S&P 500. So, the graph shows the Theta value relative to the Delta value of the short put of the spread of all possible 40 wide put spreads, expiring 7 days from November 18, 2022. The chart shows a very smooth curve peaking around 22 Delta.
This chart shows all possible short put spread combinations around the peak Theta values as a percentage of the spread width.
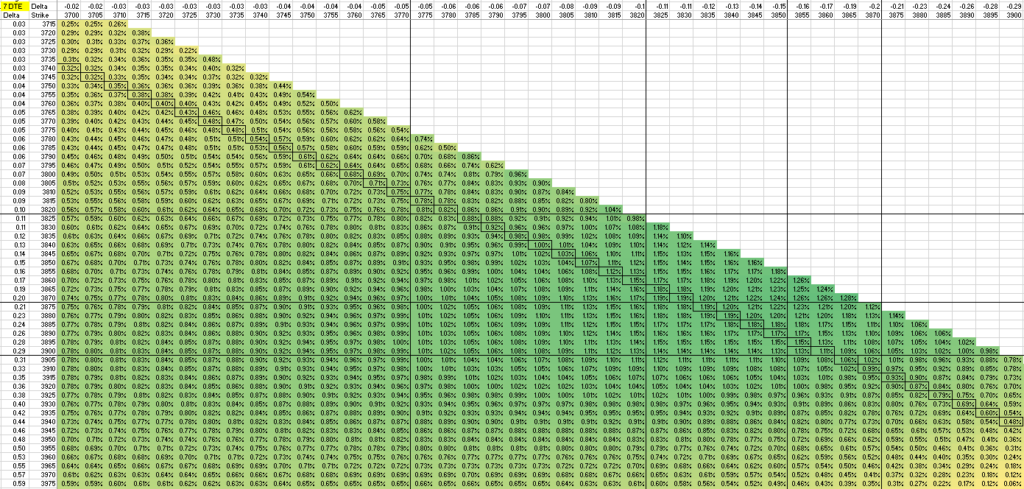
Here’s a slightly different way to look at the different Theta possibilities of 7 DTE put spreads. The horizontal axis is the long strike value, and the vertical axis is the short strike. The various values are color-coded, where the greener the cell, the higher the Theta value is as a percentage of the spread width, while yellow means lower Theta. As I’ve written elsewhere, this is one of my favorite ways to evaluate decay of a spread. I also drew boxes around all the values where the spread is 40 points wide- the points that are plotted on the earlier chart at the top of this post. If you zoom in on this green-yellow table, you can see that each cell is a percentage value, while the left and top lines show the strike prices and Delta values of each strike price. This table goes out much further than what I’m showing, but this is the part of the table where values are highest, and you can see the values are lower at the edges of this chart.
Note that delta values of between 5 and zero for the long put tend to have lower Theta values. And when the short puts get into the mid-twenties to thirty, Theta drops off. There are a number of combinations in between that have good Theta, and one could make an argument for many different ones.
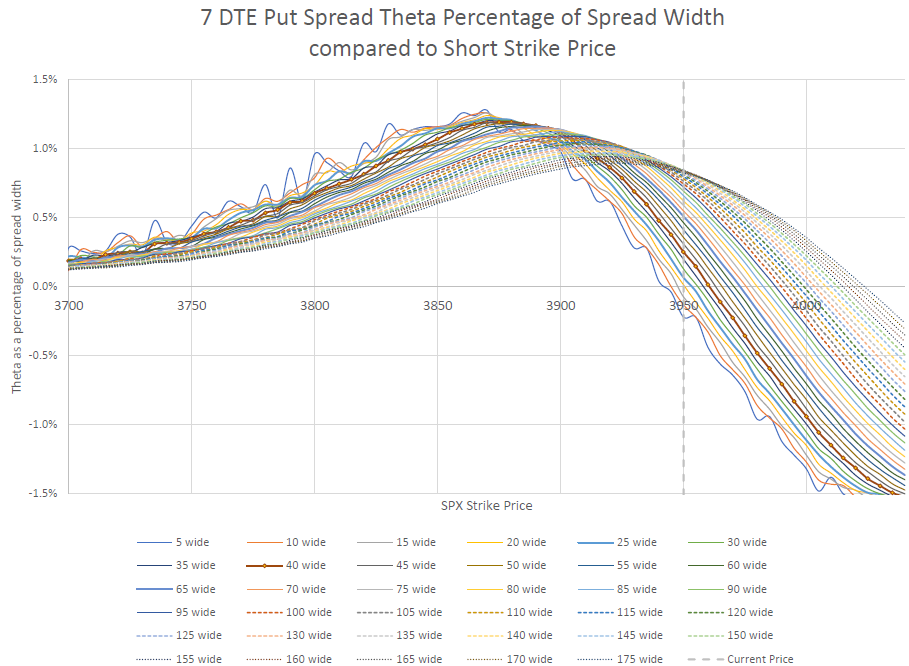
On this chart each line represents the Theta values of different spread widths at different strike prices.
One more way to look at this is to look at a graph with each line representing a different spread width. Notice that the most narrow width of 5 points has a lot of variation- this is because the Theta difference is so small, yet divided by a small width and a few nickels change in the difference in Thetas doesn’t scale smoothly. I’ve highlighted the 40 wide line that I’ve used earlier. One could argue that another line might be a better choice, but as we go wider, the peak gets closer to the current price which makes the probability of expiring in the money higher and higher.
Since the chart is made based on the short put strike, the curves move higher and higher as the spreads widen. Notice that as the spreads get wider, the peak Theta percentage gets smaller.
Longer Duration put spreads
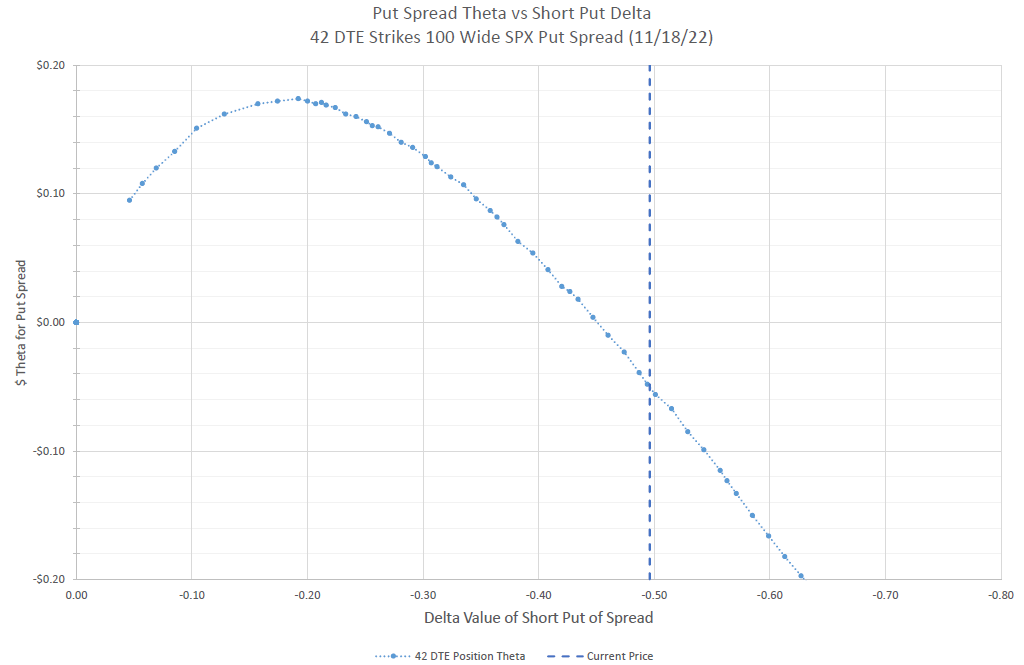
Let’s go a little further out in time and see if the data is different. At 42 days to expiration, we get somewhat similar results.
For 42 DTE on SPX. I chose 100 wide spreads and Theta peaked right at the 20 Delta short strike.
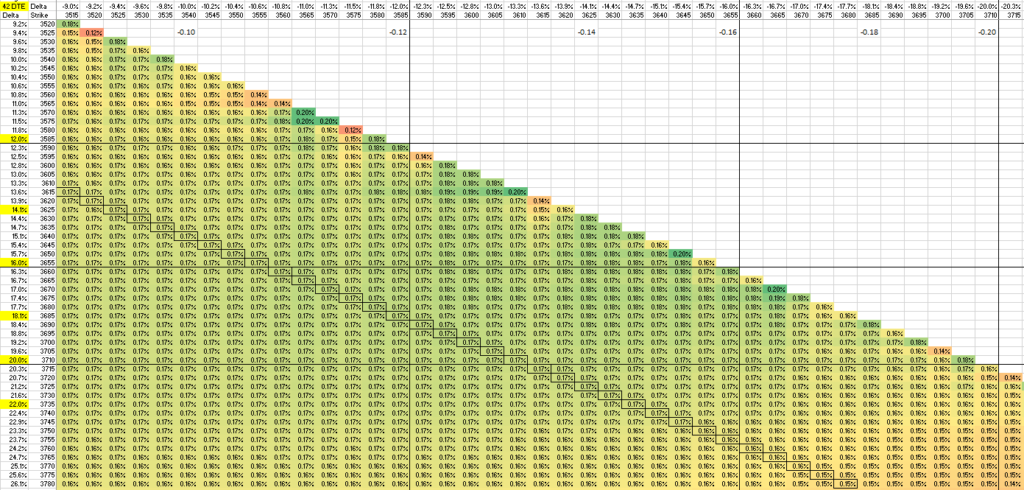
I also did a similar thing with a table of percentage Theta values, highlighting the 100 wide spreads.
This table shows the Theta as a percentage of the spread width, and is color coded with more green meaning more Theta return. Lines on the chart mark key Delta values.
Even longer duration put spreads?
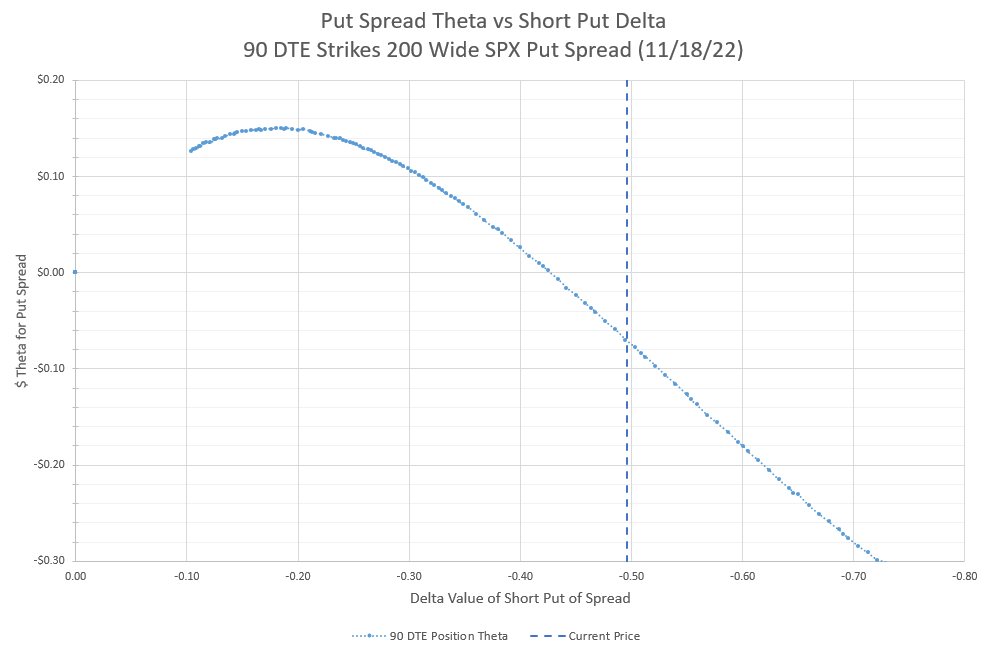
Let’s look at 90 DTE for an even longer duration.
At 90 DTE, Theta peaks out just under 20 Delta
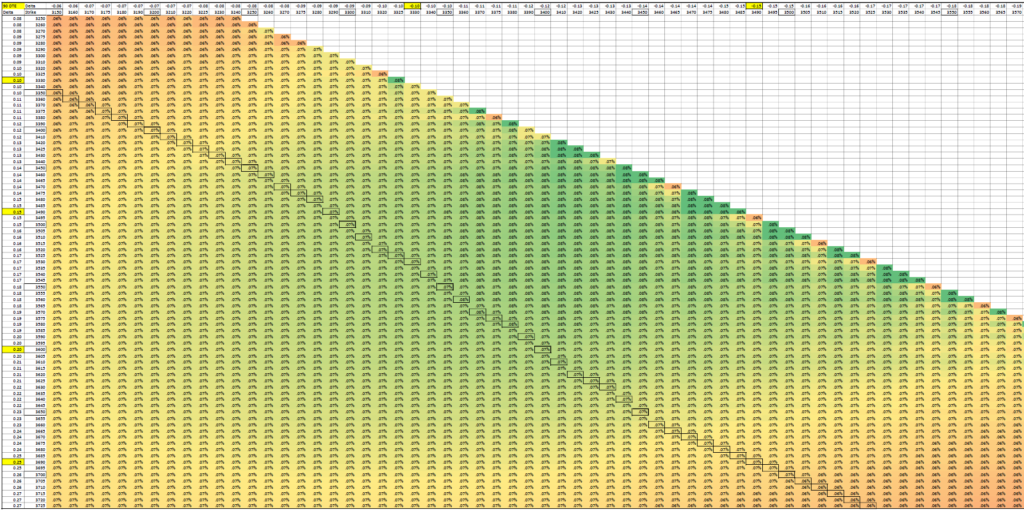
We can also look at a table of Theta values as well for 90 days to expiration.
The boxed values are 200 point wide spreads.
Again, the highest values have short strikes in the teens and low twenties for Delta. However, it probably is worth noting that the values shown are not that different between the yellow and green cells. So, maybe we should look at different spread widths to see it graphically.
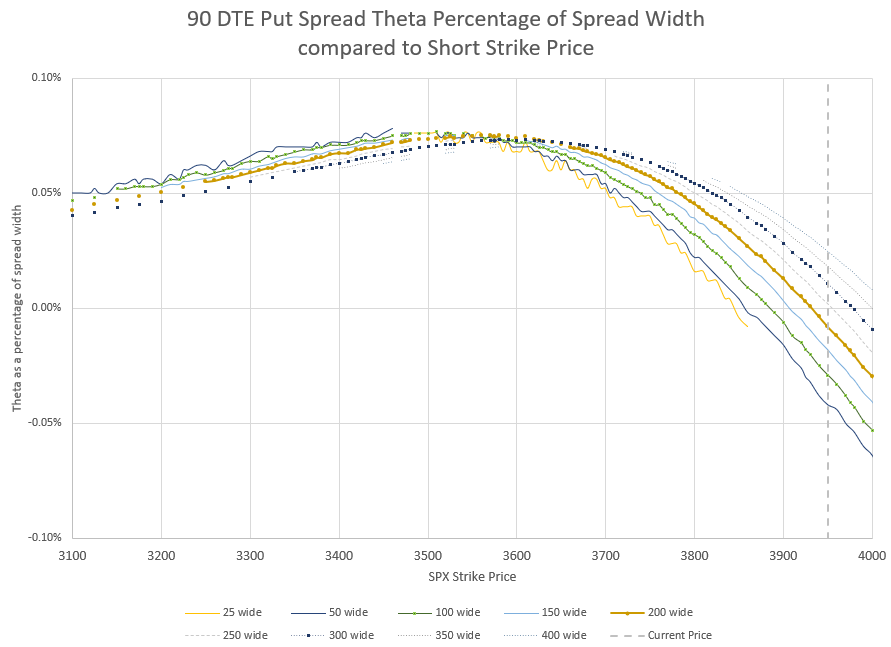
Virtually all spread widths have a lot of combinations of strikes with values over 0.06% Theta per day. Compared to shorter durations, these Theta values are fairly low.
When selling spreads this far out in time, the idea is to have a large buffer from the current price and get much of the premium to decay well before expiration is even close. Let’s look at an example of how this might work.
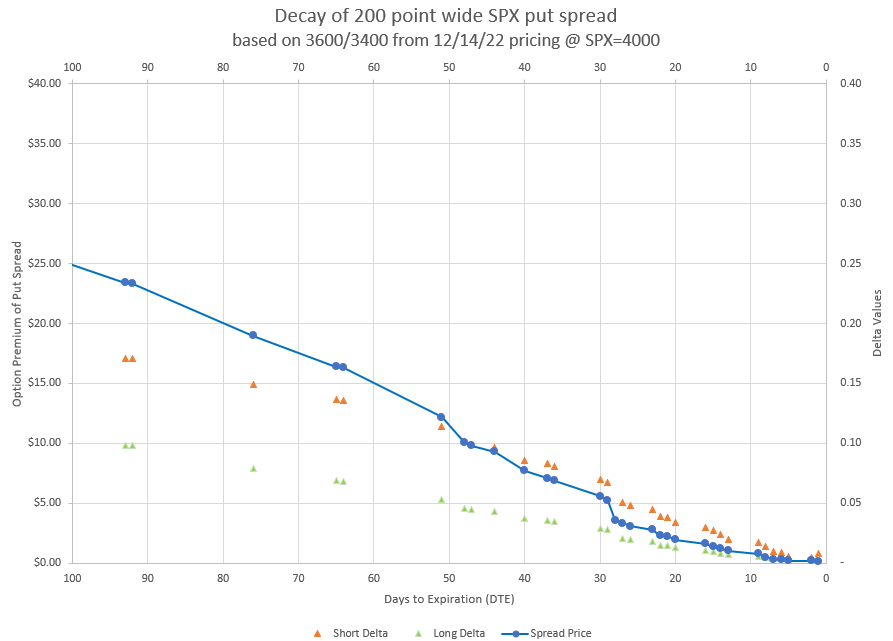
This chart shows how the premium of a 200 point wide spread is likely to decay over 90 days, assuming no change in underlying price or volatility. The small triangles represent the Delta values of each of the strikes in the spread as time passes.
Starting with low deltas below 20, we can see that much of the decay of this spread happens well before expiration is even close. In fact, the last 20 days have virtually no premium left, which would suggest closing early and moving on. I plan to do a lot more studies on the decay curves of different spread widths and strikes to help identify the pros and cons of different entry points.
Conclusion
I think it is safe to say that the original study on spread width still stands. However, the data shows that there is some wiggle room around our old ideal of 20 Delta short and 13 Delta long strikes. We just need to be in the neighborhood. We don’t have to be exact.
Where’d the data come from?
Readers may wonder the source of the data for all these charts and tables. Actually, it’s a source that anyone can access and replicate. I simply copied an option table from my broker’s site and pasted it into Excel. Then I used a pivot table to organize the data so that it was friendly for the analysis I wanted to do. The option table had Delta and Theta values for each option contract available, and I had to use some formulas to figure out percentages of spread widths, but it wasn’t any really difficult challenge.
I do worry that my broker is changing the format of the option tables it presents, and copying every contract may be a bigger challenge in the future, but for now, I can display all contracts and select all with Control-A, then paste as text in Excel. In the future, I may have to paste a smaller amount of data each time. Readers trying to replicate these studies may face the same problem.
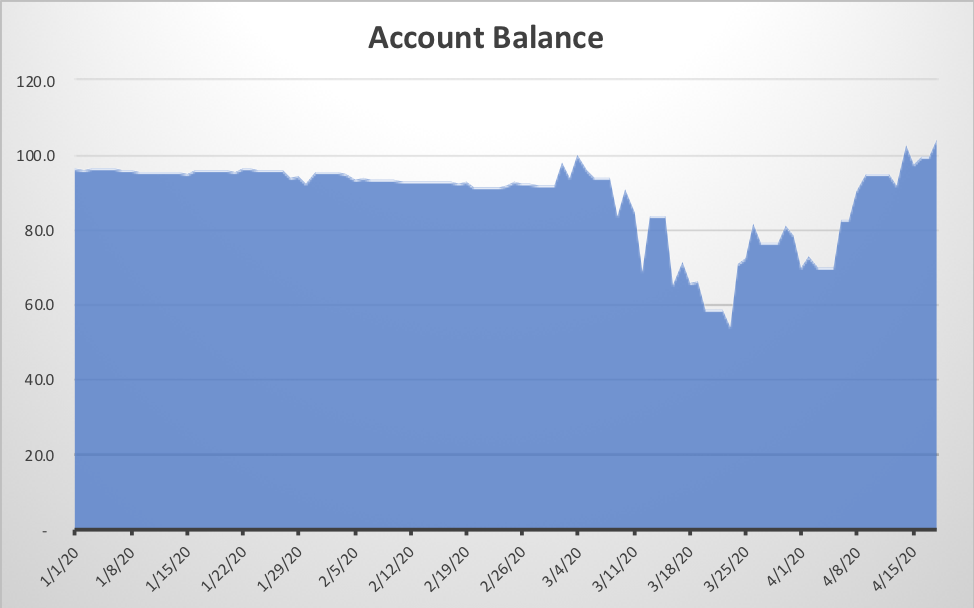
I’ve used my go to option strategies of credit put spreads, complementary back ratio call spreads, and using call spreads to cover calls to take advantage of the reversal from the mid-March lows
What a difference four weeks can make. From the end of February until March 23, my account dropped over 45% in value, worse than the stock market. However, since March 23 the account has gained back all of the loss and then some, a much better performance than the overall market. At the end of the day Friday, my account was up around 9% for the year, and up 4% from the high value at the end of February. All this from an account of mostly short option spreads, specifically credit put spreads. What happened, and what can be learned?
I’ve used my go to option strategies of credit put spreads, complementary back ratio call spreads, and using call spreads to cover calls to take advantage of the reversal from the mid-March lows. It’s been a fight every day, and a different approach than normal, but the positions are working.
Lots of mistakes on the way down
I made a number of strategic errors along the way that accelerated my losses. For months preceding the COVID crash, I maintained a negative Delta position in my portfolio as the market moved up to new highs seemingly every day. I watched my short calls go deeper and deeper into the money, while I sold puts just below or at the strikes of my short calls for lower and lower Delta values. I took some losses and reset my positions with more neutral to positive Deltas to go with the run up as the new year started. As the news of the coronavirus started hitting the news from China in late January, I scrambled and went negative Delta on a down day, which backfired when the market proved resilient after a one week drop. I discussed this error in a previous post. The market went on to hit new highs in mid-February and I held my own, moving to a positive Delta as it appeared that the coronavirus would not be that big of a deal. I even let a large group of underwater short call spreads be assigned for a big loss after many earlier rolls had kept hopes alive for getting my money back if the market went down.
The following Monday, the market started making big drops down. Initially, this worked out okay. I still had a number of short call spreads deep in the money that benefitted from the initial drop. But at strikes just below these call spreads were short put spreads that started growing big negative values. I had sold these to collect premium to offset the rolls I did to the call spreads, thinking that they would never approach being in the money.
In the early weeks of March I was worried that a whipsaw up would drive my call spreads back negative, so I bought the call spreads back when they reached 25% of the width of the spread, a nice improvement from values of over 90% of the width of the spread, but a loss compared to selling them originally for 15-20% of the width of the spread. Meanwhile, I let the put spreads keep going deeper into the money. I even sold some additional put spreads at what seemed like high volatility and low Deltas, only to see them get swamped a few days later when the market dropped 5-10% multiple days in a row. By this time, whatever the market lost, I lost double. One day the market went down 10% and I lost 20% of my account- in one day! Those were hard days to keep a positive attitude.
The data that kept me going
I never really considered cashing out to stop the losses. If anything, I knew that getting out would simply lock in the losses I had in my account. The losses were paper losses- once the position is closed, the loss or gain is real. That doesn’t mean that there is any guarantee that a paper loss will reverse- in fact, the raw option probabilities at the time suggested otherwise. But other data gave hope for better days.
Volatility is mean reverting. When volatility is at historic highs, it is likely to come down sooner than later. At its peak, the VIX was just over 80, implying an 80% move in the S&P 500 in the following year, based on option prices. Normal VIX values are around 18. It will take time to get back to normal values, but values in the 50s, 60s, and 70s are unsustainable. The way the VIX comes down is for the market to go up. The only question was when it would turn around.
The VIX almost always overstates what future moves will be. And volatility skew drives put premiums to high prices in all market environments, but especially in times of high volatility. The only time that owning puts makes money is while the market is dropping quickly, and that is the only time that being short in puts loses. My position lost money due to both changes in underlying prices that moved my put strikes into the money, but also due to increased volatility that made the premium go up. Knowing that these premiums were unsustainable, I felt comfortable that I would get my put premium back if I could hold on long enough.
The options I sell are typically 5 to 8 weeks out from expiration. That gives me time to wait for a reversal, time to adjust positions without panic. Normally, I close positions 2-3 weeks prior to expiration, but conditions will sometimes drive me to either act earlier, or go closer to expiration. The key is that having time gives me choices. Normally, I look at time decay as my primary consideration for how I manage my positions. During this crash and partial recovery, price movement was my main concern. In Greek terms, Delta (price movement) was the primary concern, while Theta (time decay) and even Vega (volatility changes) took minor roles.
All of these factors have been drilled into my head from watching and studying the research of the great folks at TastyTrade.com. They have presented numerous studies that show how market downturns are opportunities for those who can take advantage. Of course, you have to have capital to really take advantage, and I was pretty tapped out by the time we hit bottom.
I have my own approach, and I also build a variety of models and studies to help guide my strategies. I’ve never been comfortable with undefined risk strategies, the use of naked options. This recent period has re-inforced that point of view. My research has focused on how to use spreads to define risk, but also provide a profitable rate of return. Spreads behave differently than naked options, and require different strategies. Ideally, I get the majority of my profit from far out of the money credit put spreads. On the other hand, I mostly sell calls as part of a back ratio spread, because I’ve found credit call spreads to be problematic due to long periods of market up movement.
My recent winning approach
As we approached the bottom on March 23rd, I closed the remaining credit call spreads in my portfolio. My sense was that we were getting to a point where upside risk was greater than downside risk, and I didn’t want to lose on the way back up.
1. Rolling the credit put spreads
With the market down 20-30%, I had many credit put spreads that were deep in the money with strike prices as much as 20% above the underlying price at the time. I figured that if I could move the spreads even half way closer to the current trading price, I’d have much better odds of getting some or all of my money back. On the worst down days, I rolled my put spreads down, either widening the spread, or paying to be closer. This meant rolling short puts with Deltas of 90 or more and moving them to around 70 Delta. Many of these moves paid off big within a week of the move when we had a 10% move up of the market in a day. I used up days to roll out put spreads that were at the money or slightly out to later expirations, collecting premium and giving myself more time. I wrote a separate post on this strategy a few weeks ago.
2. Adding delta neutral back ratio call spreads
I generally take both sides of the option spectrum in my trades. I sell puts and calls on the same underlying at the same expiration. I use the same amount at risk capital on each side. As I got rid of my call spreads and rolled my credit put spreads down, I wanted to double-dip with calls, but without the risk of getting beat up with a whipsaw move up. If I sold credit call spreads, I feared that big up moves would drive these new call spreads into big losses. I didn’t want to lose on both the way down and on the way back up. So, I used back ratio spreads instead. The way I set these up is I find call strikes that have the same width as my put spread, and have Delta values where higher strike is half the Delta of the lower strike. I sell the higher Delta call and buy TWO of the lower Delta calls. The call position is Delta neutral and takes on no additional capital risk, because I use the same width as the put spread I already have. For example, I may sell a 30 Delta call and buy two 15 Delta calls. If my puts are out of the money, I may even sell calls in the money, for example sell a 60 Delta call and buy two 30 Delta calls. I collect a premium, which I keep if the strikes end up out of the money. If the underlying goes up, I make money from owning twice as many calls as I sold. For more details, read a further explanation on my web page on back ratio spreads.
I do have some long stock positions where I have sold covered calls in the past. Most of those calls have gone deep in the money a long time ago, and I rolled them periodically to collect a small premium. The recent COVID crash gave me an opportunity to finally get out of these positions and reset for a turnaround. Even out of the money, these positions still had a lot of time value due to volatility being at high levels. As I looked at each position, I generally did one of two non-traditional things- I sold a credit call spread, or even a back ratio spread in a later expiration. What this means is that while I still sold a call on my position, I used some of the proceeds to buy higher strike calls. By doing this, I have choices if prices go up substantially, but I’ll still keep premium if prices go down or stay flat. The back ratio spreads have the potential to create additional profit, with two long calls outgaining one short call, on top of the return from the underlying shares that are being covered. There are some minor downsides to this, but in a period where price movement is the key consideration, back ratio spreads are a great use of calls, even when covering long shares of stock.
How it worked out
From late March through the middle of April, the market has gone back and forth, up and down, with more up days than down. The market is up substantially from its low on March 23, but still well below the highs reached in late February. My positions have taken advantage of these moves.
My put spreads get more and more healthy as the market moves up. Almost all of them are now out of the money, although I still have a few under water. I’m rolling them out as they approach 21 days to expiration, and only for a credit. I actually rolled up a put spread that had gotten too far out of the money- the short strike had a Delta in the single digits, so I reset the spread to a 19/13 Delta because expiration was still 35 days away. I now use down days to open put spreads with slightly higher volatility. It feels more like normal times.
The call back ratio spreads have generally worked out great. They benefit from big price swings, but are vulnerable to decreases in volatility. They work best with long expirations- 4 to 10 weeks, so I’m pushing my expirations out to accommodate them. I also adjust them frequently, rolling up when the market goes up and rolling down when the market goes down. I collect premium both ways, moving to Delta neutral each time. In a declining volatility environment and an up and down market nearly every day, collecting additional premium keeps me ahead of Theta and Vega decay.
I do have a few regular credit call spreads where the width of my put spreads were too small for a corresponding back ratio call spread. These are my new problem positions because the big up moves have put some of them in the money. I’m determined to fight these, and one by one, I’m converting them into back ratio spreads or closing them before they get out of control. I’m also only opening new put spreads that have a width that a optimal back ratio call spread can match.
Of the upswing back, I’d say that 50% of the gains have come from put spreads getting out of the money, 25% from my long stock/ETF shares, and 25% from call strategies.
Looking ahead
Now that my portfolio is getting closer to my normal strategies, I’m starting to pay attention to Theta values and work toward a more neutral Delta position. I’m still negative Theta because of how many long calls are in my back ratio call spreads, but I’m working these down by going to strikes further out of the money where Theta is more in decline. The underwater put spreads also have negative Theta, which should reverse when they get out of the money. I’m still long Delta, but my call positions are slightly negative. As my puts get more out of the money, Delta will go down. I’m also working to free up capital, so I can have funds to jump in if volatility spikes back up.
Conclusion
While I’m not happy with how I got into this mess, I’m feeling quite fortunate to have beaten the market back to positive for the year. The challenge is to keep up the positive momentum.
Generally, there is a way to roll any option position to a new more favorable position and even collect a credit, if more risk is taken on. This may mean converting a $10 wide spread to a $12 wide spread and collecting $0.05, but improving the the possibility of profit.
Every good option trading resource says that a trader needs to have a good management plan to avoid big losses. Usually this is followed with vague explanations of setting mental stops and adhering to them. I fully agree with this, except that I believe a trader shouldn’t have vague plans. When an option trader opens a trade, the trader should know what conditions, good or bad, will necessitate an exit. And a system like that will work great until it doesn’t, like maybe during a coronavirus outbreak.
Most of my option strategies involve selling defined risk credit spreads that I enter with many weeks until expiration. My plan is to exit every position 2-3 weeks before expiration, buying back the spread for less than I paid for it. For each strategy, I have a target profit to exit, and a loss limit that I use to get out.
But, sometimes a good plan just fails. What should I do if the market drops 5% overnight and my options strikes were 2% below yesterday’s close? I can wait for a bounce back, which once I’m underwater makes sense if I have time to wait. With my approach, I usually have time. But when a 5% drop becomes 15% or 25%, it’s pretty clear that the odds are I’m not going to see my spread get anywhere close to getting out of the money. This is one of several desperate scenarios I’ve found myself in, not just the past month, but other times as well.
So, what is there to do? Most professionals will say to take the loss and start fresh. If the position is a total loss and hopeless, just leave it until expiration and hope a miracle occurs. All the capital is gone. That’s probably sound advice, and if anyone asks what they should do, that’s what I’d say. But, that’s not always what I do.
Against all advice, and probably all probabilities, I will take a total loss and roll it into something else that has a better chance for success, but increases capital at risk. To repeat, I add even more capital at risk to try and salvage a bad situation, perhaps making a bad situation worse. If that just freaks you out to think about it, just stop reading and move along. Options involve risk, and these approaches might be called risk squared.
If you are nutty enough to still be with me, let me explain. More than most investments, options truly balance risk and reward. Or maybe it is more like a balance between probability of profit and potential reward. Most initial strategies I open have a high probability of profit, but a somewhat limited reward. Those strategies therefore have a dark side, the potential for big losses a small percentage of the time. More often than I should, when those losses happen, I choose to fight to get my money back, because the odds are somewhat switched the other way- I hope to get a big return on the additional capital I add to the position by recovering much of my loss.
Here’s a quick example of a credit/bull put spread. Let’s say I sell a $10 wide spread and collect $1 premium. In real money, I’m risking $1,000 to make $100. Since I collect $100, I’m really only risking the other $900. The odds are probably around 90% that if I hold the spread to expiration, the options will expire worthless. Or I probably have a 95% chance of being able to buy back the spread for $0.50 or less around halfway to expiration. I like those odds. (The odds are actually better, but that’s a different topic.) A few months ago, I did a trade like this over and over, and won 26 times in a row, each time keeping way more than half of what I collected. That’s great, but this post isn’t about the good times, it’s about that 5%, 10%, 20% or whatever percent that things don’t go as planned.
When a trade like the one above has the underlying equity drop in price many times more than the expected move, the position sits at max loss. So, the above $10 spread would sit with a value of $10, a cash value of negative $1,000 in my account. When this happens, it usually happens to a lot of positions at once, even if the portfolio of options is well diversified in every way possible.
Here’s what I do for this situation.
Plan A- get out
First, I try to get out before it gets this far- plan A. In a slow moving market, this is often possible, and I lose something like 1-2 times the premium I collect, but keep over half my capital. When I can, I do this, but there is downside to this practical strategy. Often, underlying prices fluctuate a lot and a position will show a loss, but then turn around for a profit. There is a whole statistic around this, the probability of touch. Read about it in my Greeks section of the website, under Delta. Suffice it to say, if I’m too quick to take a loss, I’ll take more losses than I should. So, the more time I have, the more leeway I give the position to recover. And when there isn’t time, I aggressively get out to preserve capital. In slow moving markets, that works, and it’s the smart trade.
Plan B – wait and see
When the market moves quickly against me and just blows through my strikes, I can continue with plan A and take a bigger loss, but assuming I’ve lost 80-90% + of my capital at risk, there isn’t much capital to preserve. At this point, closing locks in a huge loss to save a small amount of capital, or I can wait and potentially get a big chunk of capital back. Since I trade in a timeframe of several weeks, I like to take time to evaluate the situation. This is a luxury compared to day-trading options that are at expiration. The first question I ask is, how likely is the trade to turn around in the time left on the option contract? If the issue that caused the price drop appears temporary with the possibility of recovering by expiration, then it makes sense to do nothing but wait. If the issue behind the drop is continuing to make the underlying price drop, I will also wait to see how bad it gets before acting, even though that likely guarantees that the position will move to max loss. I wait, and I evaluate options.
Plan C- roll down and widen the position
When a position looks hopeless, I can either give up or do something about it. Generally, there is a way to roll any option position to a new more favorable position and even collect a credit, if more risk is taken on. This may mean converting a $10 wide spread to a $12 wide spread and collecting $0.05, but improving the probability of profit, or more accurately the possibility of profit.
Recently, I had a chance to do this when more than one put spread was blown out by the huge market drop from the coronavirus. Here’s one example. I had sold SPY puts spreads with strikes of 310 and 305 when SPY was trading at over 330 in mid February this year. I like to think of the trade in terms of Delta values. The 310 strike had a Delta of around 18 and the 305 was around 10. That is the sweet spot for me to open a put spread, and I collected $0.75 per share. Expiration was set for late March with a plan to get out in early March. However, the market dropped rapidly, due to the coronavirus, and SPY was well below 300 in a matter of days, and below 275 a week later. By that time, Delta values were between 80 and 90, and the spread was trading between $4.50 and $4.75. I was hopeful that maybe this was temporary, so I waited. When the price of SPY dropped to below $250 on a huge sell-off day, I rolled the spread down to 275 and 267.5 with an April expiration, and collected $0.03, and now increased my capital at risk. I thought more time would allow me to get out, even though my Deltas were still over 75. Unfortunately, the market kept going down. A little over a week later, SPY dropped below 220, and I decided to act again, rolling down to 240 and 230 for another $0.05 credit. Still, Deltas were over 75. Then the market went up, a lot. When SPY went over $250, the Deltas were under 30, and the spread could be bought for $2. I bought it back. In the end, I lost $1.18 premium per share. My original position would have expired a $4.25 loss. I could have rolled out and down again to get a chance at an actual profit by May, but I really wanted to free up capital with the market up. A few other similar positions were rolled down and out further using the freed capital, and maybe they’ll end up a profit. The point is, this position was set up for max loss, and by aggressively converting through a risk-adding roll, the loss was significantly reduced.
A few things I consider when I do this. I try to roll down underwater put spreads on big down days. This may seem counter-intuitive. If I’m at max loss and the market drops more, my position doesn’t actually change much. A $5 wide spread might go from a book value of $4.85 to $4.90 on a $15 underlying drop. I could then roll down the spread $15 for a small debit, or widen the spread to $5.50 or $6 and collect a small credit. I usually play around with different possible rolls, both on the same expiration date and later dates. If I can get more time for not a lot of extra cost or capital risk, that is preferable, since I’m waiting for a recovery.
Indexes vs. Individual Stocks
I also tend to do this more with equity index ETFs than I do with individual stocks. There is a lot of historic examples of markets bouncing back from big drops, even if the bounces are temporary. Individual stocks have more complexity in that they may or may not follow the rest of the market and have their own unique issues that drive their price in unique ways. My goal in a desperate situation is to use big declines in market value to reposition my option spreads to be able to get out of the money when a bounce occurs. I’ve just found that indexes are more likely to accommodate that strategy.
Spreads partially in the money
I want to differentiate between a spread that is fully in the money and one that is partially in the money. When I have a credit spread where both the short and long options are in the money, then I’m fully in the money, and max loss is a real possibility. When only the short option is in the money, but the long is still out of the money, I’m likely only sitting with a premium value of around half the width of the spread- $2.50 for a $5 wide spread, so the position is partially in the money. When a position is partially in the money, I have a couple of active choices, close before I lose the other half, or roll out for additional time and a credit. If the underlying price is actually closer to the short strike than the long, I can almost always roll out to a later expiration date with the same strike prices for a credit, and I may be able to roll down or narrow the width for less credit. The point is there are more positive choices that don’t add capital risk when a spread position is only partially in the money.
Naked put considerations
I also want to point out that these types or rolls are for credit put spreads, not naked puts. If you sold a naked put and you are in the money, the only choice available to avoid a loss is to roll out in time. The good news is that it is almost always possible to roll to the same strike price at a later date and collect a credit, something that isn’t true with a spread. The bad news is that there aren’t really any other choices. A naked put has undefined risk, and if the underlying price keeps dropping, the losses keep adding on.
Reverse an early assignment
When positions get deep in the money, the risk of early assignment grows. Assignment is when an option buyer exercises the option before expiration. Since we are talking about market downturns in this post, this is when a put buyer makes a seller buy the underlying security. Because I try to close or roll positions well before expiration, I don’t get assignments very often. But it can happen, and when it happened the first few times, it can be very troubling. I woke up one day and found that I had bought $500,000 of SPY, and also had an accompanying -$500,000 cash balance due. Before panicking, remember that a spread has an equal amount of long contracts to the amount of contracts that were assigned. If I had 20 short contracts assigned into 2,000 shares, I also had 20 long contracts still sitting in my account. When I get an early assignment, it usually means I get a negative cash balance in my account, and I can’t make any other trades until the assignment is adjusted in some way. There are a number of choices on how to get out of this and either not lose any more, or even reverse the situation and roll into a position to get some of the losses back.
The simplest thing to do would be to just sell the shares, which would likely get the cash balance back positive, and eliminate all the new shares. However, if the assigned shares are sold by themselves, the link between their value and the long options hedging them is broken. What link am I talking about, you may ask?- I don’t have a spread anymore, I have shares and long options. The link is that the shares were bought at the short option strike price. Let’s say I have a $5 wide spread, short a $250 strike put, and long a $245 strike put. If one contract is assigned, I buy 100 shares for a total of $25,000. But the assignment was because the underlying security was trading for less, say $225 a share. If I sell the shares at the market, I’ll only get $22,500 for them, a loss of $25 a share. Didn’t I buy a $245 put for some reason to help with this?
Another transaction I could do would be to sell both the shares and long put at the same time. Most likely both are well in the money. If that is the case, I could sell the combination and lose no more than the difference in strike prices. In my example above, I would make at least $24,500 to sell the combination of shares, because the long option price would be relative to the underlying price. For example, if the underlying price is $220, the long option would be worth $25, and the sale of the combination would be $245 per share, or $24,500 cash. If the underlying price was closer to the strike price, the sale might make a little more if there is time value in the long option.
My experience is that puts that are exercised early usually are exercised at very near the low of whatever is going on, say after a day when the market was just devastated. If the shares are sold alone and the long put is held onto, the market is more likely to go up and eat away the value of the long puts, which locks in the oversize loss. I’ve done it myself, but I don’t do it anymore. Instead, I look for ways to reset my position without losing a hedge.
An easy way to reset the position that was in place before an assignment is just undo the assignment- sell the shares and sell the same put that was assigned. So, if a $250 strike short put was assigned, just sell the assigned shares and re-sell the $250 strike short put. Likely, the sales price will be just under $250 per share total, maybe $249.90- just under due to the bid-ask spreads of each leg and any remaining time value in the option being sold. For example if the underlying was trading at $220, the shares would well for $220 and the $250 strike option would sell for just under $30, at total of just under $250. So, the total cash received would be just less than the $25,000 that was required to buy the shares. And we’d basically be back to where we started before the assignment, less a tiny amount of pricing spread and maybe some time value in the option. The problem is that since shares were assigned the previous night, they might be assigned again the next night, and the we’ll be right back in this mess again.
Here’s one more choice- let’s reverse our position at a different price and different expiration, a four legged trade. Some brokers allow this to be done as one trade, but most will require this to be done in at least two separate trades, which is fine. The plan is to sell the newly assigned shares with the remaining long put, and then open up a new spread that is more favorable, like we could have if the short option hadn’t been assigned. Using the example, we’ve been using with our $250/$245 spread with the $250 short strike assigned to us, we’d sell the shares and the $245 strike long put for about $245 a share, or a total of $24,500 cash. Then we sell a new put spread closer to the money, and maybe a bit wider to collect a $5 or more credit per share or $500 total per contract. After all that, we have a position more likely to get out of the money with more time, albeit with a bit more capital at risk.
Conclusion
So, when the market trashes a put spread, there are ways to recover, even if there is an early assignment. I try to pick the least bad of several terrible choices. Some ways are more complicated than others, but desperate positions may lead to desperate measures.
Final disclaimer- this information is just information, and not my advice. Trading options involve significant risk, often multiple times the value of the initial trade, and every trader has to understand and consider the risk of a trade for themselves. Every situation is different, and there is no correct answer for every situation. Adding addition capital to a lost position can likely lead to loss of that capital as well.
Earlier this week, I decided to go all in on adjusting the Delta of my option portfolio. Monday, to be specific, I moved from a somewhat positive portfolio Delta to a very negative portfolio Delta. In hindsight, this was a bad move for a variety of reasons, and I thought it was worth writing a post to share.
Background
For those of you new to option Greeks, Delta is the option parameter that measures how much a underlying security price change will change the price of the option. If a stock goes up $1, how much will the option price change? For every position in your portfolio, you can measure this impact, and with a little math, you can figure this out for your whole portfolio. The key is to price weight the Delta values so that different priced stocks and ETFs are weighted proportionally to their impact on the portfolio. There is a whole section on Greeks on this site that goes into the particulars if you need more information. There is also an overview of Delta included. However, it isn’t necessary for you to fully grasp all the theory to understand the point of this post.
Before my changes, my portfolio moved about half the amount on a percentage basis as the market moved in the same direction- if the market went up 1%, my portfolio went up 0.5%. After the change, my portfolio moves two times the market in the opposite direction- if the market goes down 1%, my portfolio goes up 2%.
Why did I do this, you might ask? Well, the market has gone nowhere but up for the past three months, and is due for a reversal. It is up so much that I saw in the weekend Barrons publication that one indicator says we reached “Euphoria” levels this past week, which says we are likely to be lower a year from now. Also, the coronavirus was in the news and could have a big impact on the global economy. Last week the market was down for the first time in three months, and we had all four days close at a loss. (The market was closed Monday for MLK day.)
Over the weekend, I decided I was positioned the wrong way- my portfolio was positive Delta and all indications were that the market was going down. And Monday, the market opened way down, over a percent and a half lower than the close on Friday. My portfolio showed a loss of just under 1% for the day. If this is what we are going to see for the next several weeks, I needed to get positioned to profit.
If you aren’t familiar with my approach to option trading, I’m a big proponent of defined risk credit positions. In other words I sell options spreads for a premium and then expect them to decay in value so I can buy the spreads back for much less than I sold them for. I sell both put spreads and call spreads, often on the same underlying security on the same expiration, an Iron Condor. Typically, I try to be Delta neutral (price neutral), so I benefit whether the market goes up or down, but mainly when it doesn’t move very far in either direction. But for three months the market has gone up- a bunch! The call spreads of my Iron Condor were getting breached and were losing money. It is no fun to lose money when the market is going up.
To adjust for the very bullish market, I’ve started selling many more put spreads and call back spreads for the last month or so. I stopped opening new Iron Condor positions. I have several put spreads without calls. These positions benefit when the market goes up more than when the market goes down. The Delta value of these new positions are all positive. That was working well with the market climbing almost every day, and profits were rolling in. Then last week the market turned….
Monday’s adjustment
So, what did I do? Since my read was that the market was at the beginning of a downturn, I wanted to reverse how my options behaved. I went through my positions and closed out every put spread that is expiring in the next four weeks. If I had opened them several weeks ago, I could close them at a profit. However, if they were recently added, I had to take a loss, especially on Monday with the market down, when puts are more expensive.
I also converted many of my call backspreads to simple credit call spreads. If you aren’t familiar, a call backspread is when you sell one call and buy two calls further out of the money. I often buy the two calls at just less than half the Delta of the call I sold, and can collect a credit. If the market goes up a lot, the two calls I bought become worth more than the call I sold. But if the market goes down, the long calls quickly drop in value. On several backspreads I had, I sold one of the long calls that I had bought. I took a loss on each of them, but I thought they were going to soon be worthless with the market going down, so it made sense to sell. The remaining spread of one short call and one long call could then decay in my favor when the market tanks.
Why do I think this was wrong?
Tuesday, the market went up 1%, and I lost a little over 2%, because of the changes I made. So, I lost on an down day on Monday because I had positive Delta, and I lost on an up day on Tuesday because I then had negative Delta.
I still think we are likely to see a down market over the next month, and I think my position will eventually benefit. But, my approach to adjusting was wrong on several fronts. Generally, my timing was terrible and the magnitude of the change was too much at once. Here are the key principles I violated.
I closed into weakness and not into strength.
I made too big of an adjustment at once.
I should have known the odds were against me on Monday.
I didn’t pay attention to how much Delta I reduced
Let’s take these one by one.
Closing into weakness
Everyone knows that the goal of trading anything is to “Buy Low and Sell High.” For an option seller, it is actually to “Sell High and Buy Back Low,” but the idea is the same. When you have a short put position (or a credit put spread), the best time to buy it back is on a day when the market is up and it is less valuable. In a choppy market with the market up one day and down the next, picking the right day to open and close positions makes a big difference.
The same is true of selling a long call position- sell calls on an up day when the call is most valuable.
Not only was the market down the day that I closed my short puts and long calls, it was down the largest amount that it had dropped in three months! A terrible day to make this change. I paid way too much for my puts, and I received way too little for my calls.
Too big of an adjustment at once
As I already said, I think the market is still headed down over the next several weeks and I think negative Delta will do well. However, I might be wrong, and I pride myself on avoiding big directional bets.
I moved to a portfolio Delta that is negative twice the value of my portfolio. If your broker provides a SPY-weighted Delta measure, you can see this by multiplying your SPY weighted Delta times the value of a share of the SPY ETF. As an example, if you have a SPY-weighted Delta of -100, it is equivalent to being short 100 shares of SPY. At today’s SPY price of $327 per share, the portfolio will behave like negative $32,700 of SPY shares. If your portfolio had a dollar value of $16,000, you would lose 2% if the market went up 1%. That’s essentially my new position.
So, what would have been a better approach? Well, if I was absolutely determined to adjust my portfolio Delta on a down day, I could have adjusted just until my Delta was zero. Then, when there was an up day in the market, I could have adjusted into negative delta territory.
In any case, moving from a Delta value that is 0.5x my portfolio value to one that is -2x is too far, too fast. I’ll be looking for a chance to work myself back closer to Delta neutral in coming days, even if I stay with negative Delta.
Odds were against me
There were at least two predictors that I should have paid attention to on Monday before making the changes I did. I should have known that it was very likely the market would go up on Tuesday, making Tuesday a much better day to adjust than Monday. As it turned out, the market was up 1% Tuesday, the largest up move in three months.
How would I have predicted this? The first reason is a bit weak, but often true market myth- Tuesdays generally bounce the opposite direction of Monday. This is the kind of story that I tend to doubt, but many market veterans quote it every time it happens. For me, it is one piece of information to consider, but especially after a big move on Monday.
The second reason is more data-based. The most losing days in a row we have had in the past 20 years is six. It has happened only a few times, but we have not had seven losing days in a row in the past 20 years. How do I know this? Tasty Trade did a study on this last year and it stuck with me. You can see it yourself in this segment on Fading Market Moves. Monday was the fifth losing day in a row. It is very rare for there to be six losing days in a row, so the end was in sight and I attacked too soon.
There are other reasons to reconsider timing, especially on down days. We generally have more up days than down, so unless the situation is critical, there is usually a better time to reduce your bullish position than on the biggest down day in months.
If the opposite situation were true, I’d feel a little different. The market can have very long winning streaks, and you really can’t wait for a down period to fix a bearish situation.
Not knowing the number
When you run a website called Data Driven Options, you should know the Delta impact of the changes you make. I trade on a platform that doesn’t offer a weighted Delta measure, so I export a list of positions at the end of every day and calculate my portfolio delta on a spreadsheet. There has to be a better way, and I think my broker will soon offer a real-time solution, but for now, I’m flying a little blind when I make a lot of changes in a single day.
That’s really no excuse. Knowing what I wanted to do, I should have looked at the total weighted Delta values of the positions I was closing and determined the impact. I honestly didn’t think I had shed that much Delta while I was doing it. I’ll be more aware next time.
What to do after messing up
I can’t go back in time and get my Monday and Tuesday losses back. To be fair, this is far from an insurmountable loss. However, I can learn from my mistakes and share what I have learned.
The other thing I can do is to adjust portfolio Delta back toward neutral. I still want to be negative for at least a few weeks, just not this negative. To do this, I’ll start selling put spreads, especially if we have some big down days soon. Otherwise, I’ll chip away slowly. Ideally, I’d like to get my SPY weighted Delta to a value equal to between -0.5 and -1.0 times my portfolio dollar value soon. Then if we see a correction, I’ll look for an opportunity to move more closer to a zero Delta position. A slight negative Delta is generally best for option positions, because volatility changes will then cancel out underlying price moves in either direction.
Conclusion
When you are trading options, a key metric is portfolio Delta. As market prices change over time, a major consideration of what types of option positions to open and close are those that move your portfolio Delta to a more desirable value in line with your market outlook. For traders like me, this usually means moving toward zero or neutral Delta.
When changing your portfolio to adjust Delta, timing and the amount of change can’t be ignored. Over-adjustment at the wrong time puts a portfolio at risk. I know, because I just did it myself.