A pair of popular ratio trades are the 111 and 112 put trades. By selling more puts than buying, decay is accelerated. Is there a big difference in expected performance or risk? Why would a trader prefer one over the other? Are either of these naked trading strategies even worth the risk?
While there are many variations of these trades, for simplicity’s sake, we are going to compare versions that meet the following criteria:
- Use a version of the S&P 500 index or futures options that trades at full index value like SPX, /ES, or /MES.
- Buy a 50 point wide put spread at strikes to cost approximately $10 in premium. The strikes needed will be with Delta values in the low teens. This is the 1-1 portion of the 1-1-x trade.
- Sell one or two puts much further out of the money for a total of $20 in premium. With the 111 trade, we sell one put for $20 premium, and with the 112 trade, we sell two puts for $10 each for a total of $20. Strikes that sell for $10 are much further out of the money than those that sell for $20.
By setting up a comparison this way, we change only one variable, the number of short puts we sell. Our total premium collected is the same and the debit spread is the same.
Our trade-off then is simple, selling one far out of the money put for $20 or selling two VERY far out of the money puts for $20.
Trade Set up
In this example, we are trading using an underlying index with a current price of 4000. We are using puts expiring in 55 days. Let’s compare the set up each trade:
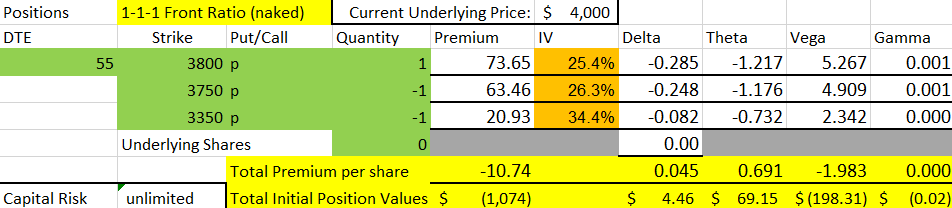
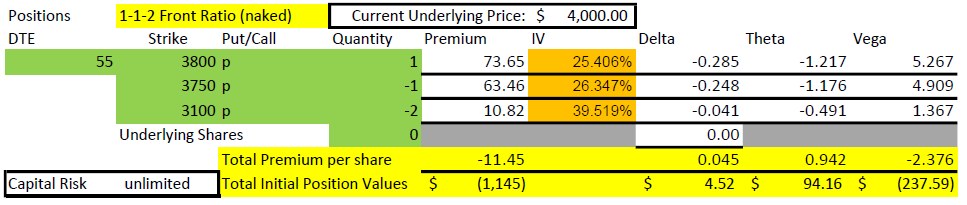
The only difference is the third leg of each trade. In the 111 trade, we sold one 3350 put for $20.93, slightly more than our goal of $20. In the 112 trade, we sold two 3100 puts for $10.82 each, a bit more than our goal of $10. We end up with slightly more of total credit in the 112, because we picked a short strike with a little more premium for two contracts than the premium for one contract in the 111. This difference is minimal and not a big factor in our comparison. Also, notice that we have a bit more Theta in the 112 than the 111.
Strike Price vs Expected Moves
We don’t often look at where our strikes are compared to the expected move of the underlying, but this trade comparison is one where the expected move is a big part of the justification of the trade. As a reminder, the expected move is the range of movement implied by a one standard deviation movement in price, based on the Implied Volatility of the option chain multiplied out by the square root of time. The charts below illustrate what happens to the underlying price if it moves up one times the expected move, moves up 1%, stays the same, moves down one expected move, or moves down two times the expected move. Super-imposed are the strike prices of each trade, so you can see at what point these moves would interact with the option strikes.
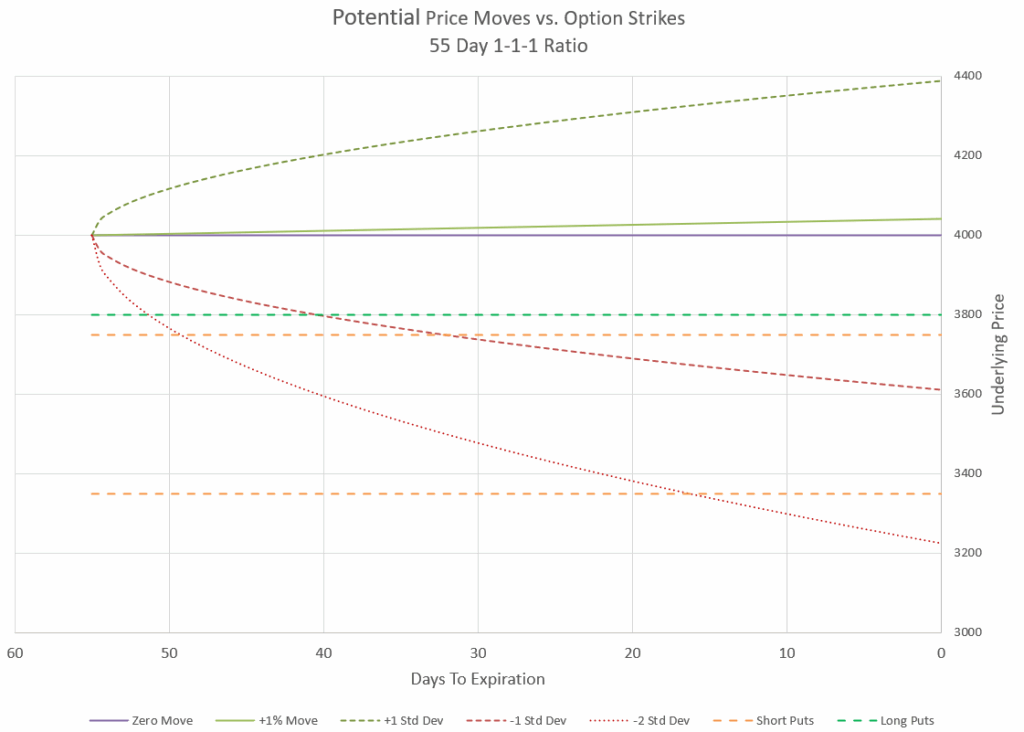

The obvious difference between these two charts is that the strikes for the naked puts of the 112 trade are outside of two times the expected move while the strike price of the naked put in the 111 trade is inside two expected moves. However, we had to sell two naked puts to make a similar credit that far out of the money.
In either case, these charts point to the conclusion that it isn’t likely that the naked puts will end up in the money. The question is- which is riskier? Is being outside two times the expected move safe enough? Let’s dig in a little deeper.
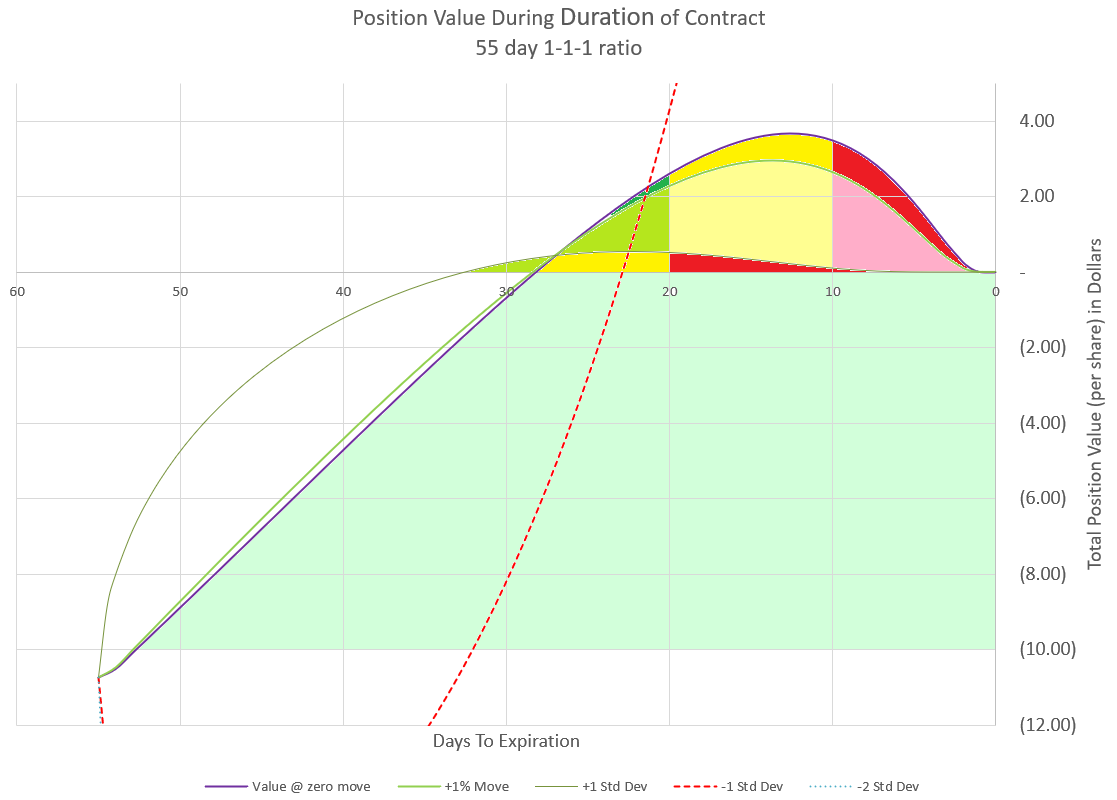
Comparing Profit and Loss Outcomes
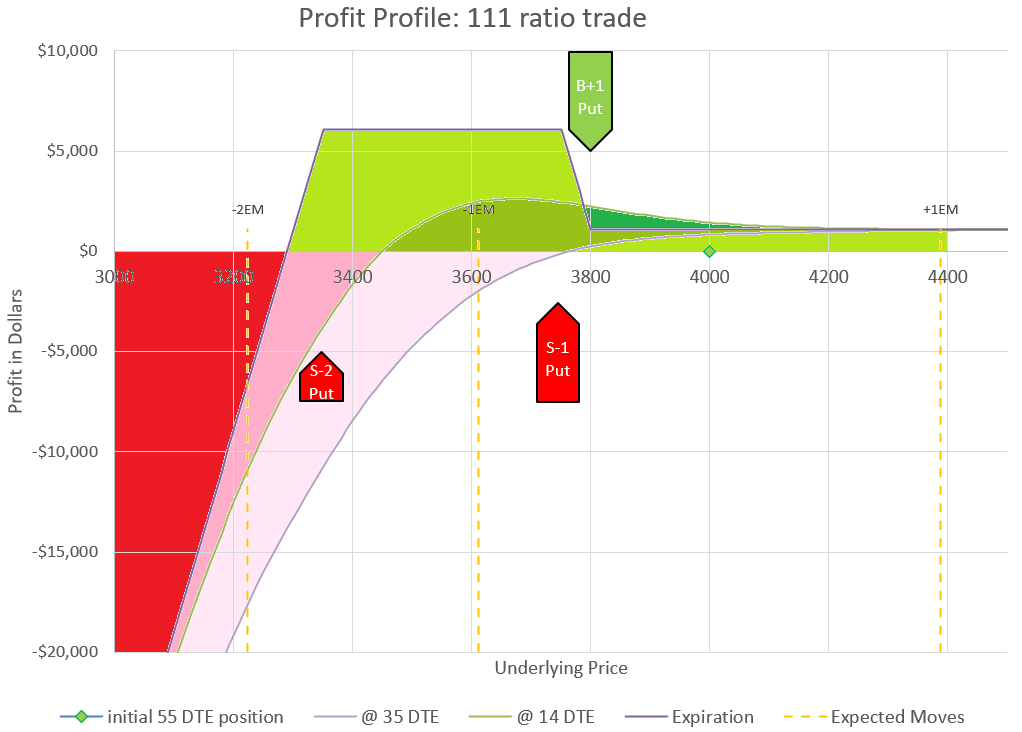
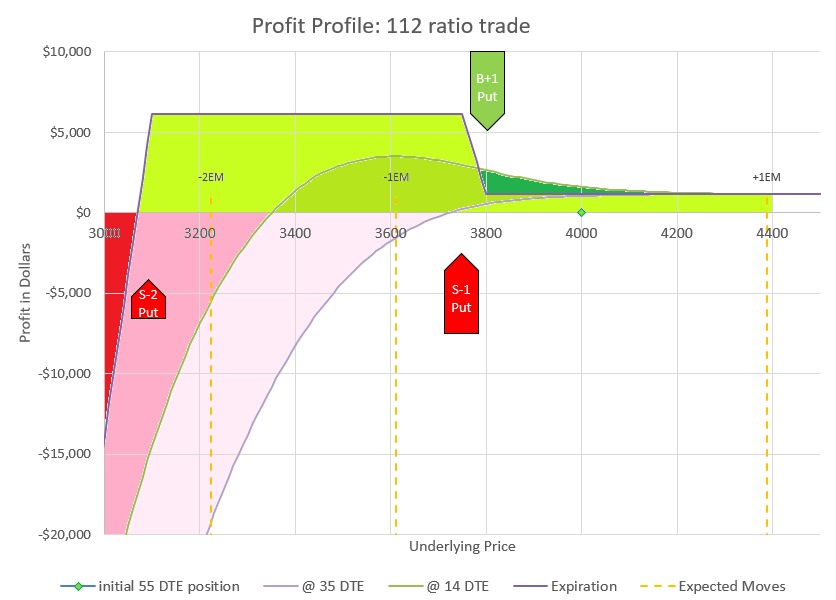
These charts are similar in many ways, and the outcome 20 days into the trade with 35 days left to expiration is almost identical. As expiration gets closer, a trader can profit at lower strikes with the 112, but the loss curves are also much steeper for the 112.
Comparing similar moves
If we look at how position values change when there is a move of different amounts based on expected moves at points in time from the start of the trade, we see similar curves of the two trades, except for the move of two times the expected move down.
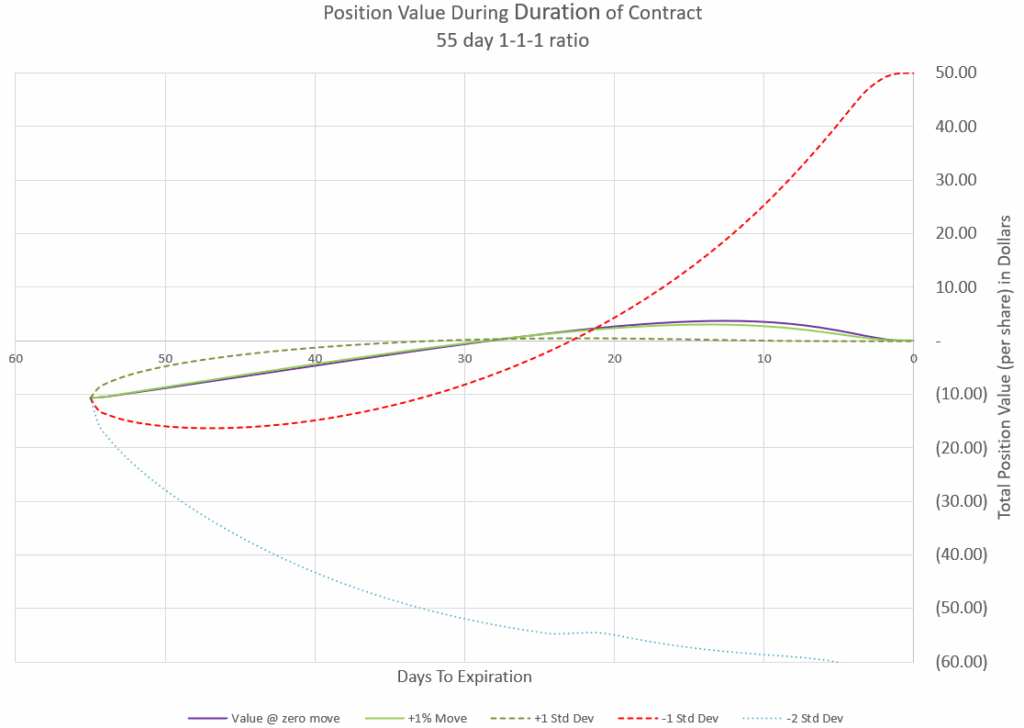
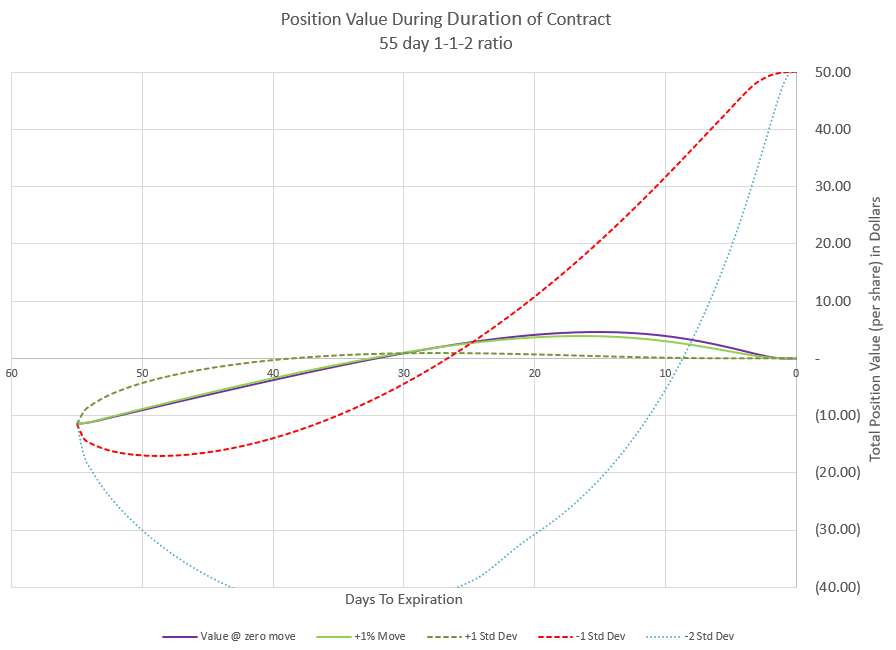
The big difference in these two charts is what happens with a negative move that is two times the expected move. Both initially show big losses, but the 112 turns the losses around if the move stays on the two expected moves down curve. Most traders would not be able or even want to hold through a move like that, and would want to manage the trade earlier by closing or rolling.
For winning trades, the goal becomes one of closing the trade at the maximum profit during the trade, and maybe even capturing a credit value. Timing matters as the following charts illustrate:

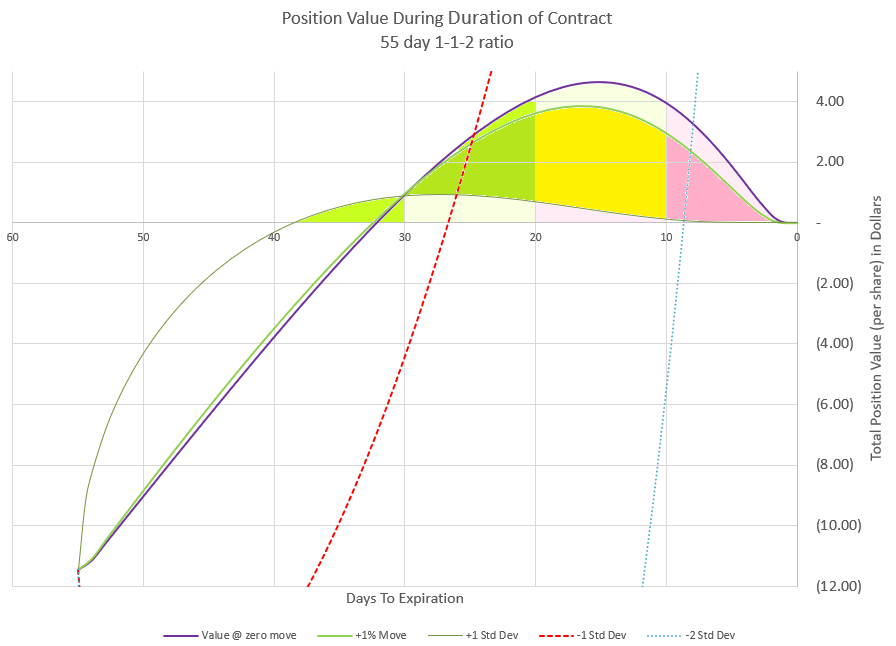
These charts illustrate the outcomes of small moves being profitable and requiring early management with timing, while big moves up capture all the premium and not much more fairly early in the trade. You can read about how to cash in during the green or yellow zone of small moves in the write-up of the 112 trade, but these charts are to show that this management is close to identical for the 111 vs 112 trade outcomes.
SPAN margin impacts
If these trades are done using futures options, SPAN margin comes into play. SPAN margin is a calculation done on a daily basis to assess the market risk of an account’s futures positions. When starting out, a 112 requires a little less than twice the capital as a 111 trade, because it has two naked options, compared to one, but the two naked option strike prices are further out of the money, so the margin requirement isn’t double.
SPAN margin requires much less capital than other forms of option margin most of the time. However, in a market downturn, capital requirements can escalate quickly. Unlike other forms of option margin, Implied Volatility is major factor in the calculation of SPAN margin. This was particularly evident in the events surrounding Japan’s debt crisis on August 5, 2024, a minor blip for most traders, but a crisis for many futures options traders with naked positions. See my write-up about this event for more detail. Traders with a lot of 112 exposure were in double trouble compared to those with 111 positions, even though in many cases the underlying prices hadn’t even breached the debit spread strikes. The issue was that Implied Volatility spiked to extreme levels, making the prices of the naked puts very high, and the SPAN margin requirements multiply many times over. This was the fastest ever spike in Implied Volatility and caught many traders off guard. Pricing models were not prepared for this level of volatility, so traders were unable to anticipate this risk. As a result, many traders have backed away from the 112, or been much more careful on sizing of positions. 111 traders were also impacted, but typically not nearly as much.
The unfortunate take on this problem with SPAN margin is that even though the 112 trade appears to have much more downside protection, it really doesn’t in worst case scenarios, like in August of 2024 or April of 2025 during the Trump tariff scare. While these kinds of events don’t happen often, they do happen and with so many traders now using short-dated options, Implied Volatility appears to be more quick to spike than ever before. Sellers: beware!
Conclusion
While there are differences in the behavior of the 111 and 112 trades, the trades are more similar than different. The biggest difference from a practical standpoint is that the 112 has two naked positions which can jump in value in market downturns faster than the single 111 naked put, even though most models don’t truly reflect that.
For traders utilizing these strategies, the key to managing risk is to keep these trades a small percentage of the portfolio, so that the portfolio can absorb the added margin requirements of negative markets.