I’ve been trading variations of a Double Diagonal option position, rolling daily for 14 months. It’s been a bumpy ride, but overall very positive. For this trade I used SPX index options, the most liquid option on the S&P 500 Index. The trade requires four options- a short and long put, and a short and long call. For a single contract 4-leg position, the total capital requirement is usually a bit less than $10,000, without the use of any margin, but varies day to day. I’ve averaged just over $3000 profit a month per each single contract position, or 30% return per month. This is without any compounding.
I’ve written about this strategy in my article, Daily Double Diagonal Trade. I spent over a year previously testing and trading Daily Diagonal Puts of various expirations, and there are several write-ups on those topics on this website. However, this post is intended to focus in on results, and what I learned along the way.
Let’s take a look at results broken down month by month. I’ve split out the results for each leg of the contract, as well as the total return for the month. Note that the results are in dollars per contract, and as mentioned above the total position usually requires a little less than $10,000 of capital on any given day.

If you look closely and do the math, you may see that on many months the four individual legs don’t add up to the total. This is because I didn’t always have a 1:1:1:1 ratio. As described in my strategy write-up, I sometimes reduced the amount of short option exposure, trying to find better ways, particularly in higher volatility environments. These results are averages per contract for the idividual legs and average per contract position for the total. So, if I had 3 longs and 2 shorts, I took the total P/L and divided by 3.
Some people have asked me why I chose to add calls to the earlier Diagonal Put strategy. From the results, you can see that the calls have actually made more than the puts when you add the long and short positions together. I noticed this early on in my data, so I just kept going. Initially, this was just a trial, but it started so well, I just kept going.
We can also look at this as a graph, which makes the numbers more obvious.
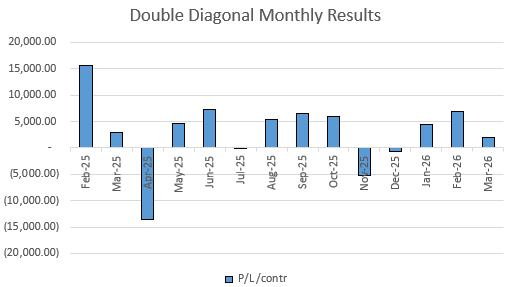
You might notice a few things that pop out from the graph. First, the best month of all was the first one I traded this- February 2025. The month was a fairly calm month with almost every day staying within the daily expected move. I also traded with mostly 2 DTE short option positions, maximizing short gains. I thought I had found the best trade ever.
The worst month was just two months later, April 2025, which started with President Trump’s “Liberation Day,” where he announced 200% tariffs on most of the world. The market dropped almost 20%, often in chunks. I took hit after hit with each big down day. Then near the end of the month, the president announced that he was delaying tariffs for a month and the market went up 10% in a single day, the largest one day gain ever for the stock market. My short call position got obliterated. I realized that this trade wasn’t as easy as I had thought.
Over time, I adjusted my approach, with a goal to reduce the losses in worst case scenarios while trying not to give up too much upside. I tried lots of adjustments, both in real trades in dozens of different back-tests. Since that April debacle, I’ve had two negative months, November and December, which I chalk up to getting too cute in trying to set up a robust trade for big moves that didn’t happen as I expected. In March of 2026, I was on track for a month that could have been the best one yet, despite the war in Iran, until the cease fire at the end of the month caused a huge one day market gain that wiped out most of the month’s gains.
But, to a large extent, much of what has happened is just how this trade goes. Most of the time, the market is fairly quiet and this trade does well. But some of the time the market gets volatile and there is only so much you can do to avoid losses. I like to think that the changes I’ve made to my mechanics would let me do better in another situation like April of 2025, but I’m not sure I’d have the discipline to stick to a plan.
Overall, this trade has done extremely well for me.
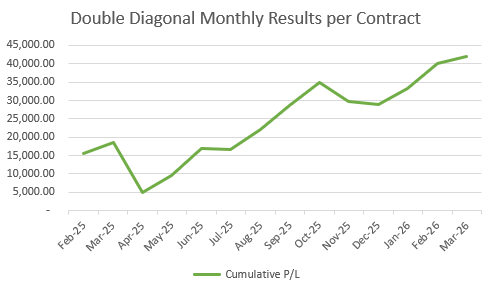
For every 4-legged contract position I’ve made over $40,000 in 14 months. Assuming that each contract position required $10,000, the trade has turned $10,000 into $50,000. As in all trading results, it goes without saying that past performance is no guarantee of future results, so take all of this as just one piece of data.
I resisted the urge to try scaling up to compound by earnings. I’ve tried to mostly just keep much of my earnings in cash to build my buffer. I’ve spent some of my gains, and also used some to fund other trade strategies in my diversified accounts. I fully expect to see future drawdowns of over $10,000 a contract, but I take some comfort that the longest period of negative results from peak to peak is four months so far. At any point in the cumulative profit graph, the total is higher 5 months later. Given the length of time for these results, it’s safe to say that I can’t draw statistical significance from that observation, only that this is true for this data set.
Finally, I’d love to claim that I quintupled the size of my accounts because of this trade, but I didn’t because this was only a part of my overall position. Other positions didn’t do nearly as well, and much of my portfolio is in cash equivalents like BIL, the T-bill ETF, that I can quickly switch to/from cash. And if I had put all my money in this trade, I would have gone broke last April, so that’s why I only do a portion with this trade and keep lots of cash for tough times.
The way to bring the volatility of the trade down is to mix it with positions that are very stable, so that its volatility is muted by steady results elsewhere. Mix this trade with 5, 10 or even 20x of other positions that just earn basic interest, and you can have a mix with nice upside and not that much downside. That’s how I can do a trade like this without getting stressed out.
This trade is about as close to day trading as I get. I make a rolling trade of my positions each day, but I don’t spend much time the rest of the day watching the markets. With several days until expiration, there isn’t much that happens during a trading day to require any kind of action.
Can this trade keep averaging 30% return on risk capital per month? Only time will tell.
What strategies are you running regularly in your accounts? It seems from your writings that the “best” strategies are selling credit put spreads, put spreads with call ratio spreads, and this double diagonal. Are there other strategies that you currently run regularly? Just trying to get a “big picture” view of how you are currently trading your entire portfolio.
I also trade a good amount of covered calls and poor man’s covered calls. The covered calls have been a good way to be invested in the market in stocks I like, but with calls to generate some income while also reducing volatility from stock movement. Poor man’s covered calls let me get involved in bigger stocks without as much capital. Because many of my option positions provide leverage, I keep a significant chunk of my portfolios in cash equivalent positions like BIL, the T-bill ETF that I can trade in and out of to park excess cash and to have cash available when I need it to bolster my trading positions. Overall, I’m roughly 1/3 cash, 1/3 stocks with covered calls, and 1/3 option spreads of various sorts.