What are the optimal expirations and strikes?
I recently published a couple of studies on two different variations of a trade that sells what many would call a “Poor Man’s Covered Put,” a diagonal trade focused on collecting income from rolling a short put day after day. After a lot of review of some different daily diagonal rolling trades using SPX puts, I’ve continued to question whether the choices for strikes and expirations I’ve been trading are optimal. Could a backtest help?
To dig into details of the trade, including suggestions for managing outlier events, check out Very Long and Very Short Put Diagonal, and Daily Diagonal Covered Put. One uses a long put with a 5 year expiration and the other uses a long put with 60 days, while both sell a short put with just a few days until expiration.
Without going into every detail of the trade, we are talking about buying a long-dated put and selling a short-dated put as a combination trade. The two options will have different expiration dates and different strike prices, which is considered a diagonal trade. The idea is that the put that was sold, the short put, will decay faster than the put that was bought, the long put. To maintain the trade, we just continuously roll the short put day after day, collecting more and more premium- at least that is the plan. When the market moves, we have alternative plans to manage the positions, which are detailed in the other write-ups.
A couple of things bothered me about each trade. With 5 year expirations, interest rates play an outsized role in the performance of the long put, plus the trade ties up a lot of capital. At 60 days, having a long strike lower than the short caused some buying power issues when rolling strikes. In both cases, extended down moves greatly impacted the short put losses, while the long put didn’t provide that much protection. So, are there better choices out there?
As I researched the previous two articles, it struck me that higher Deltas would provide better long protection on the downside, and more short premium on the upside. I wanted to see if that played out in real life. I also realized that the shorter the duration of the long put in the trade, the less capital is tied up, making gains greater as a percentage of capital used. But it cuts both ways, the shorter duration long puts can’t provide the ballast of big capital and the day to day profit and losses as a percentage of capital are much bigger. So, is there a better setup to consider?
I turned to two sources to try and find some better answers- theoretical modelling and backtesting. For backtesting, I used the free service from TastyTrade.com. Their application only allows options with expirations up to 365 days and it can’t show results of trades closed in the past if the expiration is later than the time the backtest was done. But otherwise, I was able to get some meaningful data from trying different values in the tool. I also couldn’t put any complex rules for rolling just one side or managing rolls differently when the strikes get into the money, so I just set up to trade the same diagonal positions based on DTE and Deltas every day and close the trade after one day in trade. So, in effect, this backtest would similate rolling both sides of the trade back to center every day, a different approach than presented in the earlier articles, but similar enough that the data should directionally help point out better trade choices, if they exist.
Optimizing the 60 Day Long for Best Delta
In the write-up on the Daily Diagonal Covered Put, I used a 60 DTE long put and a 3 DTE short put, both at 40 Delta, which when I first started trading this strategy seemed high. When selling puts, typically Deltas in the 20-30 range seem to perform best, but in a diagonal situation, there just isn’t much room for error. Moving to 40 Delta helps by giving more bearish protection from long, and more premium on the short side to contribute in an up move. I put a backtest together for that trade, and it showed a 106% return on used capital for 2024, with a maximum drawdown of 34%. You can see it in the other page by following the link.
So, what if we kept going to 50 Delta on both the long and short options, keeping the same expirations? We get similar results:
60/3 DTE Diagonal with 50 Delta strikes Held for One Day- Entered every day
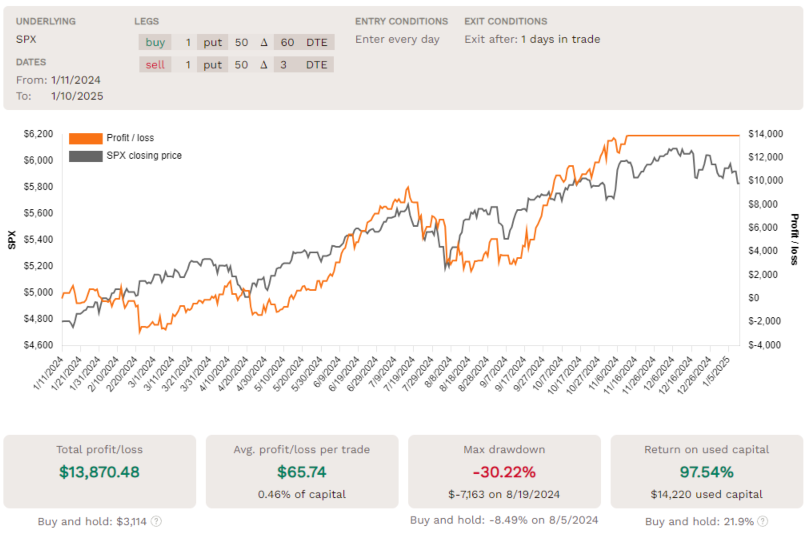

You can compare these side by side, but here are the takeaways from my point of view. The 50 Delta version requires a slight bit more capital. It also made more profit in dollars, but the percentage return total is slightly less. However, the 50 Delta version also looks a little less volatile, with a max drawdown of 30%. Interestingly, the biggest daily gain is bigger on the 50 Delta version, but the biggest daily loss is smaller- that’s two benefits I was looking for- better protection and more premium.
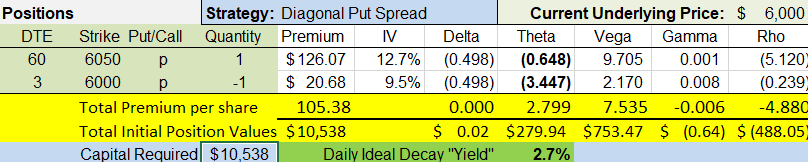
For reference, here is the setup of this trade, assuming the SPX index is trading at 6000:
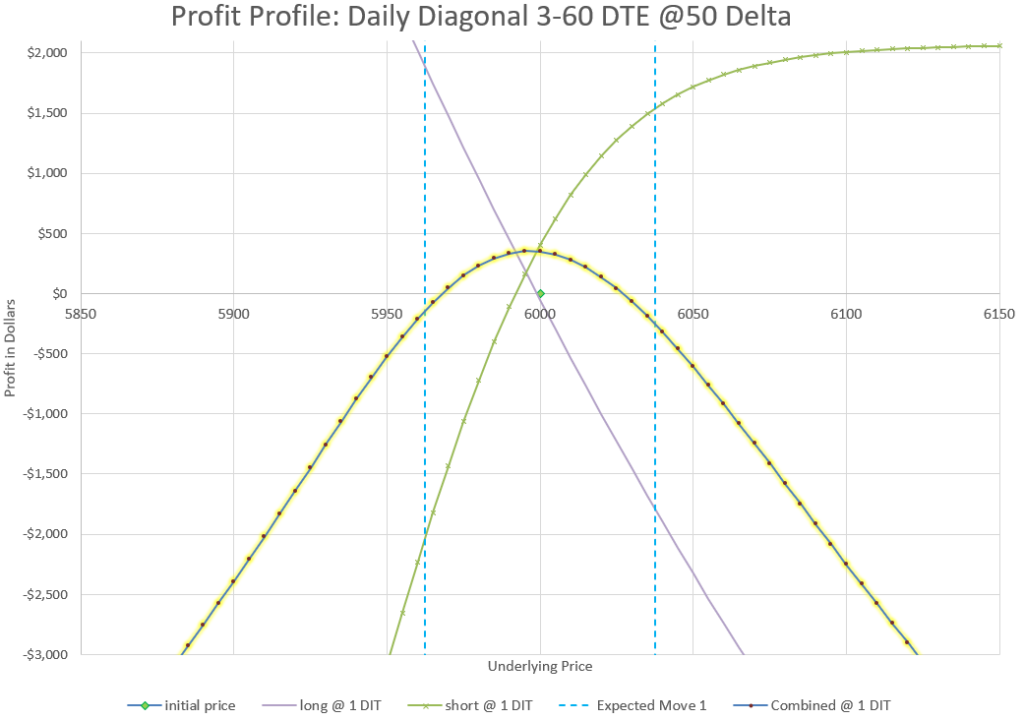
I didn’t color in the profit and loss areas on this chart, but you can see that essentially after one day there is a profit if the index stays within the expected move. The backtest shows a 64% win rate, which looks to be right on what we would predict, as the profit curve isn’t completely covering the whole expected move. As a reminder, we expect to stay within the expected move 68% of the time. For more about Expected Moves, see the linked article.
It looks like our backtest profit per day is about 1/5 of the theoretical Theta value. If we can keep 20-25% of the Theta we have available, that’s a good trade.
Where is the maximum return?
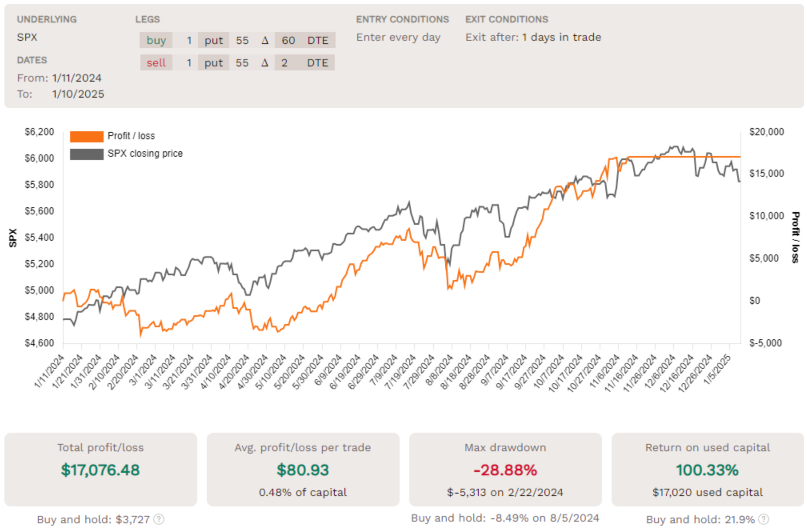
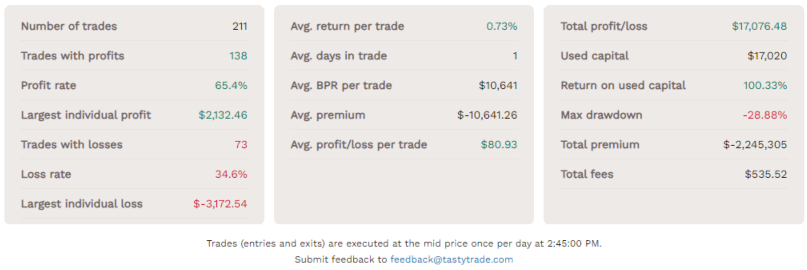
Okay, it’s great that a little tweak can make some minor improvement to results, but let’s try other values. I spent a few hours entering different long and short duration values, and also playing around with different Delta values, and finally settled on 10 days for the long put and 2 days for the short put. Here’s the backtest results:
10/2 DTE Diagonal with 55 Delta strikes Held for One Day- Entered every day
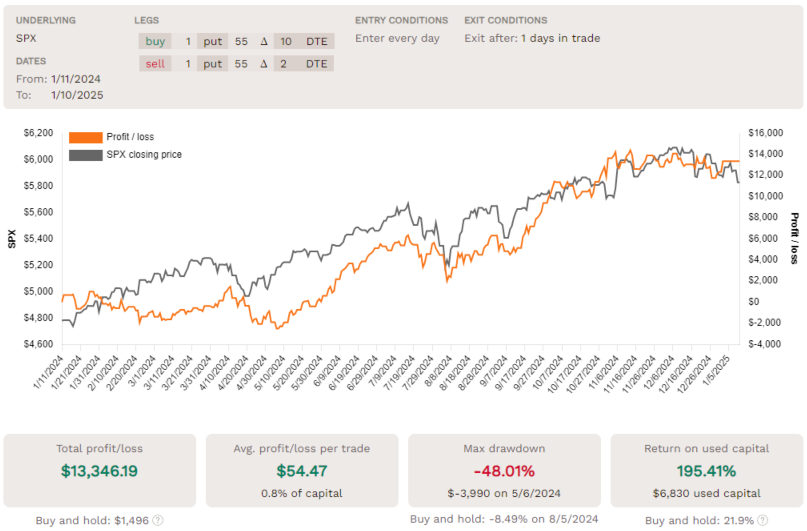
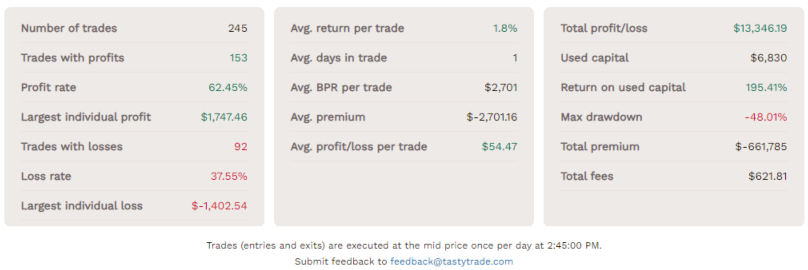
This backtest really is impressive! Start with 195% Return on used capital, essentially 1% per day! This trade makes about the same dollar profit as the 60 DTE trade above, but uses half the capital. Additionally, the biggest one day gain is bigger in absolute dollars in this version than the 60 Day version and the biggest daily loss is much less, in fact in this trade the biggest daily loss is smaller than the biggest daily gain. The maximum drawdown on a percentage basis is slightly bigger, but much less on a dollar basis.
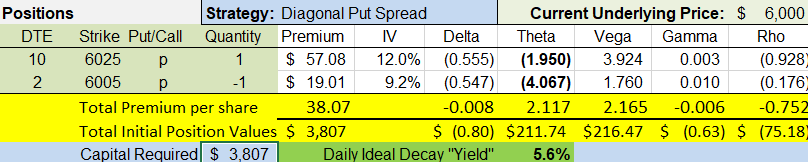
Let’s look at the setup of this trade on a theoretical basis, and see what kind of strikes we would be trading if the market were at a current price of 6000:
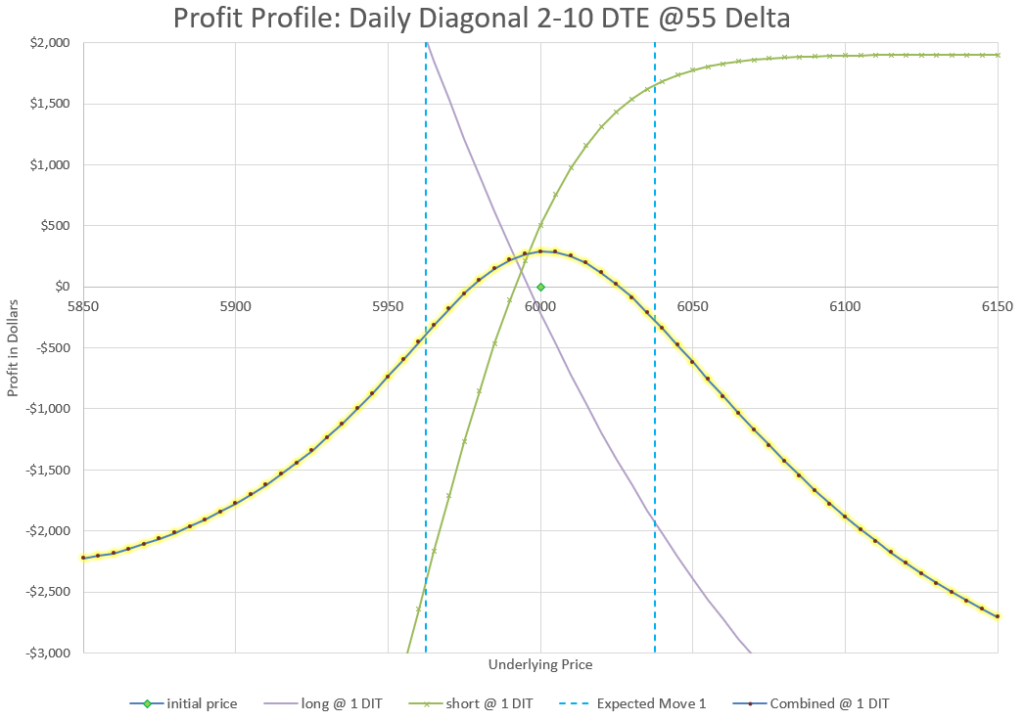
Notice again that the profit area of the chart is mostly inside the expected move, but not quite as much as the 60 Day version. And that plays out in the backtest where we have a 62% win rate. However, if we widen this chart, we see a big difference on downside risk:
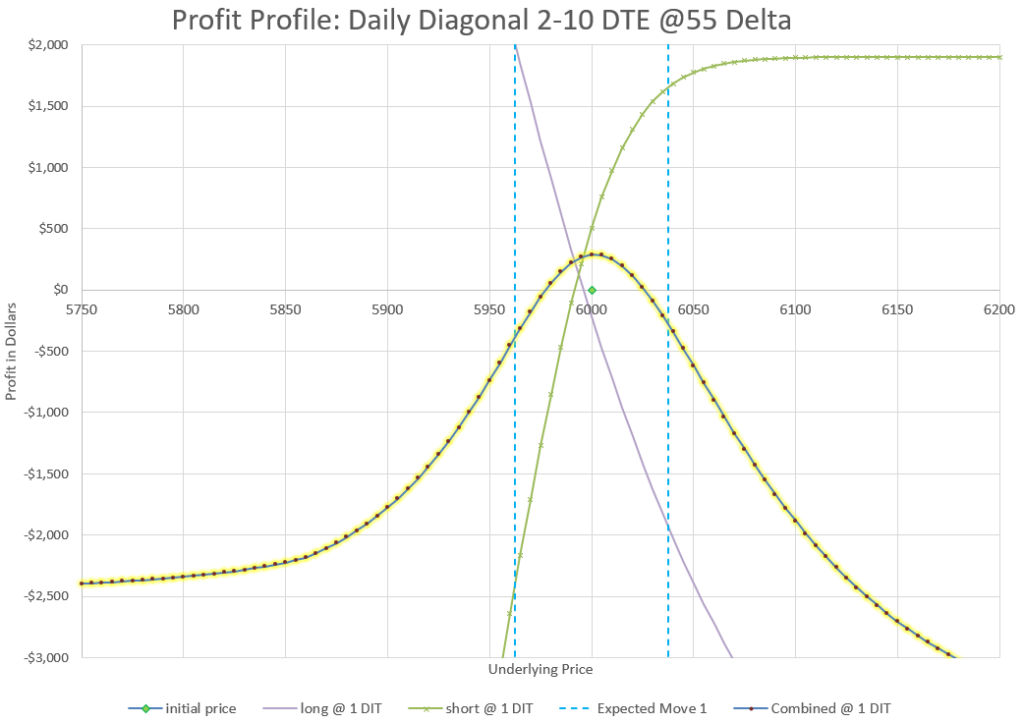
Notice that the lowest one day loss flattens out to a little less than $2500, where other versions of this trade go down much further before they flatten out. With less duration in the long, the Delta of the long quickly catches up with the short as they approach 100, and there is the added benefit that the long is a higher strike than the short, so the very deep in the money value is less than the premium paid to get into the trade. So, even though we show the debit paid for the trade as the risk, the max loss is actually less on the down side. And if we look at the back test, we can see that the biggest daily loss was about $1400, which is less than this model predicts, probably due to different Implied Volatility at the point in the year when the loss occurred.
Before going further, you may be curious if I looked at even higher Deltas? Yes, I did and they started showing lower returns, probably because the increased capital required didn’t provide additional profit. What about 9 days, or 7? Or maybe 11? I looked at all the DTEs around 10 and 10 was best. I can only assume that maybe that has to do with 10 DTE being where IV tends to be minimized in the term structure, so premium has the best bang for the buck there? That’s only a guess, but it seems to be the best point in time according to the backtest. To be fair values a few days more or less or a few Deltas higher or lower weren’t that much different in the backtest results, but I found 10 DTE long, 2 DTE short, and 55 Delta optimized results.
Can we improve the 60 Day Diagonal?
After seeing that 2 DTE for the short worked better at our best spot along with 55 Delta, I went back to see what would happen with those changes with a 60 Day long put. Here’s the results:
60/3 DTE Diagonal with 50 Delta strikes Held for One Day- Entered every day
How about that! We improved our percentage return to 100% of used capital. We reduced our maximum drawdown. We raised our maximum daily profit more than we increase our biggest daily loss. We did need a little more capital. So, I’d call it marginal improvement over the earlier 60 day option.
Final Thoughts
One point to make sure everyone understands is that past performance in no guarantee of future results. Backtests show how something would have performed in the past. They also are completely mechanical and don’t take into account any human element of decision making, either good or bad. It also matters what timeframe the backtest was run, and 2024 was a mostly up year. However, I do think that they can point to help directionally compare different choices and show which kinds of trades have a tendency to do well and which don’t. Looking at values like biggest drawdown and largest daily loss starts to give you an idea of what the risk can be of a trade, and backtests with big upsides show possibilities for profits if conditions repeat.
I also studied different underlyings to see if similar results were possible, even if using weekly expirations. I’ll save that for another write-up in the future, but intial backtests look promising, matching what some of my option trading buddies have shared with their use of diagonals.
After working with the backtest and modelling different results, the conclusion is that our optimal setup appears to be much shorter duration long puts and much higher Delta values than what has been presented previously. Because my starting point was 5 year long puts, it took a while to realize that the better choice was much less convoluted and much easier to manage. Sometimes, it is easy to over complicate things. Here’s to keeping it more simple.
Feel free to leave a comment and share your experiences with this style of trade.
Great write-up! Your analysis confirms what many overlook, that shorter duration longs with higher Deltas aren’t just more efficient; they’re easier to manage and pack more punch in the right conditions. But why stop there? Adding call side trades or exploring straddles could diversify premium collection.
I have been doing the same in recent months. Just wondering what delta and expiry do you normally go for? Doing both calls and puts diagonal.
I’m doing a few different variations to see how things play out. Similar to my earlier post, I’ve bought puts 6 months out close to at the money, and sold puts with 2-3 DTE also at the money or slightly in the money. I roll the longs about once a month.
I’ve also been working extensively with double diagonals, using puts and calls. They have been great, other than in April, where I was caught on moves both ways.
Finally, I’m exploring double back ratio diagonals where I buy more than I sell, but using diagonals to still have positive Theta. The ratios are there to protect me if the market crashes, as my analysis of my positions from April show that if I had more long puts than short puts during the big drop, I would have done just fine, and if I had more long calls than short calls on the big move up, I would have done really well. However, it is a drag during normal times to have a net long number of options, so I think this is something to consider for riskier times when either the market is too complacent or is starting to deteriorate.
In all cases, I’m trying to stay mostly Delta neutral, or potentially slightly positive. I am also rolling every day, but I don’t roll down completely on down moves, as I don’t want to get whipsawed on the return back up. So while I have a plan to follow, my mechanics are still a bit more artsy than I’d like, which is why I’ve been a bit reluctant to right extensively about these trades.
The overarching observation to emphasize is that these kinds of trades are extremely volatile. Every day is almost always a huge win or a huge loss. Wins pile up, but so can losses.
Could you tell us a bit more about double diagonals? In this low iv environment all my modeling shows double diagonals being a bad one.
There are three articles so far on diagonals of different sort on the website. The double diagonal simply means that a call diagonal is paired with a put diagonal. The issue with low IV is that when IV is collapsing, the long options lose a lot of Vega value from their reducing Implied Volatility. This is an issue on both the call and put side. You can adjust a bit by setting your strikes to have a net positive Delta so that the rising market gives a Delta boost, as well as Theta, to offset the Vega loss. Also, it can be a good time to have less time difference and look for Theta to work on your short strike more than the long.
I’m continuing to research this type of trade for ways to manage in changing markets as these types of trades are extremely volatile with the potential for very big gains and losses. It’s hard to avoid the big risk and keep the big upside. More to come.
Dear C. Allen,
thanks for the valuable website.
Have you done more research on why the backtest for January and February is in the opposite direction as SPX goes (loses), while for the rest of the year the direction of the strategy and SPX are actually the same. The first two months nothing special ( bullish ) happened with the SPX.
Wow, that’s a great question! I went into the raw data and looked at that time frame and found that there were a lot of out-sized moves to the upside during that time frame, so most of the losses were days where the long put lost more than the short put gained. This would point to the use of an early morning roll on days that gap up overnight to collect more premium, something that the backtest can’t test for us. Also, in digging into the raw data, I see that for Thursday and Friday opening trades the 2 DTE expirations picked are actually the next trading day, Friday and Monday, so the roll is occurring with only 15 minutes to expiration on the short side, so on a big up move, there isn’t much premium and the long put can lose much more than the short can gain on a big up move. Also, when I separated winning days, losing days that were down, and losing days that were up, I found that there were more losses in total from up days than down by almost a factor of two, so again an argument for early rolls on up days to collect more premium. This is over the entire time frame, not just the first two months.
Dear C Allen,
Your articles have been the most useful thing I’ve found anywhere on the web for learning how to trade options. I hang on every word and am putting together my own tool kit using your experience and suggestions.
I love this rolling daily diagonal trade and have followed it since it was a 5-year behemoth. Now that it’s down to a manageable 10-30 day proposition. I think I understand how to keep rolling the short trade, but as price moves, the two trades get out of synch. I’m wondering how you think about when/how to adjust the long trade over time?
Ken
Ken- Thanks for the kind words.
I’ve been adjusting my long side once or twice a week at these shorter durations. On down moves, I can roll down the long for credit which I can use to help pay to roll down the short side. On up moves, I roll up the long side and pay the debit, which should be less than the credits I’ve made on the short side. Not an exact science by any stretch, but I’m trying to blend mechanics of daily rolls and adjusting without over adjusting to every move of the market.
I’m also experimenting with pairing puts with calls on both expirations to balance out some of the risk. So far this is working well, but not ready to do a full write-up yet. I’m finding it easier to manage rolls, but I haven’t been through a big move to really test the mechanics.
Thanks. And when you roll, do you try and keep the same strikes for the short and the long? And keep nudging them both back to the original deltas? Or do you treat them independently?
Ken- at the same Deltas, the long and short puts will likely not be the same strikes, due to different durations. So, yes, I try to keep nudging each position toward my original Delta values. It depends on how much the market has moved and if I feel like paying a debit to move farther than I can when I collect a credit. I typically will try to get a credit for a day or two after a big down move before paying a debit to roll very far. The market jumps around a lot, so I try not to over-react to a single one day move. But with the long put having less duration, I can often move them together a similar amount and not have to take too big of a hit on a downward roll.
Hello Carl,
having been studying and trading options for more than 3 years I am still shocked that I just recently found your website, that having gone through most of the stuff out there I would definitely rank as one of the best for options knowledge. Very well done!
I am intrigued by most of your strategies, having traded various flavours of most of them, and this one in particular as I started years ago with something like a wheel approach that is not too far off, then evolved into more complex and longer DTE structures, in addition to short term and 0-DTE too.
VOlmageddon of August 2024 put an end to many of them, though I came out mostly flat, but I had explored various diagonal type strategies like this one as I very much like a daily or periodic stream of profits that averages ideally monthly or within 2-3 months max (I do not like having to fight with no profits for longer periods).
I have used Options Omega to backtest this one and the variations you mention and I get similar results, interestingly 2023 and 2022 were even better than 2024, and all variations show a decline in the last 3 months… also for this reason I wonder what version are you trading now as of February 2025?
Did you find any adjustments in approach/management needed (as many other strategies seem to have required since the elections)?
By the way, I found that adding a filter in backtest to avoid entries when there was a gap down improved results for all 3 years, except again the last 3 months.
As I would be interested in a “managed” approach to improve on the mechanical backtest, which I understand you correctly included just for completeness and baseline/feasibility. There are tools to backtest adjustment and management (ONE manual and Mesosim automatic), both take time and I may get into those on this, but some real trading experience is worth much more.
Thanks!
For backtests, I’ve assumed that I reset my positions to my target Deltas each day, which I don’t do in practice. The market jumps up and down day to day and week to week, and I prefer to roll in the direction of the market, but in measured amounts to avoid getting whip-sawed, which is what the back-test results tend to show. For put diagonals, this plays out for me with fairly significant dips in profits when the market goes down and then recovering to new high levels of profit when the market recovers. Shorter durations are helping to reduce the downside. So, I see this as a profitable strategy over time, but with lots of volatility, and potential for big losses in an extended down market. So far, I’ve been able to ride out down moves, but these moves have been fairly temporary corrections and not a bear market.
I’m studying pairing the put diagonal with a call diagonal, which seems to be more manageable and potentially more profitable with perhaps less downside. I’m still in early days of this trading and analysis, so I’m not ready to say that it is a better approach or even viable. My mechanics are evolving, so we’ll see.
Thanks for the quick reply.
Adding something that can help during market pullbacks would be great. Interesting idea to pair it with a CALL diagonal, would double the work but if it helps it would be worth it, and could be added on and off on a temporary basis as needed, while keeping the PUT diagonal as the income-making engine.
I would want to do a manual backtest in ONE using 2022 to see how painful it gets and get the whole feeling for this management.
I just want to add again many thanks for this very good work and website.
I’m actually managing this puts plus calls “double diagonal” strategy as a long straddle/strangle, and a short straddle/strangle. I can roll each strangle up or down fairly easily, so market moves are much easier to take. Like I said, I’m still working on what the best mechanics are, but I’m generally able to move my strikes to places where they can do what I need. A big move makes the long side profitable, while the short side decays more. Re-centering or moving close to center gives each part its best chance to do what it is supposed to do. More to come on this.
More and more interesting.
And although I am not a huge fan of signals in general, with such management any additional small help from some signal/level to be even more timely in adjustments could also give it some directional flavour. Though the more mechanical and neutral for me the better (normally these provide better results in the long run).
Looking forward to next updates!
Great site and I like your original put diagonal strategy and you seem to have settled on a 10/2 DTE as being more efficient in terms of capital and performance. Now you have been thinking about pairing it with a call diagonal. Have you put out an article on this? Would like to see the backtest on it. Intuitively however, I am wonder if it makes sense as the market tends to drift up, and are we overcomplicating the strategy by adding this call diagonal. Look forward to your reply and many thanks again.
Thanks for writing this detailed exposition. You did a very nice job of explaining the details, strategy choices and pitfalls. I’ve been trading this strategy for 6 years and I backtested it (manually 😩) from 2011-2019 with weekly options. My approach is different than yours so I thought you might be interested in my experience.
I trade SPX ATM puts with a 365DTE long, and short puts are somewhere between 3 and 7 DTE depending on market conditions. I roll the long put out to the next year after 6 months to limit time decay and roll it up more frequently (while staying close to 1 year expiration) in an up market so I control the max loss potential. I don’t pay much attention to this. I have a total disgust with losing short put trades so I always roll the short puts at the previous high strike during drawdowns – holding the strike so to speak. You’ve noted the difficulties that can arise with that approach.
I don’t have a full statistical analysis of the performance a la the backtester results you show but for 2020-2024 the quickie summary is as follows:
Ave P&L per option per trade:$392
Wins: 40% (defined as only above the last ATH)
Premium efficiency: 15%
Beta with SPX: 0.34
I could probably swing a more detailed 2024 comparison if you’re interested.
Generally, In an up market returns are > 100% on capital used ie amount of long put price used. I view this strategy as an equity replacement rather than income stream. Depending on your portfolio size it’s possible to generate significantly better than SPX performance overall while limiting downside potential and volatility- the beta is 1/3 that of an equivalent position in SPX. In my case I size short positions and the long put rolls to ensure I have a max loss potential of 15-20%.
Deep ITM short put rolls are painful since maintain a credit requires rolling out multiple months if it’s a substantial drawdown. If the market comes back in between you have to buy back the short that now has a lot of extrinsic in it. One way around this is to use long futures to replace the short puts until it’s possible to open a short put at the maintained higher strike closer in time with some extrinsic. But futures are only a short term solution since they have a roll cost also. On the plus side with this approach I didn’t even notice the August 2024 volatility spike.
Ultimately I have come to see this strategy in the long term and developed a holistic view. I try to build the cost of rolling the deep ITM short puts into the profit model of the strategy. Since profits are excellent in a up market relatively small debits for rolls are ok. For a long drawdown it may be easier on the nerves to just to get out and wait. I did this in 2022. It was painful and cost me because of poor timing but the bounce back was awesome.
This strategy can be far less time intensive than many I’ve tried and the rewards are nothing short of excellent. I’m still struggling with loss aversion with the short put rolls 😁
Thanks for sharing your experience. What is your mechanics for the short puts when we are near all time highs? Are you rolling every day? Are you waiting until the short expires or nearly expires? Since you mentioned debit rolls, I assume you do this occasionally to work your way down a bit.
I leave the short puts run to expiration. I’ll use 2 or 3DTE if the market is running up quickly and move out to 7DTE if it’s in a pullback.
The debit rolls are an unwanted feature of rolling deep ITM short puts. They are not systematic in the way you have discussed previously. I roll to re-capture the full drawdown so that there are no whipsaws if price suddenly jumps up. In a perfect world all drawdown losses are fully recovered but it’s almost impossible to roll for credit or break-even when the short puts are DITM.
Where do you find groups that discuss this strategy? It’s a bit esoteric for the mechanical crowd.
I came across this originally on a Facebook group, and a few other members took an interest in it a bit more than the larger membership did, and one person decided to start a Discord group to discuss the trade. At first, we had great discussions back and forth, with lots of different takes on appropriate mechanics for different scenarios. But, after a couple of market downturns, one by one the other people trading the strategy quit and I found myself the only person contributing to the discussion. I finally stopped posting my thoughts to the group and turned my efforts to write-ups for the website. So, I’d love to find an enthusiastic group that trades various forms of put diagonals, double diagonals, double calendars and similar strategies that sell short duration options against long duration options.
I can suggest the trade busters discord. You’ll find info at thetradebusters.com. They have a discussion topic of calendars in their many varieties as well as many other options strategies.
In the blog post, “Backtest for Rolling Daily Diagonal Choices,” you have a couple of graphs and the legend has “DIT” in it. I can’t figure out what that is referring to. An explanation would greatly be appreciated. I am thinking deep in the money, but in the context does not seem to make sense. Thanks in advance
It is Days in Trade. If you start with 5 DTE and are interested in what the position looks like at 4 DTE, that is 1 DIT. I chose that way of looking at this trade because diagonals have different days till expiration, and I can’t easily show what each expiration DTE is after one day, so I used 1 day in the trade. Sorry if that wasn’t clear. I appreciate the feedback. I’ll do an update and make sure when I use that in the future, it is explained better.
Okay, one other question and sorry if it is naive on my part. For the 10/2 DTE diagonal – I am assuming that the 10DTE is just pure calendar days whereas the 2 DTE is trading days? or are they both trading days.
I started paper trading it both ways just recently, but with what happend with the market this week, I took a small break and I am starting to reengage it.
Thanks in advance for all the help. This site is a gold mine!
That’s a really good question- I wasn’t clear. You are correct. 2 DTE means 2 trading days, and 10 DTE is pure calendar, but since that changes the number of trading days as you approach the weekend, it might be better to look for 8 trading days, so you can roll out every day if you want to keep your long duration consistent.
Hi
This site is a goldmine. Great write up. Thanks.
I have noticed from your comments above that you don’t trade the daily diagonal covered put with the best back test parameters, namely long put 10 DTE, short put 2 DTE at 55 delta.
On September 24th, You wrote:
“I’m doing a few different variations to see how things play out. Similar to my earlier post, I’ve bought puts 6 months out close to at the money, and sold puts with 2-3 DTE also at the money or slightly in the money. I roll the longs about once a month.”
Please help to to understand if 6 months DTE back test better, or is there any other reason for this methodology?
Thanks for all these write ups.
Suresh
Thanks for the kind words. When I originally wrote this I hadn’t traded the 2-10 DTE diagonal much as I had recently done the back test that showed it to have better performance. In all cases, the back test results don’t take into account mechanics that may vary from the very limited mechanical backtest choices. So I always consider backtests as a good gross check, but hope that better mechanics will improve results. What I’ve found is that my way of trading this trade has been extremely volatile in both directions, with months of incredible returns and months of incredible losses. It’s averaged out to excellent returns, but this is by far the most volatile trade I’ve ever taken on. It doesn’t take much of a move to lose 50% or more, so I’ve dialed back my initial enthusiasm for the trade. I continue to study and research as this seems to have great potential if only risk could be controlled.
C Allen, great site with great ideas. Thanks for sharing. I was wondering if you could detail exactly how you would trade the put diagonal along with the call diagonal, a double diagonal as you would call it. I am also wondering if you had backtested this, and whether this is indeed better than just trading the put diagonal.
Thanks for the kind words. I’ve been trading the combination of a put diagonal with a call diagonal for the past year. I have an article written, but I’m hesitant to publish it, because like everything associated with the various versions of diagonals I’ve written about, these trades are extremely volatile, and I don’t want to have someone read about this and think it is a sure thing. The good news is that over time, I’ve seen a nice profit, over 200% in a year. The bad news is that I’ve lost as much as 150% in a single month- everything I had in the trade, plus more that I added.
To be fair, that isn’t really a result of adding diagonal calls, puts alone are extremely volatile. Adding call diagonals slightly reduces the volatility, but on very big moves of more than a percent or two in a day, it is easy to lose on puts and calls. If the market drops a lot, short puts will lose much more than the long puts gain, and long calls will lose more than the short calls gain. On big up moves, the opposite is true. The longs don’t move as much as the shorts, and whatever short is making money only has so much profit to provide. The times that win are inside days.
I’ve backtested variation after variation, looking for a sweet spot, one with great returns and low losses. But you can’t get outsized returns without outsized risk. Maybe I can show 200% gains but with a 90% max drawdown. So, the only way to realistically make this work is to back off on time differences so that max losses are reduced, but also average gains, or keep a huge amount of cash reserves available for the time that the market crashes for real and roll with the ups and downs the rest of the time.
There is no magic answer- as I’ve described this trade, it is extremely risky.
I am wondering if we can use a VIX cut off, e.g if VIX is above 25, don’t trade it. Likewise, if one is in the trade, and VIX bumps up due to some war, just take the loss and exit and don’t do anything till it comes down. I get your hesitation on publishing the double diagonal writeup but if you put the disclaimers at the top in bold, nobody is going to have a problem. I for one would like your thoughts on the double diagonal. The put or double diagonal are probably not trades we should sink our whole account on, but maybe allocate a small percentage due to the potential large drawdowns. We are all big boys here and we know the risks of trading and investing. Thanks again for your very informative website!!
One of the many backtest variations I tried was exactly what you described- get out when VIX goes above 25, then wait until it goes below 18 to start trading diagonals again. It seemed like that avoided most worst-case scenarios from the past several years, as VIX generally sounds a bit of an alarm before the bottom drops out. But, I worry that I could be cherry-picking data because there aren’t that many times that this has happened. However, we do know that when VIX is high or very high, the market makes very big moves, both up and down, either of which is bad for diagonal positions. So, logic and the data seem to point at this as a way to hopefully avoid the worst losses.