Change Log for Website

This post lists recent additions and changes to the website. For frequent users, this change log might be helpful to see what has changed from past visits.

The following is a listing of recent additions and changes to the site. For frequent users, this change log might be helpful to see what has been added new or changed.

December 30, 2023: I added a couple more books to the Resources page. I also updated Tasty links for their new TastyLive.com URL.

December 20, 2023: Made a number of changes and additions to the home page of the site. With all the new content, it seemed like it was time to highlight some of the content that isn’t as obvious.

November 22, 2023: Added a duplicate post on the 1-1-2 Put Ratio Trade. I did this to capture the search engine traffic from the numbers of traders looking for information. So, whether it’s 112 or 1-1-2, there’s a write-up. Just read one or the other- they are the same.

November 14, 2023: Added a page on the 112 Put Ratio Trade. While I mentioned it a bit in the post on the 1112 Put Ratio Trade, I decided the naked option version deserved a write-up of its own.

September 19, 2023: Added a page on Covered Calls. Yes, I know I just wrote a post on the same subject. (Secret note: the write-ups are exactly the same. This is actually a test to see if pages do better than posts in getting search engine connections. Universally, my most read articles are always pages, but maybe that’s just a coincidence. Most readers would never recognize the difference between a page and a post, but posts are supposed to be part of an ongoing blog, while pages are more “permanent.” I’ve used them interchangeably, and I want to make a data-driven decision on what the impact of that choice is.)

September 18, 2023: Added a post on 5 Bullish Call Trades. This is the culmination of a series of trades that I felt like I had overlooked regarding data driven ways to utilize calls in a bull market without absorbing too much time decay. With the market in what appears to be a bull market, it was time to focus in on this topic. 4 of 5 of these trades have recent extensive write-ups that were completed in the past 3 months.

August 4, 2023: Added a post on Buying Out of the Money Call Spreads. This is a strategy that would appear to most option traders who mostly sell options to be a sure loser, but back-testing shows it to be quite profitable over time.

July 26, 2023: Added a post on the Poor Man’s Covered Call, a low cost variation of a Covered Call, based on selling a call against an in the money long call that acts as a replacement for stock. So, a bit of a cross combination of the two most recent previous write-ups.

July 25, 2023: Added a post on Covered Calls. Not sure why I never wrote one before, but given it is one of the most popular option trades around, I thought it was time to weigh in on it with a level of detail that isn’t available many places.

July 5, 2023: Added a post on Replacing Stock with a Call Option. When markets are going up and IV is low, buying calls can be a good way to get in at a low cost. This post goes into more detail.

June 19, 2023: Added a post on Underlying Security vs Risk Permission. There are a lot of factors to picking the type of security to buy or sell options for a specific type of trade. This post digs into what to consider and why some approaches may be better than others.

May 24, 2023: Added a post on Trading Options while working a Full Time Job. I went back to work this year and changed my trading routine. I know many readers can relate, even if they just want to make better use of their time.

May 20, 2023: Added a chart to the 1 DTE Straddle post to show profit and loss at various times of the day.

May 17, 2023: Added a post on Covered Strangles, a conservative options trade that reduces volatility with higher probability of profit than owning an equivalent amount of stock outright. It’s my first deep dive into Level 0 option trades, something I’ve had a number of requests to address.

February 27, 2023: Added a new Phone Stock Charts page with stock price charts formatted for a smart phone, and potentially screen-cast onto a monitor or TV. Not for everybody, but if this is something you are looking for, like I was, you’ve found it.

February 27, 2023: Updated the Current Prices page with more interactive charts, replacing those from a previous provider that had security flaws.

February 26, 2023: Added a post on the topic of 0 DTE trades.

January 16, 2023: Provided responses to a couple of great reader comments and questions regarding the 1-1-2-2 trade.

January 13, 2023: Added a new post on my 2022 learnings.

January 3, 2023: Added a new post on buying 1 DTE straddles on indexes.

December 28, 2022: Added a new page describing the 4 Different Types of Option Underlying Securities– stocks, ETFs, indexes, and futures.

December 23, 2022: Added a post regarding the best Delta for ROLLING put spreads. This is a new topic that I had curiosity about from years of observing that some rolls do better than others, and I couldn’t figure out why.

December 20, 2022: Added a post researching the best Delta values for selling put spreads. This is a follow up to page on credit put spreads written earlier.

December 6, 2022: Added a page on Options Portfolio Management.

November 28, 2022: Accepted an extended comment to the page Rolling Iron Condors and added a response. Comments are always welcome and appreciated. Note that comments from first time commenters must be reviewed and accepted to keep those crazy spammers from ruining the site.

November 9, 2022: Response added to a comment about how to roll a back ratio call spread up or down to get back to Delta neutral.

November 3, 2022: Added a new page on Options Margin Usage. In this page, I compare different types of margin available for option traders and the benefits and risk of each.

October 15, 2022: Worked with the ad provider to reduce the number of ads on the site and make them less obnoxious. Should be no more pop up adds when changing pages, and less ads per page.

September 30, 2020: Added a new page explaining how brokers permit different levels of risk in option trading.

September 7, 2022: Updated the Favorite Strategies Page and the Ratio Spread Page, adding more details to both.

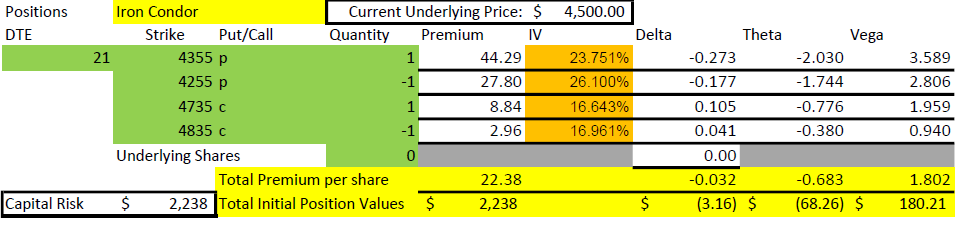
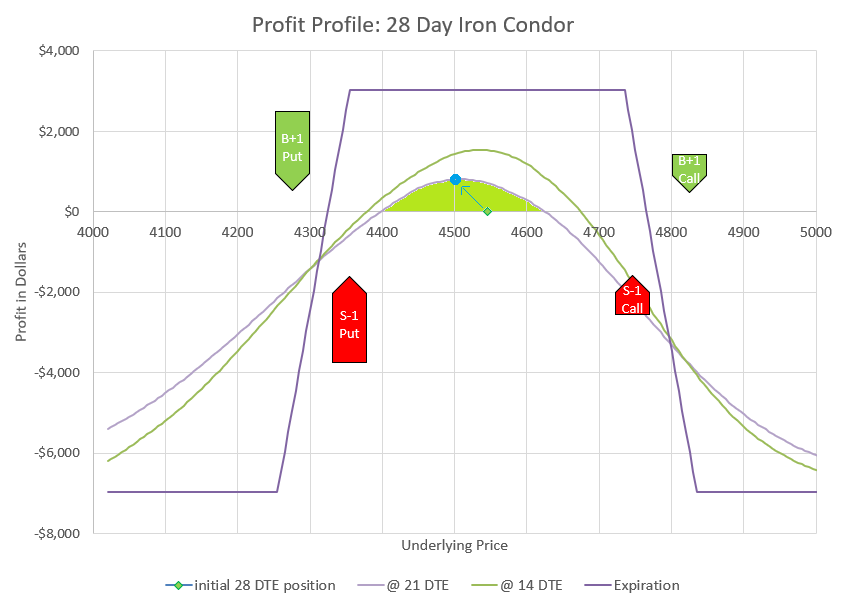
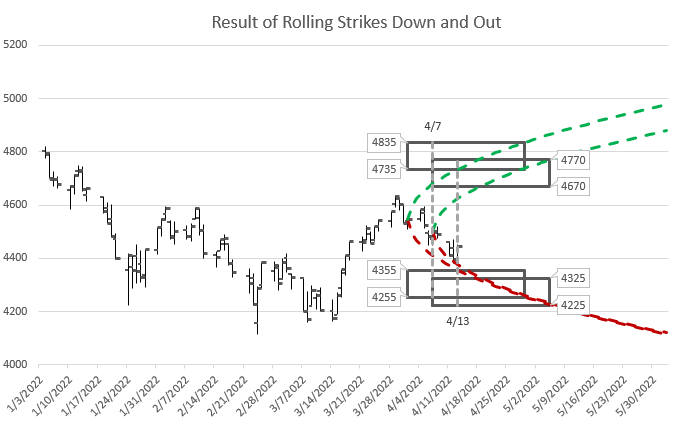
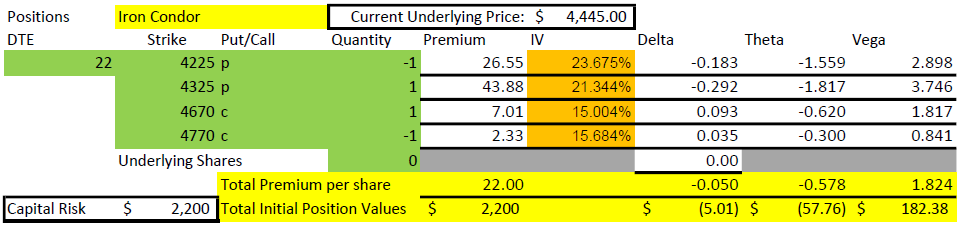
August 25, 2022: Added a new post with an example that illustrates the Goals for Rolling Iron Condors.

August 23, 2022: Replied to a new comment about my alternative 7 DTE trade posted a week ago.

August 18, 2022: Added an alternative strategy in a comment for the post on 7 DTE trades.

August 18, 2022: Added a post describing the 1-1-2-2 Ratio trade.

August 2,2022: Responded to a comment on rolling Iron Condors with perspective on defending call side in up moves.

June 5, 2022: Added this page- the change log

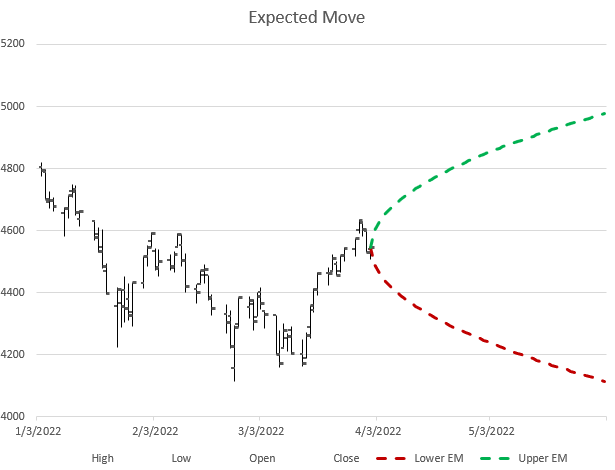
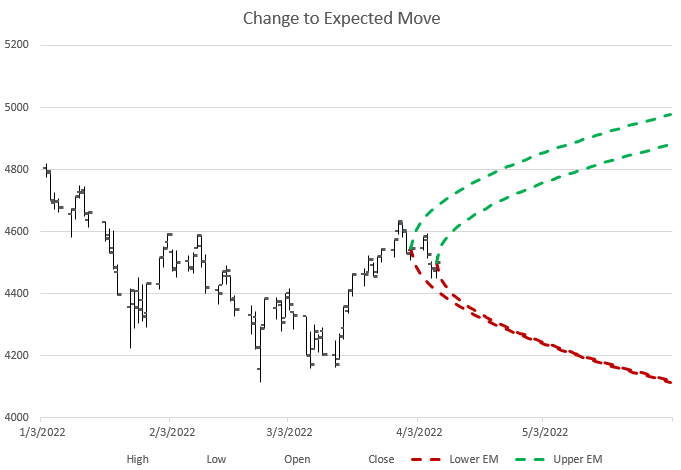
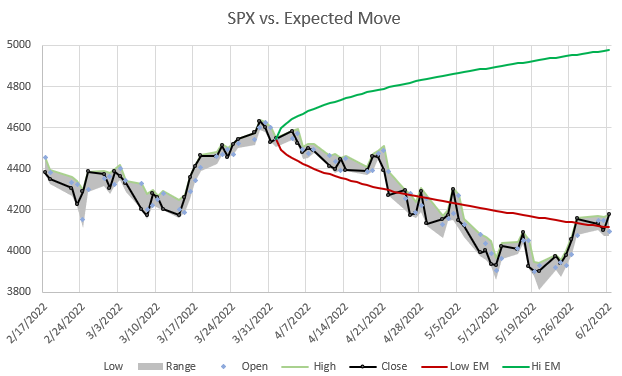
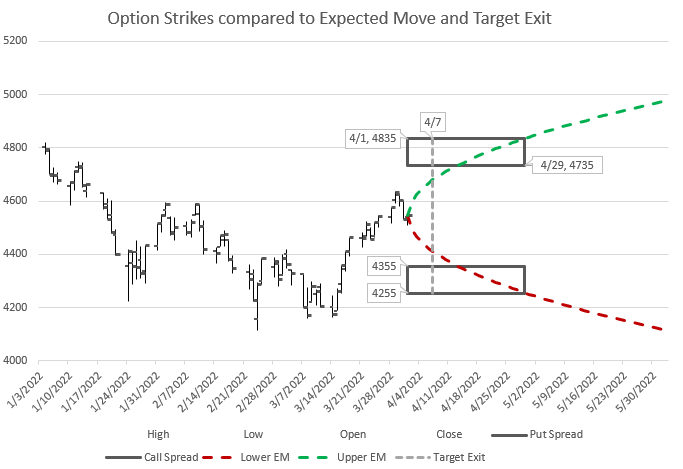
June 5, 2022: Added new post explaining the Expected Move and how to visualize it.

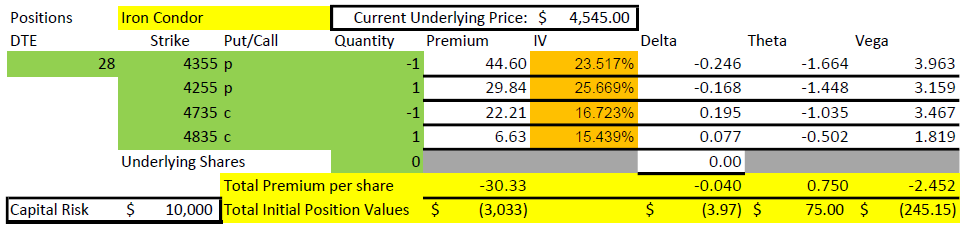
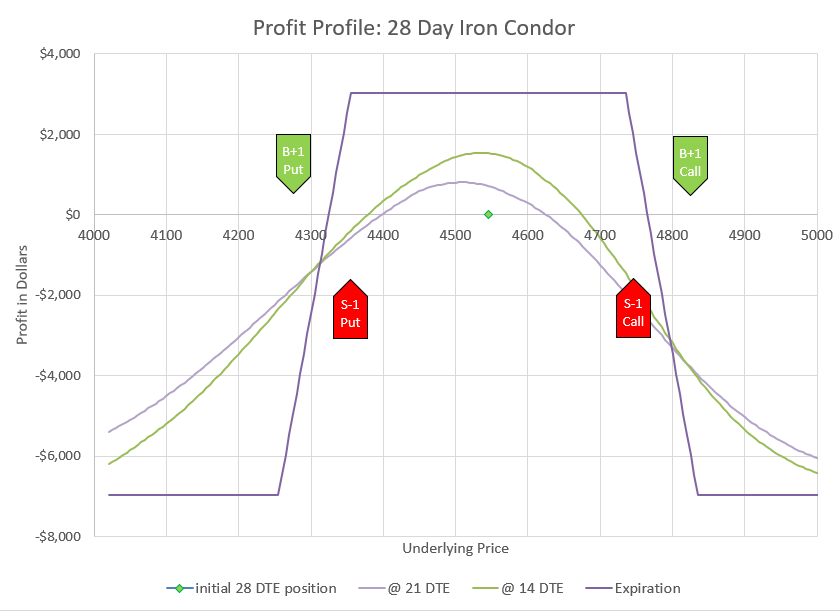
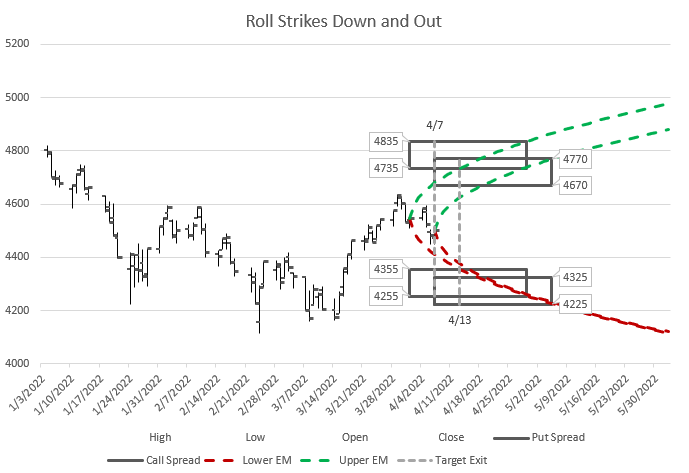
June 4, 2022: Added a new post explaining my approach to rolling Iron Condors in bear markets.

March 12, 2022: Added a post explaining different types of options on the S&P 500 index products.

January 14, 2022: Added a post about comparing risk of different option strategies.

If there are subjects you’d like me to address in future, leave a comment below.

Visualizing the Expected Move

Understanding and charting expected moves based on implied volatility and option pricing can be a helpful tool for option traders.

The expected move is a concept that is important for option traders to understand and use. It took a while for me to grasp this when I started trading options, but now it is something I consider in trading on a regular basis. Expected move allows a trader to put into context what implied volatility and option prices are predicting for the future. While expected move isn’t a Greek, I’m including it in the group of Greeks because it is derived value from option prices and is closely related to some of the Greeks and the ways they are calculated.

Option prices increase and decrease with changes in implied volatility. Actually, since implied volatility is just an “implied” concept, Implied Volatility is the explanation of why option prices go and down after taking into account the other key pricing factors of time and price movement. Implied volatility is a percentage that represents the standard deviation of price movement for the next year, as implied by an option’s price. In any normally distributed data set, approximately 68% of the data will be within one standard deviation of the mean of the data. Stock prices aren’t typically normally distributed (they won’t perfectly fit in a bell curve), but for simplicity most people make the assumption that they are and understand the differences in outcomes to consider. I won’t dig any deeper down this hole, because for most purposes the statistics work pretty well for stocks and options, despite the simplifying assumptions that most traders make.

Options have the unique ability to express how the market in general expects prices to vary between the current time and option expiration. This is possible because the market of buyers and sellers settle on prices that balance risk and reward for future outcomes based on all currently available information. The result is that we can determine how much the market is expected to move in any timeframe, based on option prices. It is kind of like sports gamblers betting on the over/under of a game score- the betting line is determined by the cumulative expectations of those wagering based on what is known about the scoring and defensive ability of each team.

Ways to measure the expected move

One very quick way to determine how far the market is expecting the market to move by a given expiration is to add together the put and call premium of the option strike closest to the money. As I write this, the S&P 500 index (SPX) sits at 4108.54. The closest option strike is 4110. Looking 40 days out, the midpoint value of the 4110 call is 125.60, and the 4110 put is 123.15. Adding these together, we get 248.85. Why is this significant? Let’s say one trader buys these two options (a straddle) and another sells the two options. The break even is a move of plus or minus 248.85. Both the buyer and seller would feel like this is a fair trade. The market of buyers are hoping that the market moves more than expected, and the sellers are hoping it moves less. As a balance, it is a measure of the expected move.

Studies by TastyTrade.com show that this at the money straddle pricing often over estimates actual future moves slightly. For their TastyWorks.com trading platform, they use a modified formula that takes the at the money straddle and the first two out of the money strangle prices in a weighted average to calculate an expected move that historically is closer to the moves that actually end up happening. For the same timeframe, Tastyworks has an expected move of +/-263.83, so for some reason at the moment their calculation is slightly higher than the at the money straddle. Only a few trading platforms actually show an expected move calculation, and it is done differently at different brokers as there is no default standard.

How does this relate to implied volatility? Well, as it turns out the implied volatility multiplied times the price of the underlying stock can match fairly close to expected moves calculated by at the money straddles. The straddle or similar TastyWorks method come out to approximately a one standard deviation move. So a very quick calculation is to take implied volatility multiplied by underlying price multiplied by the square root of the fraction of a year until expiration. The square root part is a little much to begin with, but it is based in statistics and math. So, for our previous example, we will use the current VIX value for volatility of the S&P 500, which is currently 24.79. We have 40/365 of a year for 40 day move, and the square root of that fraction is 0.33. With the current SPX price still at 4108.54, we multiply by 24.79%, then by 0.33, and get 336.10. This would imply that the market is expecting something less than a one standard deviation move in the next 40 days. However, the calculated one standard deviation move is just 27% more than the TastyWorks expected move. For something that is “implied” from option prices and calculated in a couple of different ways, that actually is fairly close- close enough for us to have a ballpark estimate of what the market is likely to do in the future.

So, what is the best way to determine an expected move? Well, there is no right answer because no one really knows what the future holds. But, we know that more often than not, options are overpriced for the moves that eventually happen, so implied volatility will typically be more than realized volatility, so methods that show smaller expected moves will likely be closer over time. But to use the straddle method, a trader must have access to option tables for every expiration of interest and do calculation after calculation to see how the move evolves with time. Using the calculation of volatility and the square root of time allows a quick way to estimate moves over a broad range of time. For option sellers looking to “play it safe,” this calculation may encourage the choice of wider short strikes.

Charting Expected Moves

Once a trader understands the concept of the expected move, it often helps to see how this works out on a chart over time. Let’s look at a chart for early 2022 for SPX.

April 1 Expected Move
At the beginning of April 2022, we can see the expected moves for the next few months.

After a week we can see that the moves stayed inside the expected move. With another week of information, we can update our expected move chart.

As time passes, the expected move changes as well with new pricing information.

As it turned out, this period of time included a fairly strong bear move down that was outside the expected move for a while, but then returned inside.

expected move vs realized move
Using the original expected move, we can see how the realized move played out.

This example illustrates a point worth noting. The longer the time duration, the more likely that the realized move will stay within the expected move. Time allows probabilities to play out more.

Another factor with expected moves to consider is that implied volatility can vary significantly over time and those variations can dramatically impact expected moves of the future. Consider that an expected move when VIX is 30 will be twice as large as when VIX is 15. When implied volatility is high, the market is expecting big moves in the future. When IV is low, the market is expecting calm in the future. When the market gets volatile, it tends to take a lot of time to calm down. On the other hand, when markets are very calm, sudden changes can cause sudden spikes in implied volatility and future expected moves. It is far from an exact science, but it is the best real time future indicator of movement we have.

Regardless of how we calculate the expected move, it gives us a good idea of what the market currently collectively thinks the future movement of pricing will be. For planning option strategies, this can be very helpful.

The power of rolling Iron Condors

In the bear market of early 2022, I re-discovered a strategy that I had mostly discarded during the bull market of the preceding years, the Iron Condor. The Iron Condor is primarily a neutral trade that when managed with aggressive rolls can provide good returns in choppy, down-trending markets. My goal is to maintain a position that can tolerate fairly big market moves up or down, while benefiting from time decay.

I had discarded the Iron Condor trade because I found I was always losing on the call side of the Iron Condor. Initially, I liked the idea of making money on both sides, but I found in a constant up market, I often lost more money from calls than I made from puts. So, I switched to mainly put spreads and other short put strategies, which did great. But then 2022 came along, and it was clear that the market was no longer going up, and that we were heading for a bear market. I started adding credit call spreads to my credit put spreads to balance risk and have a neutral strategy. Over time I saw that some of my set ups and management strategies were working better than others, so I investigated and came up with a process that now works well in the current bear market environment.

The basic setup of an Iron Condor

Selling Iron Condors is an extremely common option trading strategy. The strategy is a combination of two calls and two puts, four separate options working together. Usually, an out of the money put and out of the money call are sold, and then a further out of the money put and call are purchased to define the risk and reduce cost. The trade wins at expiration if the price ends up between the short strikes, and hits max loss if the price moves beyond one of the long strikes. However, I rarely if ever hold to expiration and roll my position way before expiration is a concern.

California Condor
Here is an actual California Condor with a profit curve of an Iron Condor option trade drawn over it.

An Iron Condor is named after the shape of the profit curve at expiration, which kind of looks like a condor with a bit of imagination, kind of like how star constellations are named. The iron part of the name designates that it is made up of a combination of puts and calls, as opposed to a put condor, or call condor which has four legs of the same type of contract. An example of a put condor is the broken wing put condor strategy I have described in a separate post.

To build on the condor metaphor, the difference in option strikes are often referred to as the body and wings of the combination trade. The body is the difference between the short put strike and the short call strike. The wings are difference between the call strikes or between the put strikes. The wings on the puts may be equal in width to the wings on the call, or they may be different. Wings that are different widths might be call unbalanced, or broken wings, as the profit profile will no longer be equal levels each end of the price ranges of the trade.

My preferred Iron Condor setup

What I have determined works best for my management strategy is to use the S&P 500 index options (SPX), targeting a starting point 28-35 days from expiration, with option Delta values of 30 for the short strikes and around 20 for the long strikes. I like equal width for the put side and call side, so the Delta values for calls will be a bit wider than the put side, and the net Delta of the Iron Condor will be slightly negative. With implied volatility between 20 and 30%, I generally target 100 wide wings, with the body between the short put and short call of around 15o points on SPX.

Premium and Greeks for Iron Condor
Here is the setup of an actual trade from early 2022 on SPX using the criteria from this post. In this example 30% of the wing width was collected, and a little lower deltas were used.
Profit Curve
For the above example trade, the goal is to keep in the profit zone for the first several days of the trade- the positive area under the 21 DTE curve.

I use SPX because it is the least likely underlying to have outsized moves. It is also very liquid to trade, has tax advantages in taxable accounts, and has expirations multiple times per week in the timeframes I trade. Depending on account size or type, other option products for the S&P 500 may be appropriate and can be used instead with essentially the same strategy. Other indexes or even individual stocks can be used, but managing can tougher with bigger moves, less expirations, and less liquidity.

I use 28-35 days to expiration (DTE) because my position can tolerate most reasonable moves while still having decent decay. I’ve used timeframes as low as 7 DTE, but find that many one day moves can push a position out of the profit zone, and I find myself fighting a losing battle too often. Longer durations of up to up to or over 100 DTE can work, but decay is slower, and there are very few expiration choices to roll to for the way I like to manage. All that said, my plan can vary to different timeframes, with the goal that I will only hold the position for somewhere between 1/10 and 1/5 of the time left to expiration- for example, a 30 DTE would be held 3-6 days before rolling, while a 100 DTE position would be held 10-20 days.

I choose 30 delta for short strikes and 20 delta for long strikes because they are the most forgiving in a move, while still offering reasonable decay as a spread. Higher deltas allow for more premium to be collected, and price movement will often be well tolerated as the long strike of the tested side will increase and the short strike of the untested side will decrease in value, compensating for much of the increase in value of the tested short strike. The goal of my management strategy is to keep this relationship intact, so that price movement has little impact on my option position value. I think of the area where deltas of the four options balance each other out as the profit zone. Staying in the profit zone allows Theta, or time decay, to do its work and deliver profits. I have used strikes with a bit higher delta values, but if too high, the two sides will get tested more often and then require more management. In the past, I often used lower delta spreads for safety and better percentage decay. However, I have discovered that low delta positions don’t actually tolerate price movement well because the untested side of an Iron Condor quickly runs out of premium to offset any of the movement of tested side. This observation has been a game changer for my use of Iron Condors.

I use equal width wings on the Iron Condor for a couple of reasons. Equal width seems to tolerate price movement, both up and down. Equal width also leads to a net negative Delta position, decreasing the total position profit when prices go up and increasing profit when prices go down, which is good in a bear market where downturns are frequent. Negative delta actually is somewhat neutral if the value is only slightly negative- Iron condors also have negative Vega, or decrease profit when implied volatility goes up. So, typically when prices go down, implied volatility goes up, and impacts of the negative Delta and negative Vega cancel each other out.

My Iron Condors are opening somewhere around 50% of the width of the wings. For example, if I have 100 wide wings, I would expect to collect $50 premium. I initially resisted this, thinking that the probabilities would be too low. However, since the time in the trade is so short, and I plan to actively manage moves against my position, I find that the risk reward ratio becomes favorable. However, the example trade that I’ve used is a little wider body and collected only 30% of the width.

Strikes compared to EM
This chart shows previous market movement at the time of entering a trade, along with the expected move based on implied volatility and boxes to illustrate the strikes of the Iron Condor. The dates are the opening date, the expiration date, and the planned target date to close. This trade used long strikes that were at the expected move at expiration.

I have devised a graphic that may help to visualize this setup in regards to the expected move and time frame of the trade. The graph has several components- a historic rendering of what the index has done for the past several weeks, a curve showing the expected move for the next several weeks based on current implied volatility, and two boxes to represent the put and call strikes shown from the time of opening until expiration, and the target date to take action. My point with this chart is to show that while the strikes chosen are within the expected move at expiration, they are outside the expected move through the time I expect to be in the trade before I manage it. Said another way, if the position were held to expiration, it is very likely it would be breached on one side, but because the plan is to manage early, a breach is not likely- it would take an outsized move beyond the one standard deviation expected move.

Managing the trade with rolls

I manage my Iron Condor with what I think is a fairly unique rolling strategy. I roll my positions out in time and change all strikes in the direction that price has moved. If price goes up, I roll all the strikes up. If price goes down, I roll all the strikes down. I just roll whichever way the market goes. Here’s the interesting part- if I keep in the “profit zone,” I can roll up or down for a net credit with each roll, and my existing position will have a net profit. Usually, one side will be sitting with a profit and one side with a loss. The losing side is being tested- its strikes have higher deltas than when the trade started. The profitable side will have lower deltas than when the trade started. My profitable side should have a bigger profit than the loss of losing side. When I roll, I will likely have to pay a debit to get my losing tested side back to a good set of strikes at the new expiration. However, I should be able to collect a bigger credit on the profitable untested side than my tested side cost. Ideally, every roll is closing a profitable trade and collecting a net credit to open its replacement. All of this sounds great, too good to be true, but there are a number of details to unpack.

The first challenge is to stay in the profit zone. My general rule is that if I keep my untested short strike must never drop to a Delta value below 15. The reason is that when the Delta of the untested side gets below this point, it quickly stops being able to meaningfully contribute to offsetting price movement in the tested direction. For example, if the price drops, the short call will get further out of the money and drop in value, while the puts will go up in value. For a while the Deltas will mostly balance each other out, but as the Delta of the short call drops below 15, the put spread will start increasing much faster and the calls decreasing less. If this happens, it is time to act and roll all the puts and all the calls down to where there is again premium on both the put and call side. If price has gone up too much, it’s time to roll up all the puts and calls.

Actually, I try not to wait until the untested side gets to 15. I think of my position of having three possible states, green, yellow, or red. Green is when both short strike’s Deltas are above 20- everything is great and there is nothing to do. Yellow is caution, one of the short strikes are between 20 and 15, and probably will need to roll soon. Red is stop and take action, one of the short strikes is 15 or below, so it is time to roll immediately. So, my choice is clear for Green or Red, but I need to use some judgement in the Yellow state. If the day starts in the Yellow, I am more likely to let it ride for a while and watch to see if it recovers or gets worse. If the market has trended throughout the day and moved into the Yellow, I am likely to roll before the end of trading so I don’t end up deep in the Red overnight. If there is a strong trend pulling the position quickly toward Red, that may also be a good indication to act. Yellow is a judgement call.

I find that it is harder to have a profitable, credit roll when tested on a quick up movement. As mentioned earlier, equal width wings means that there will be a negative delta overall, and while volatility reduction can help, big up moves can be hard to stay on top of. That’s why this strategy works best in a bear environment, when the market is trending down.

Don’t over manage. Markets bounce around a lot, and it can be tempting to want to act on each little trend that happens. If I have the right strikes- the right body width and wing width for the market conditions, my position should be able to tolerate price movement. If I’m trading at 30 DTE, I want to wait 3-6 days between rolls, so I need to be choiceful about not rolling too often. If the market moves a huge amount in a couple of days, I may need to roll early, but then I’ll want to try to go longer before the next roll. The other thing to consider is that often the markets overshoot in one direction or the other, so I try not to move too far to chase moves that go on for days, and stay patient that the market will counter the trend.

If a position isn’t winning regularly and isn’t holding its premium in control, that’s a sign that the strikes aren’t right for the market and the duration. For a while I was trading 7 DTE Iron Condors on SPX with around 100 wide bodies and 50 wide wings. I would adjust nearly every day, but I couldn’t keep the position in the profit zone, and I often took losses. There wasn’t enough space in the body and the wings weren’t helping enough. By widening out the body and wings and adding more time, I found the position much easier to manage, and more likely to be profitable, and much less likely to take a big loss.

One way I can tell if I have a forgiving position is to compare my premium to the premium of the same position a few strikes higher or lower. For example, with Schwab StreetSmart Edge, I can pick Iron Condor as a strategy, pick an expiration date, pick a body width and a wing width. The application will then give me a list of strike combinations and premiums for those parameters. If all the choices around my preferred strikes have similar premium, then I know that price movement will have minimal impact on my chosen position. If there is a rapid change in premium for other strikes above or below my choice, it means my Iron Condor parameters are not very forgiving, and I should adjust time or widths or both. Other brokers will have similar ways to compare prices by shifting up or down all the strikes.

I have updated the earlier graphic to illustrate how a change in price over time will dictate the choice of a new position to roll to. The new price now dictates a new expected move, and new ideal strikes and expirations. Hopefully, this chart will help those that are fond of graphical illustrations.

roll down and out
After 7 days of mostly down moves, I decided to roll down my positions and roll out to a later expiration. In this image, the old position and expected move are there along with an updated expected move and new strikes.

Eight legs in the Roll

Since an Iron Condor has four legs, rolling involves closing four legs and opening four new ones. I don’t think any broker or exchange allows a eight-legged trade, so at a minimum this will take two trades to complete the roll. My preference is to roll the puts as a trade, and roll the calls as a trade. I usually start with the side that is being tested and might need a debit to roll to a new expiration and strikes. Then I do the other side, usually moving the same amount and keeping the same width, expecting to collect more to roll the untested side than I pay to roll the tested side.

At times, I may have a situation where I don’t have enough buying power to roll one side while the other side remains in place. If that happens, I’m probably using more of my buying power than I should, or the position is just too big for my account. It isn’t that big of a deal to manage the situation, however, I just close the untested side out and roll the tested side, then open a new position on the untested side. Worst case scenario, I can close the whole Iron Condor at once- freeing up its buying power, and then open a new one with the same buying power. As long as the wing widths are the same and the new Iron Condor collects more to open than the old Iron Condor cost to close, there should be a net gain in buying power. But again, any time buying power restricts a trade, it is probably time to pare down some positions in the account.

How Iron Condors tolerate price movement

Probably the best way to explain how an Iron Condor tolerates price movement is with an example. Earlier in this post I showed an opening trade from April 1, 2022. Let’s look at it again and look at how it fared after 7 days.

Premium and Greeks for Iron Condor
Here is the setup of an actual trade from early 2022 on SPX using the criteria from this post.

Notice that the premium collected is approximately $15 each on the put side and the call side.

Closing position
After a week, price has dropped to 4500, but the premium has dropped for a profit.

The premium on the put side has gone up to around 16.50, while the call side has dropped to just under $6.

After 7 days
After 7 days the premium increased on the put side but decreased on the call side, as illustrated by the larger and smaller strike position arrows, and the result is a net profit.

So, after 7 days, the trade made about $800 on $10,000 risk, an 8% return. But, that’s just the start- the plan is to roll, and so the closing trade above was combined with the following opening trade:

new roll position
On April 7, this trade was opened while closing the old position for a net credit and strikes that are back at the edge of the expiration expected move.

The combination of closing the old trade and opening the new trade is a net credit of just under $14 premium. This is the result we are looking for- a profit on the trade being closed, and a credit to move out in time and get to better strikes for the latest situation.

And just to finish the example trade, let’s look out another week and see what happened to the market and the trade that was rolled to.

roll result
After rolling down, the market kept going down, but stayed within the new strikes with plenty of space to spare.

By April 13, the market had dropped even further, approaching where the puts from the original position had been. However, the roll down gave the new position plenty of space and the trade was sitting at a profit, and ready to roll again.

Closing the rolled position
After 6 days, the rolled position had decayed even after a market move. Again, puts lost money, but the calls made the position profitable.

This trade made $1430 in 6 days, a 14% return on capital. Since the market went down, the put side of this trade lost money, although not that much since the price didn’t end up that close to the put strikes since our new strikes were lower than the old ones. Time decay helped counter the price movement against the puts. The money was made on the call side through both price movement and time decay. In the end time decay, represented by Theta, eats away premium as long as price doesn’t get too close to the strikes.

These are examples of trades I did during the Spring of 2022 in the face of a bear market. Not every trade faired this well. Some market moves were too fast and too far for me to be able to roll before the position went too far to one side. But more often than not, this rolling methodology has kept me from having positions blown out, and keeps day to day portfolio value from varying out of control.

You may notice that the example trades shown here don’t exactly follow all the mechanics I’ve described. Since those trades I’ve become a little more likely to intervene early, although it’s a balance with avoiding over-adjusting.

Finally, I don’t always get my rolled positions re-centered, like I did in the example I presented here. Often, I’m happy to just move in the direction of the market and make sure my new strikes are a bit out of the money on the tested side. In this crazy bouncy market, we get lots of reversals, so I let my positions stay a little off when the market has moved a long way and technical indicators suggest the last several days move may be about finished. However, these choices come down to individual trader preference and market outlook. No one knows what is happening tomorrow or next week, so we each have to decide what trade is best based on the information available. For a real life example of this type of decision making in action, see my post on the Goals of Rolling an Iron Condor.

Good luck trading and rolling Iron Condors!

error

Enjoy this blog? Please spread the word :)