When I sell options, my favorite management strategy is to roll the option out and collect a credit. I like to do this win, lose, or draw. With a covered call, I like to roll almost no matter what, even when my rolls are deep in the money. Over time, I’ve found there are some advantages to this strategy, particularly in bear markets.
If you read a lot of my explanations on selling calls, you’ll see that I have not been a big fan of call selling in general. That goes for call credit spreads, the wheel, and selling covered calls. My general complaint is that because the market goes up much more often than it goes down, short calls tend to lose money. I’ve seen it in my trading and I’ve seen it in back tests. But covered calls are one of the most popular trades out there- so why are there so many fans?
What is a covered call?
A covered call is a combination of buying or owning 100 shares of stock, and selling a call on that stock. Selling a call obligates the option seller to sell 100 shares of stock at the strike price of the option at any time the option buyer wants to exercise the option. Since the option seller owns 100 shares of stock, those shares cover the exercise risk of the call option- the call seller has 100 shares that can be sold if the the call buyer wants to exercise the option. But the option seller collects a premium when selling which decays in value over time. At option expiration, the option expires worthless if the stock is under the strike price, or it will likely be “called away” by the option buyer if the stock is greater than the strike price. Many traders sell calls against their stock positions to collect premium as extra income.
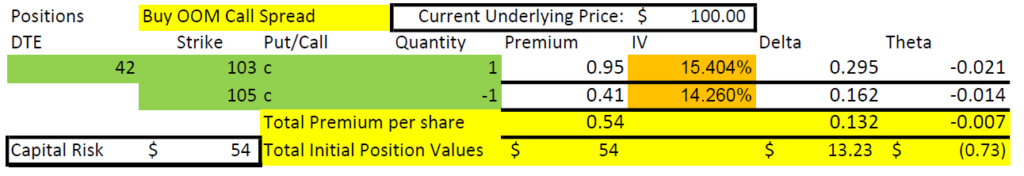
Let’s look at a typical set up of a covered call:
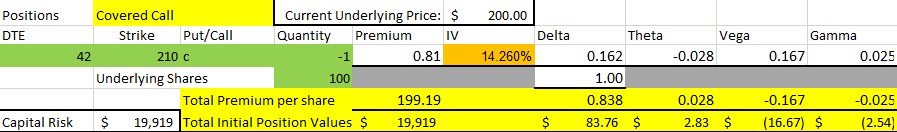
Here we are buying 100 shares of stock at $200 per share and selling a call with a strike price of $210 with 42 days to expiration (DTE). We collect a premium of $0.81, or a total of approximately $81 for the contract. So, our net cost per share to start is $199.19, instead of $200. This lowered “cost basis” is a benefit of selling a covered call- we’ll work to continually lower this further over time.
Throughout this article, we use this example position to demonstrate how rolling a covered call works. Each example transaction will be highlighted to differentiate it from the rest of the text.
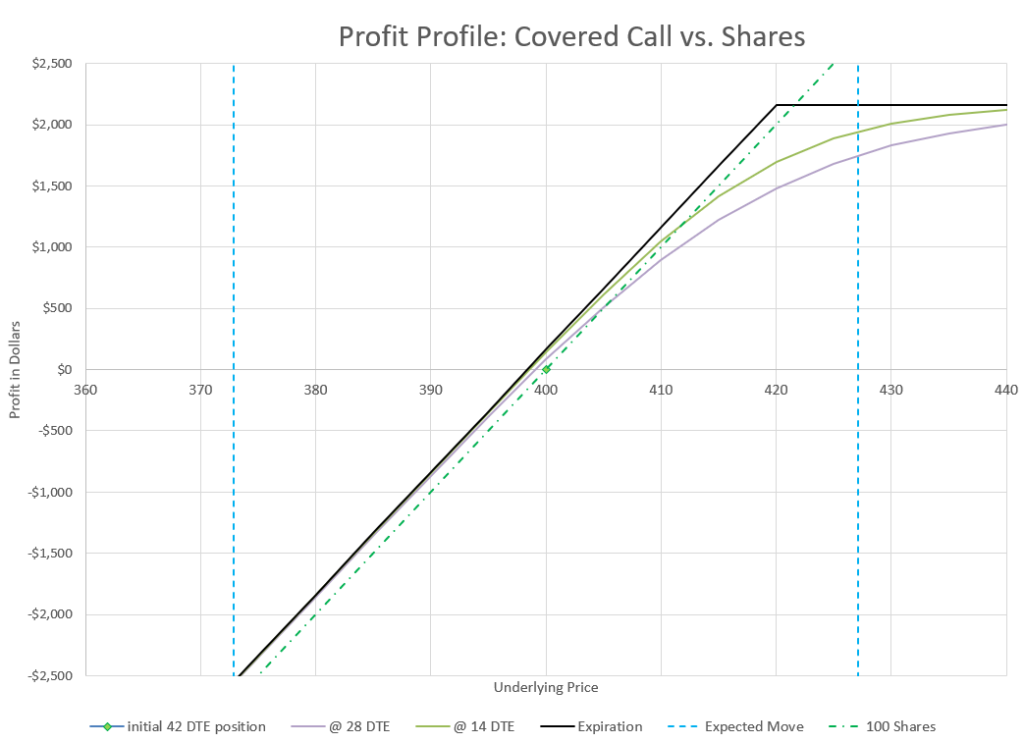
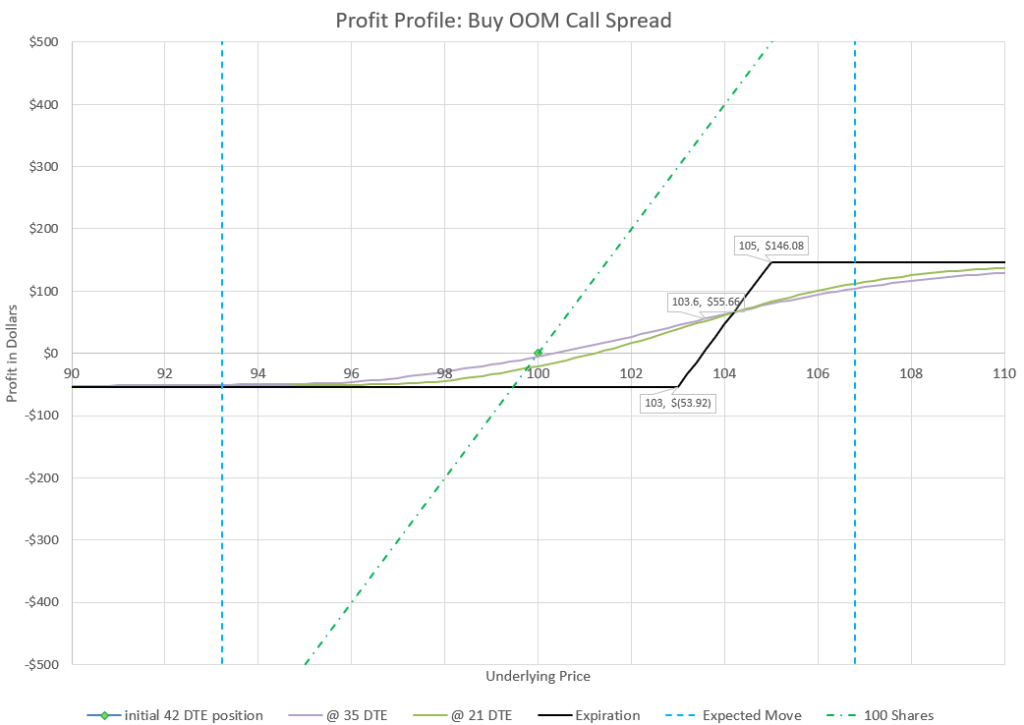
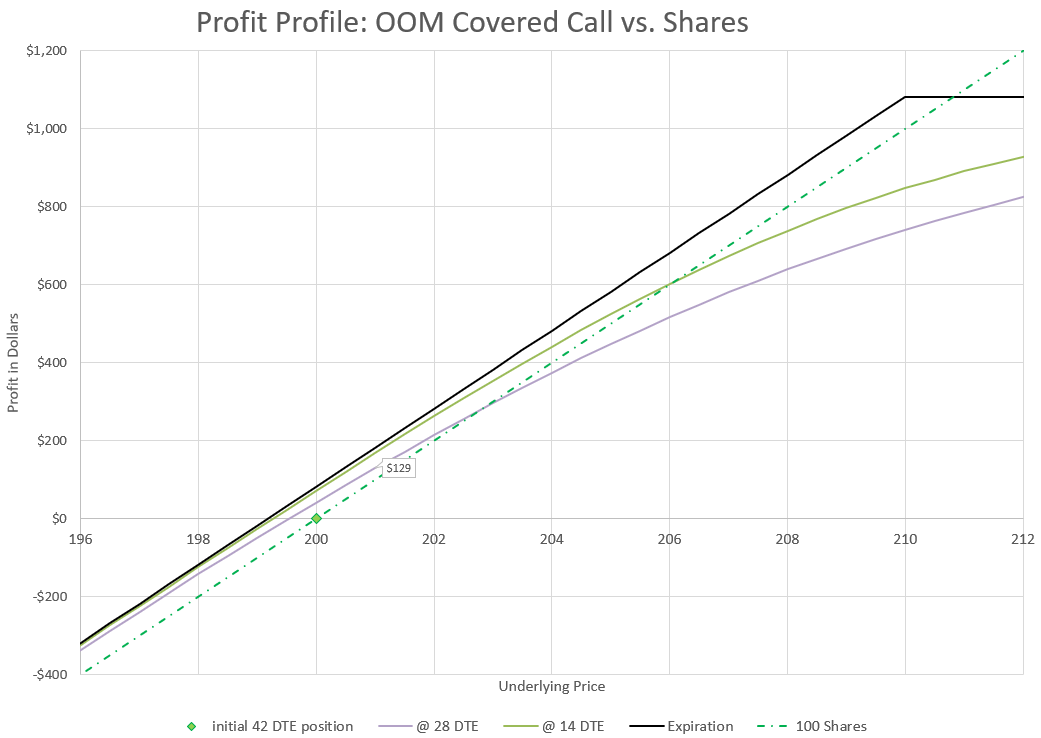
To see how this strategy works, let’s look at a chart of the profit profile of each component plotted separately:
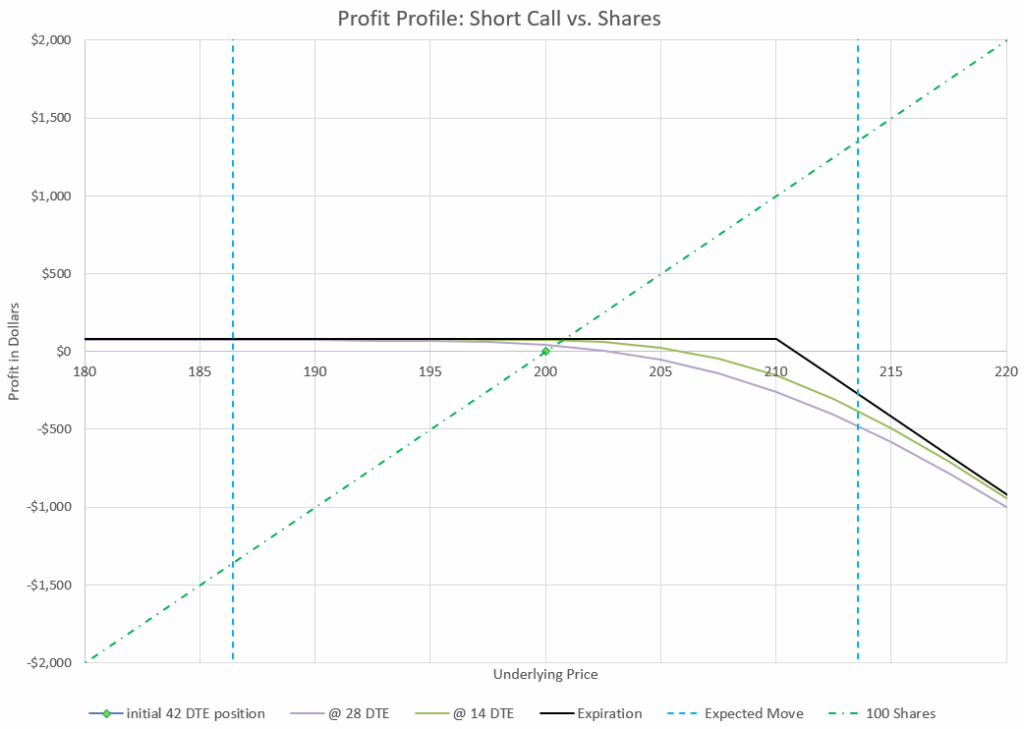
The call makes a small profit at any outcome up to the 210 strike price, and the stock goes up and down. Above the 210 strike price, the two elements of the covered call go in opposite directions, cancelling each other out at expiration. Now, let’s combine the two profit lines into one and see what the outcome looks like:
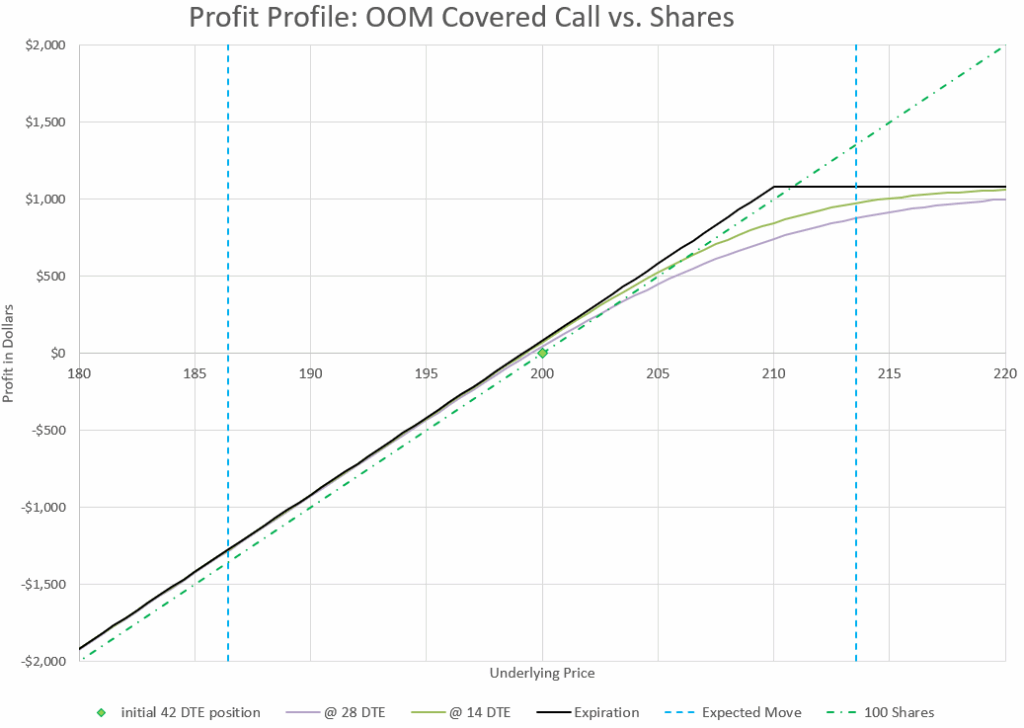
Through most of the expected move, the covered call profit is a little better than just owning stock alone. Recall that the expected move is what is implied by one standard deviation of the implied volatility of the option chain-see the article on expected moves for a refresher. Only as the price movement gets close to the upper range of the expected move will the covered call profit be less than stock alone. But even in that situation, the profit of the covered call is substantial. The covered call limits maximum profit in exchange for better outcomes at every other point in the profit curve below the strike price.
Ultimately, covered calls are bullish strategy- the long stock always has more positive Delta than the short call has negative Delta, so covered call owners make money when the stock price goes up.
There are several outcomes possible from selling a covered call. The only sure thing is that time is always on the side of the call seller, eating away at the extrinsic or time value of the call option. However, price movements in the underlying stock will move the total position up or down the same direction as the price movement. When price goes up, the stock obviously goes up, while the call option gets more negative premium. The option premium change counters the stock price change, but the stock move is always more than the option premium move. The same is true on down moves, the stock will always move down more than the option premium will help. In the end, the short call option dampens the response of the stock price movement either way. A covered call makes a stock holding less volatile- another benefit.
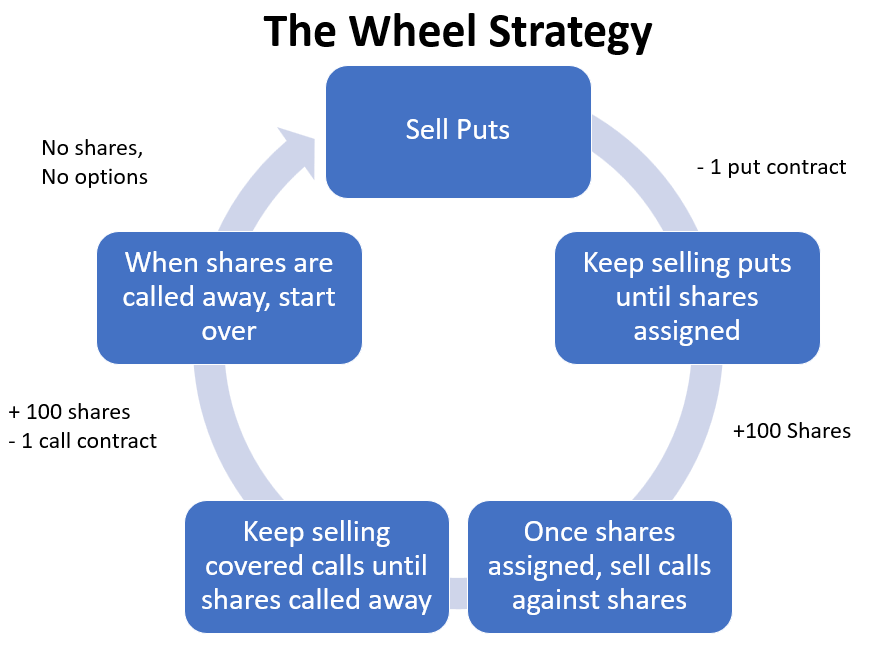
There are lots of ways to trade covered calls and to manage them. Some traders sell calls and then wait for them to expire or get exercised by the buyer. This is often true of “wheel” traders, who sell puts to get assigned shares, then sell calls against their shares until they the shares are called away, then they repeat the process, collecting option premium at each transaction.
Other covered call sellers aim to never let go of their shares and defend their positions so that the call buyer will never exercise the call option. This can be tricky, but the basic strategy is to make sure that the extrinsic value of the call is always more valuable than what the value of exercising the option is, so that exercising the option would be a money loser for the call owner. Generally, the three situations where a call buyer will exercise is when the option is in the money at or very near expiration, when a dividend is being paid, and when a stock option is too illiquid to sell and the only way to close the position is to exercise the call option. So, if a covered call seller can avoid being in those situations, they won’t lose their stock.
What does rolling an option mean?
Many new option traders are under the misunderstanding that they have to hold onto a position until expiration. If fact, generally a trader has three choices- hold, fold, or roll, which I’ve written about elsewhere. But let’s talk about rolling.
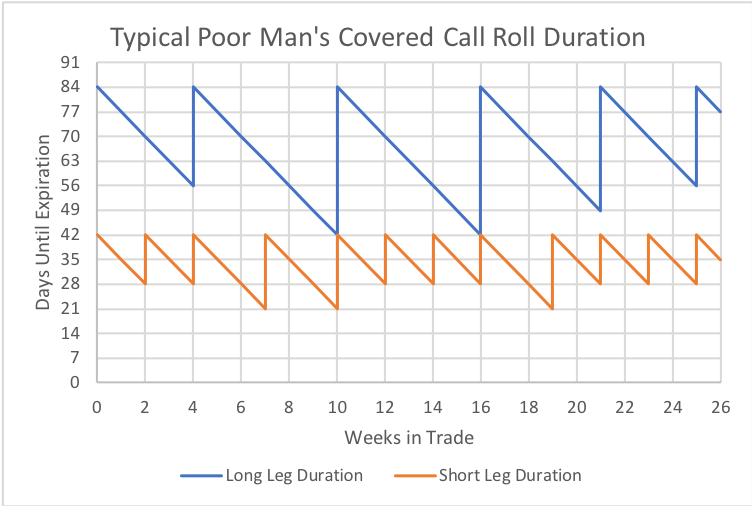
Rolling an option is when a trader closes one option and opens another option, usually in a single trade. A trader generally rolls up, down, out, or a combination. Rolling up means that the new option is a higher strike price than the old. Rolling down means that the new option is a lower strike price than the old. And rolling out means that the new option has a longer duration than the old.
As a continuation of our example, let’s say you have sold a $210 strike call on a stock and it is now set to expire in 28 days. You decide to roll out to 42 days. To do this you buy back the 28 DTE call and sell a 42 DTE call. If you sell a $210 strike call at 42 DTE, you have rolled out. If you sell a $211 strike call, you have rolled out and up.
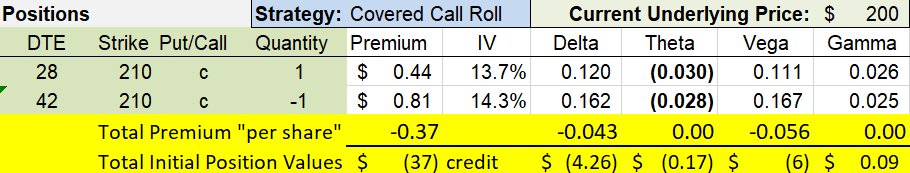
In this example, we are again collecting 0.81 premium on our new call, and since the old call has decayed to 0.44 premium, we have made a profit of $37 in the 14 days we held this covered call position, even though the stock price hasn’t changed. As it happens, we also have collected a net $37 credit for our roll.
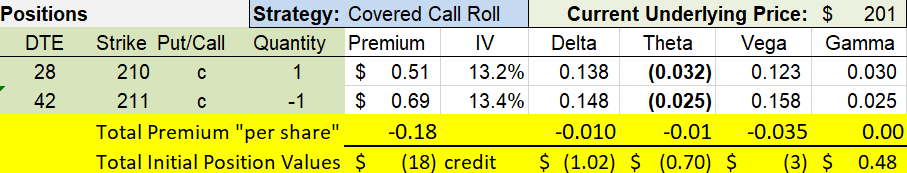
In this next example, the stock is up from $200 to $201, so we decide to roll up to a 211 strike, which still allows us to collect an $18 credit. Since the stock went up $1 a share, we’ve made $100 on the stock and our call made $30, by decaying from 0.81 to 0.51. In total, we made $130 on the move, compared to only $100 if we had only had the 100 shares.
Some brokers may label these trades differently, perhaps considering rolling up or down as a vertical spread trade, since you are buying and selling an option in the same expiration. If you roll out, some brokers may label this trade as a calendar trade, since you are buying and selling the same strike at different expirations. And if you roll both out and either up or down, your broker may label the trade as a diagonal spread, since you are buying and selling options at both different strikes and different expirations. The true difference between these labels and a roll is that with a roll, one side of the trade is closing a position, while the other is opening a position. When rolling a covered call, you are buying to close the old position, and selling to open the new position.
Notice that when we roll, we are only transacting our call position. The stock stays untouched. The stock’s roll in this trade is to “cover” the short call, so that risk is managed, by limiting it to the cost of the stock.
Why Roll a Covered Call?
There are three good reasons that I think most people use for rolling a covered call. First, they don’t want to have their call option exercised, so they roll out for more time and more premium to make exercising the option by the buyer less attactive. Second, a covered call seller may roll because the premium has decayed and they want to have more premium to decay and the seller doesn’t want to wait for expiration. Third, a covered call may be in the money and a covered call seller may want more attractive strikes. All of these are valid reasons to roll a covered call. Ultimately, all of these reasons boil down to an overarching reason- to keep collecting call option premium.
For most covered call sellers, the goal is to collect additional income from selling calls, and to keep the income coming, one has to keep selling over and over, so rolling is a common way to do it. The only alternatives are to hold to expiration, or let the shares be called away. I prefer rolling to avoid surprises as expiration approaches and to avoid options being exercised against me as much as possible.
Easy Rolls vs Hard Rolls
If the price of the stock that you sold covered calls against never really moved, you could just roll out to the same strike time after time. Sometimes, this is the case, and decisions are easy. If stock prices stay in a range, regular rolls can collect additional premium without adjust strikes up or down. For me, I’m generally happy just rolling my strikes out when the Delta of my call is anywhere from 10 to 40. There’s plenty of premium to collect and I’m not in danger of having the call exercised.
The earlier rolls shown are examples of easy rolls- the price either stayed the same or went up a small amount where we could roll and collect a credit to have a new position with similar Delta and similar premium to what we started with before time passed.
However, if my Delta value gets higher or lower, I have some decisions to make.
Let’s start with Delta values that are less than 10. When call Deltas are low, that means the stock is getting low compared to the call’s strike price, probably because the stock is going down in value. That probably isn’t good because the stock can lose a lot more than the call decay can make for a covered call seller. The worst scenario for a covered call seller is for the stock to go down significantly in price. All risk is to the downside, and even though the call sale premium makes up some of the loss, it can be a drop in the bucket. So, what can a covered call seller do when the underlying stock goes down in price. Let’s consider three choices.
- Roll down and out. By rolling to a lower strike at a later expiration, a covered call seller gains premium both ways, more time and more Delta. Just pick the Delta you want from the later expiration and collect a nice payment for the roll. Sounds like a no-brainer. But what if the strike price is lower of the new option is lower than what you paid for stock? The concern is that if the price reverses, the position could get stuck in the money with a value less than what you paid. Do you want to potentially “lock in” a loss? For example, if you bought shares for $100 and the price drops to $80, is rolling calls down to $90 strikes a good plan? Many traders have a rule to never sell a covered call at a strike price less than their basis cost for their shares. If you sell covered calls over and over, all that premium effectively reduces your total cost for the position, so maybe $90 is still more than your basis, if you’ve collected a total of over $10 in premium. Maybe it’s a good idea or maybe not, depends on what got you to this point.
- Roll out in time. Even if the price has dropped a lot, a covered call seller should be able to roll out at the same strike price for a credit, even if it isn’t much. As you roll out, the Delta value will also go up. In fact the further you roll out, the higher the premium and the higher the Delta value, but within limits- the position is out of the money. The question is whether the premium collected is enough to give up potential gains if the stock comes roaring back. If you roll out, how far out? I generally don’t like to roll out very far if I’m not collecting very much, but for some traders this is an ideal situation, collecting a little premium with very little risk of having the stock called away. It’s all a manner of perspective.
- Stop selling calls on the stock for a while. I sometimes do this when the market is way down and it seems oversold. During big corrections or bear markets, I will let my calls either expire, or I may buy them back to close them when they have little value. In this case, I’m willing to wait a bit for the stock to make a comeback. If I’m not willing to wait, maybe I should close the out the stock position as well and put the money into something else. Sometimes, it is just time to cut losses and get out. But assuming that I want to keep the stock and I think it is just temporarily underpriced, I may choose to just hold the stock and not sell calls until the stock price is at a better value.
Which is the right choice? That’s up to each trader to decide. It also may depend on your view of the stock and the current market, as well as the stock’s cost basis. There are several factors to weigh, so there is no single answer for all situations.
To keep going with our earlier example, let’s say our stock declined from 201 to 195, so we decide to roll down and out.
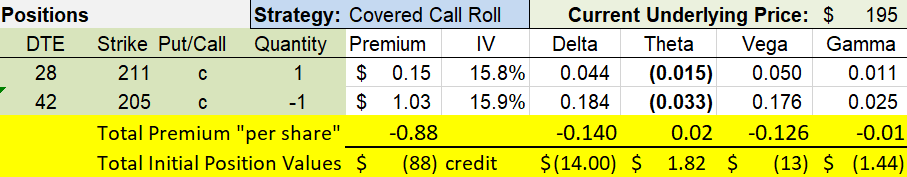
We collect more net credit for this roll than earlier ones, because our old call strike is farther out of the money and IV has increased a bit. Our new Delta is quite a bit higher than where our old Delta has dropped to. We also make more on the call’s decrease in value from 0.69 to 0.15, a profit of $54. But, since our stock went down $6 a share, the stock lost $600. Our net change for the covered call is a loss of $546, so we lost less than if we held stock alone. So far, every example we’ve seen shows the call making our results better than if we had stock alone.
On the opposite side of the value scale, what does a trader do when the Delta value of the call gets high, or even gets in the money? This situation used to really frustrate me, because the covered calls probably have lost money when looking at the call alone. But, if you look at the underlying stock and the call, the total position is making money, even if the call ends up in the money. So, this is a better situation than when stock prices are falling and the short call is gaining. In fact, let’s instead think of this as a good problem to have. This time, let’s consider four ways to deal with this situation.
- Roll out and up for credit. If the stock has gone up, let’s try to move our strike price of our call up as well. The problem is that it can be hard to collect a net credit because higher strike options are not as expensive as a lower strike. So, to collect a credit, we may need to go further out in time to find an option at a higher strike price that also has more premium than the current option that is being replaced. As calls get into the money, the deeper in the money they are, the harder it becomes to roll up for a credit. And the further out a call is rolled in time, the harder the next roll is to roll up and out for a credit. That doesn’t mean that you shouldn’t do it, it just means that it is more difficult.
- Roll up and out for a debit. If a trader doesn’t want covered call strikes in the money and a position is in the money or close to it, the position can be rolled up to a higher strike, but it may cost more to buy the old option than the new option sells for, so the trader has to pay for the move. This is the opposite of collecting income from the stock, but remember that the stock has gone up a lot to get the call option into this situation, so in the big picture, the position is still winning. Perhaps the covered call seller just wants to make sure the stock won’t be called away, so rolling up is more important than collecting a credit.
- Roll out at the same strike. You can almost always collect a net credit by rolling a call out in time at the same strike price, whether the strike is in the money or not. This can be a good choice when none of the other choices seem appealing, and you just want to “kick the can down the road” as people sometimes say. The beauty is that you get paid to just wait a little longer. Sometimes, the additional premium of a later expiration is enough to make exercise un-economic for the option buyer on the other side.
- Let the stock get called away. Maybe the call you’ve sold is way in the money and you just don’t want to mess with it any more. If you let the option approach expiration, chances increase that an option buyer will exercise the option and your shares will be sold at the strike price of your option. Or you could sell your shares and buy the option yourself if you don’t want to wait for the option market to take out your position. In any case, the price you get is essentially determined- the strike price of the option is what you will get for your position. The advantage of the market exercising the option is that you don’t have to pay for your option to close it, so any extrinsic value plus commissions to close are saved. The reason to do this may be that you have decided that it is time to use your capital for something else. Maybe you’ve been holding onto the position to wait for it to be a long term capital gain and once it is there, it is a good time to cash out and do something else. If you are selling at a price more than you paid, it is a win regardless of how you got there.
So, what is the best choice? It depends on lots of things, but my preference is to find a way to roll up and out for credit as often as possible and roll out if there isn’t a good choice for rolling up. I generally avoid rolling up for a debit, but for some that may be a good choice. And when I’m ready to move on, I’ll let the market call my shares away. So there’s a time for each choice, and every trader needs to be aware of the various choices available to make the right decision for each situation they may be in.
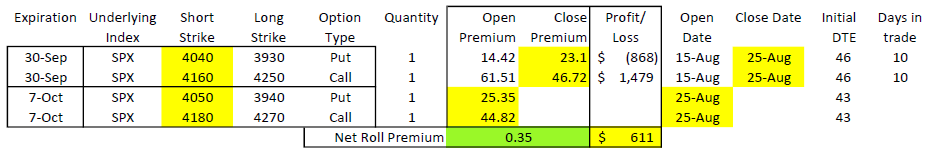
Continuing with our example, let’s say our stock has moved from $195 to $205 in 14 days. That means our stock is equal to the strike price of our call option. We may decide to again roll to 42 DTE, but keep our same strike price.
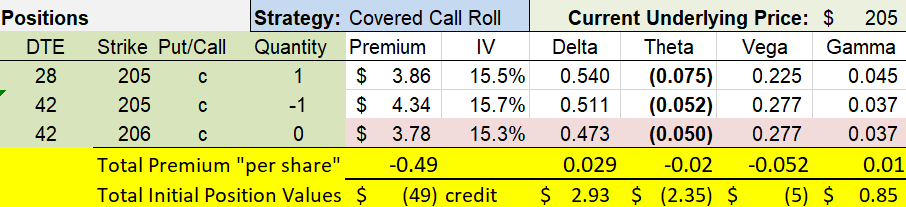
In the table above, I’m showing the choice I made, along with another possible choice that I decided not to make. I could have rolled up to the 206 strike, but it would have been a debit with the 206 strike having less premium than the older 205 strike. I could have rolled out further in time to get a credit to roll up as well, but here I chose not to.
If you recall, we opened this 205 strike position at 1.03 premium when the stock was $195, so we’ve lost $281 on the call. But since the stock is up $10 a share, it has gained $1000 in value, so our net profit on the trade is $719. We could have made more this time, with stock alone, but we are still making almost as much on a fairly large up move in the stock.
Are Deep In-the-Money Covered Calls Bad?
I used to feel like I had lost when I had a stock that I sold covered calls on blow past my strikes. I was obsessed with the fact that I would have been in a better position if I had just left the stock alone and let it go up in value. To some extent, this can be very frustrating. For example, if I bought a stock for $100 and sold $125 calls against the shares, and the stock goes up to $300, I’ve missed out on a lot of gains. But, on the flip side, I’ve made the difference between the purchase price and the strike price, plus I’ve collected premium from each call sale. WE don’t have to have extreme situations to find positive ways to manage our in the money option with a roll.
Continuing our example, let’s say that our stock price jumps up to $215 from our previous $205 price, and now our 205 call strike is getting deeper in the money. Now, we decide to add time to try to roll up just a little.
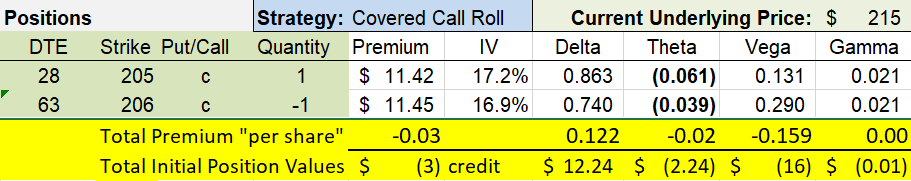
As we get deeper into the money, it gets harder to collect a credit when rolling up, so we may need to roll a lot further out in time. In this example, I went out to 63 DTE instead of the 42 DTE I’d used in all the previous example rolls. But I gained $1 on the strike and still received a credit.
On this transaction, we started by selling a 205 call for 4.34, and we had to buy it back for 11.42, so a loss of $708. Meanwhile, our stock went up another $10 per share for a $1000 profit. Our net profit on the covered call position was $292. And don’t forget that in this latest roll for a credit, we sold a call for 11.45 that is $9 in the money, so we have $2.45 extrinsic value going forward.
For situations that aren’t so extreme, I often like to think about multiple streams of income and side benefits from having and rolling a covered call that is significantly in the money. Let’s start with income and then talk about benefits.
Income stream 1: Call premium. Even when we roll a call deep in the money, there is still some premium to collect. There is more extrinsic value for more time. Each roll may be a small percentage, but it will likely be more than the going interest rate, usually substantially more.
With every example we’ve looked at, we’ve collected a credit, selling our new option for more than we paid to close our old option out for.
Income stream 2: Lock in strike increase profits. Every time a trader can roll up a call option that is in the money, they are locking in that much more profit. For example, if you own a $200 stock with a $150 strike covered call, if you can roll up the call to $155, you’ll lock in $5 more profit on the underlying stock if/when you sell the position. Since we are talking about 100 shares, that’s $500 more value. I look for opportunities to roll up my strikes, even if that means going far out in time to collect a net credit. Sometimes, I’ll just set a good to cancel limit order to roll up to the next strike in the next expiration at an even trade- my goal is to just ratchet up my strike price and eventual sales price of my stock.
In our last example, this was exactly what we did. We moved our strike price up $1, so if we decide to close this trade, our option has $100 less intrinsic value and the stock would sell in an exercise for $100 more than with the lower strike.
Income stream 3: Dividends. If the stock or ETF you own pays dividends, this can be a huge benefit of the covered call position and a significant source of income. Additionally, keeping the shares over a long haul can make the dividends be considered qualified dividends from a tax standpoint as mentioned earlier, so keeping the shares can be doubly important for tax reasons.
But with dividends comes additional exercise risk. The bigger the dividend, the greater the extrinsic value of the option you need to have to avoid having the shares called away when a dividend is being paid. This may be a driving force for paying a debit to roll up strikes to an option with more extrinsic value.
Dividends on stocks with covered calls are kind of like double dipping for many traders. This is a primary income strategy for many option traders.
Back to our example. Remember that we had $2.45 extrinsic value? If our stock paid a $1 dividend after our last roll, do you think we would have had our stock called away? Probably not, because an option buyer is unlikely to pay $2.45 extra to collect a $1 dividend. Rolling out further in time gave us that benefit as well. We make $100 dividend just like a stock owner with no calls sold against the position.
Let’s switch to looking at the benefits we still have when a covered call is deep in the money.
Benefit 1: Downside protection. When you have a covered call where the call is deep in the money, a down move in the price of the stock will have little impact. As long as the stock price stays above your call price, the expiration value of your position doesn’t change. So, while you may have missed out on a big gain, you can take a big down move of the market without a big loss to your account.
I know several covered call sellers that intentionally sell calls in the money for this reason, to greatly reduce downside risk. They give up big upside gains to have lower returns but a big buffer from down moves.
Let’s say our stock drops from its high price of $215 to $210 as our call winds down towards 28 DTE. Our 206 strike call has gone down in value from $11.45 in premium to $6.54.
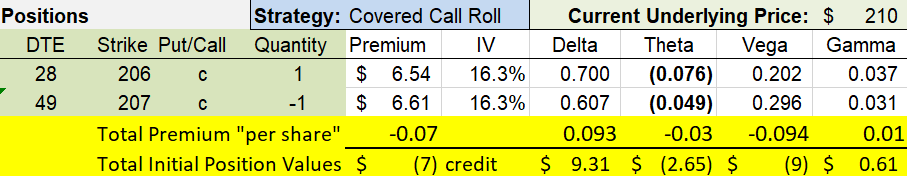
In this scenario, I chose to roll out an extra week so that I could also roll up another dollar in my strike price. But the big take away is what happened with my profit and loss of my position. My call made $4.91 while my stock dropped $5 per share, so my net loss was only $9, while owning stock alone would have been a $500 loss. The call almost completely bailed out my loss because it was fairly deep in the money.
Benefit 2: Lower overall volatility. Along with downside protection, a covered call position deep in the money doesn’t change much in value when the market goes up or down. It can be a portfolio stabilizer. The value of the stock and the intrinsic value of the option cancel each other out as the stock goes up and down in value. Only the extrinsic option value changes.
We can use Delta to see how this works. Let’s say we have a call with a Delta value of 80 sold against 100 shares of stock. Using our Delta math, we can see that the total position has a 100-80=20 Delta value, or represents only 20 shares worth of stock price movement when stock prices change. Said another way, for every dollar the underlying stock moves, our covered call position will only move 20 cents per share. For many traders, this is a very comforting position to be in.
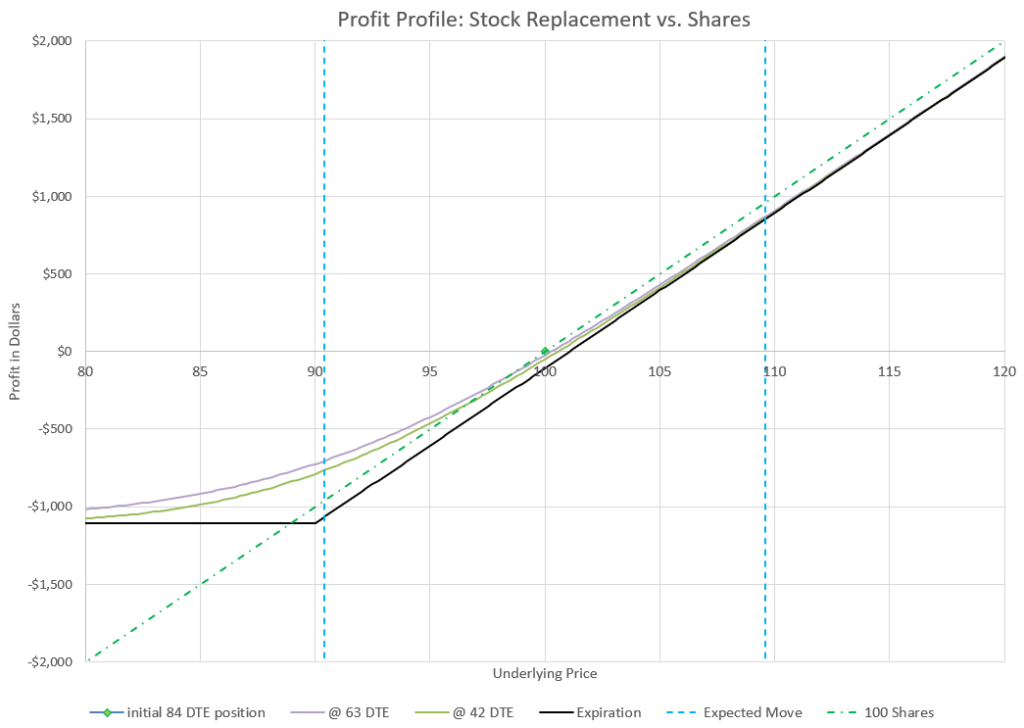
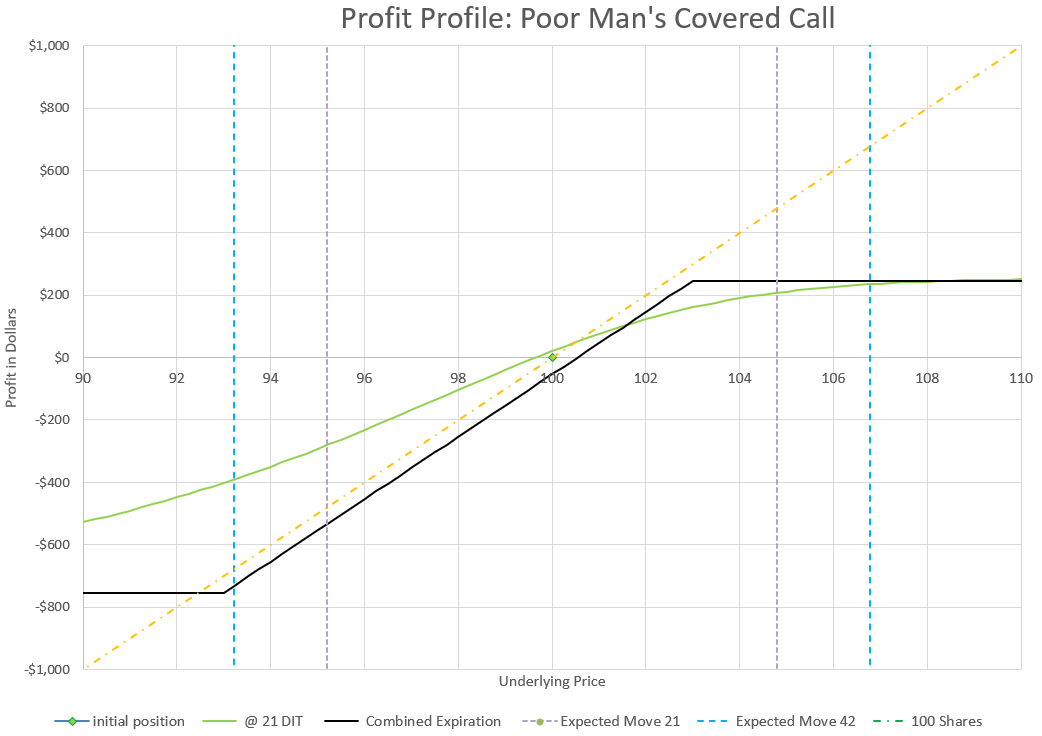
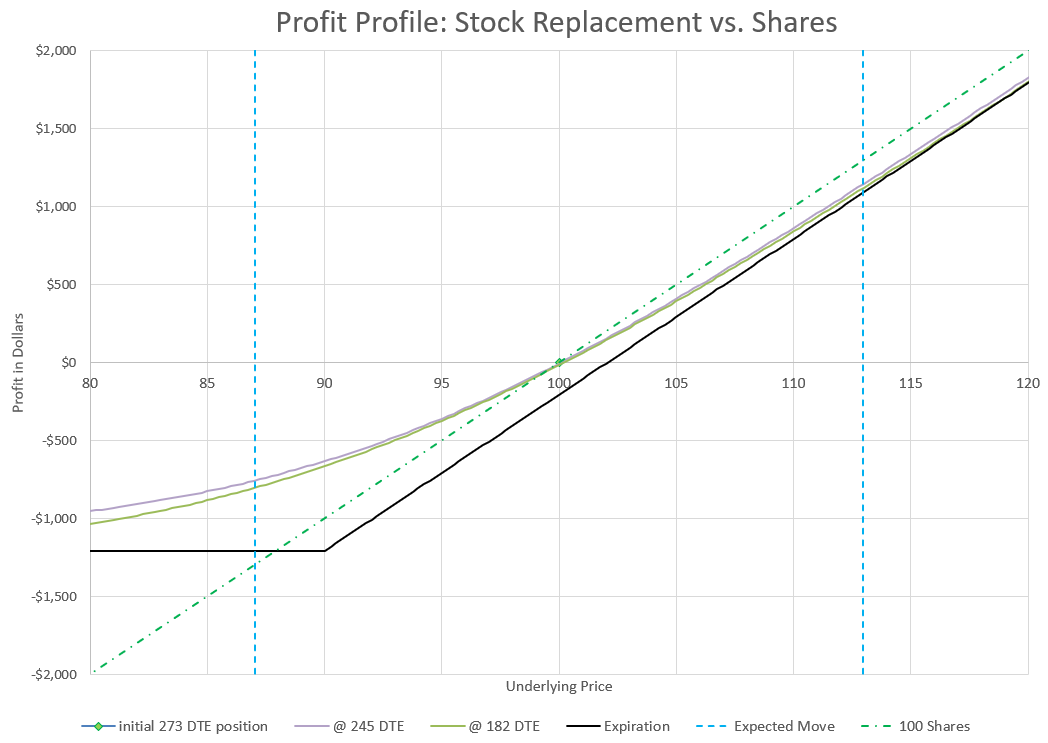
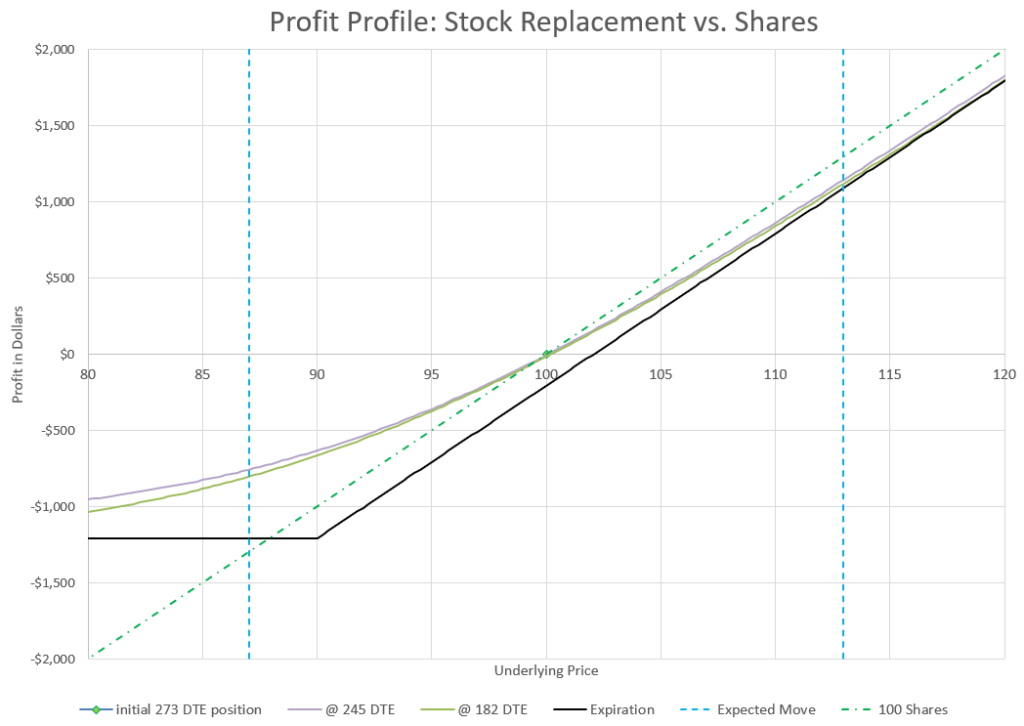
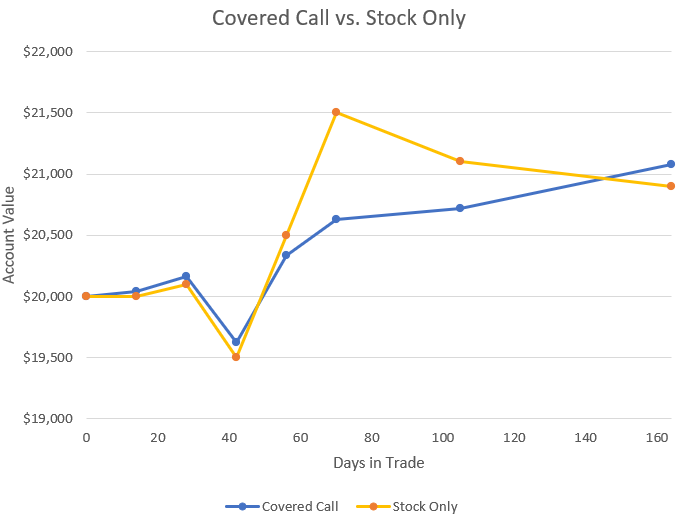
If we chart our positions from all of our example trades, assuming that they we one after another, we can see that the covered call position is much less volatile than a comparison version of 100 shares of stock.
Benefit 3: Tax considerations. If the stock is going up, and the stock owner holds over a year in a taxable account, the gains are long-term gains and taxed at a lower rate. Meanwhile if calls have been sold against the stock while the stock went up, the calls likely have lost money, but the losses are short term losses, which cancel out premium collected, and may be used to cancel out short term gains elsewhere in the account. So, as part of a process to minimize short-term taxable gains and maximize long-term gains, maintaining covered calls in the money can help give traders tools to manage when taxes come due and how much the bill will be.
If the underlying stock pays dividends, in the money calls may allow the stock owner to maintain long term holdings and collect qualified dividends, which may be taxed at a lower rate as well.
These potential benefits are in taxable accounts only. Consult with your tax accountant or do your own study for your particular situation. This isn’t intended to be tax advice.
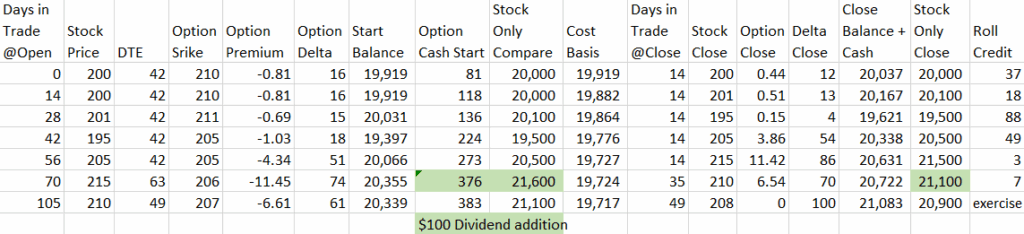
To finish our example, let’s say I decided to let the option expire in the money and have my stock called away. At expiration, the stock dropped from $210 down to $208. I kept my $661 of premium from the option sale, but had to sell the stock at $207, a dollar a share less than the current price. So, from my last roll until having my stock called away, I lost $300 on the stock from $210 to the $207 sales price, but made the $661 in option premium for a net profit of $361. Meanwhile, a stock only position lost $200.
Benefit 4: Basis cost reduction. Many covered call traders look at the premium collected as a reduction in the cost basis of the stock. Each extra chunk of premium means that the total net price paid for the combination of stock and call options goes down just a little.
I know traders that have traded covered calls on a stock position that their total cost basis has gone to zero and then negative. At that point, they feel like they are playing with “house money.” From a practical standpoint, getting enough premium to pay for the stock would likely take many years, so I consider it more of a mindset than a true goal.
Many covered call traders refuse to sell calls at strikes less than their cost basis, but if they have used call sales to reduce their position’s total cost, they are willing to consider the revised lower basis as a lower limit instead of what they paid for the actual stock.
If we at all the example trades together, we see that the covered call position cost basis ended up a $19,717, while we paid $20,000 for the stock. In addition to the stock, we have accumulated $383 in cash by the last trade, including the $100 dividend. Considering that the stock mostly went up, getting a cost basis reduction is a nice benefit. Here’s a log for reference:
If we take all these example trades together, we see that the covered call position ended up beating the stock only position, even though the stock went up 4% during the time of the trade.
Will selling covered calls against a stock always beat just holding stock alone? No, if a stock goes up significantly, the calls will be deep in the money, and the profit will be capped to a small trickle of option premium coming in from challenging rolls for credit. But even then, there are advantages to having sold a covered call and continually rolling. Just don’t beat yourself up over what might have been.
These example trades went through several changing scenarios- out of the money, in the money, up trends, down trends. In reality, a covered call position can stay in one of these scenarios for extended periods. It can be a pretty boring trade. But in options, boring is often a good thing. When an option gets deep in the money, rolls get more challenging as we’ve seen, but there is still money to be made, and premium to decay.
Worst case scenario
As an option trader, it is tempting to think of a short call option of a covered call position going deep into the money as a bad thing, even a worst case scenario. But, this isn’t that bad- the overall position is still making money because the stock is going up at least a dollar for every dollar the option loses. The real worst case scenario is when the stock drops significantly. When the stock portion of a covered call drops 10, 20, or maybe 50 percent, there is nothing that a short call can do to cushion the blow. The call can potentially save a few percentage points of the loss, but it can’t protect it all, or even come close. In the end, a covered call still has significant downside risk.
Is there anything we can do to get rid of downside risk using a covered call? While we can’t eliminate all the risk, there are a few ways to consider using covered calls to reduce big losses over time.
First, as we’ve discussed, selling covered calls reduces our cost basis with every roll we do for credit. The more credit we collect, the more of a downturn the position can sustain and still be profitable over the life of the trade.
Second, we can choose to sell our calls in the money to start with to protect a portion of the downside. I know traders that do this as a standard practice. Here’s an example from Brian Terry’s interview on ThetaProfits. In the money covered call sellers know that there will not be a large profit, as the in the money call caps the upside, but the call protects a significant move down, making the position very stable in value in all but the most extreme conditions. For example, if we sold a call with a strike price 10% in the money, we’d have 10% downside protection. As a practical consideration, we’d likely have to sell this call well out in time to have enough extrinsic value to have any time decay, but there is that possibility so we can still make money from premium decay.
Covered Call Conclusions
Rolling covered calls provide many opportunities for profits and additional benefits. Reduced volatility and additional income top the list. In virtually every market scenario there are ways to keep rolling and keep collecting net credits from option premium and get the benefits of time decay.
Beware of the trap of worrying about losing money on calls that go deep in the money, but be more concerned with the true risk of losing money from stock price declines. With the right mindset, rolling covered calls can be a great way to benefit your portfolio.