(Without losing a lot of Theta decay)
Option buyers typically have low probability of profit because of the need to overcome Theta decay, the measure of how much option premium loses value every day. But often selling calls in a bull market is a loser as markets don’t offer much premium and go up more than expected. And the market is bullish 70-80% of the time. Are there call trades that take advantage and balance risk and opportunity better than others?
Here are five call trades that I like:
- Sell a Covered Call (yes, it is actually bullish)
- Buy a Long-term Deep in the Money Call (the stock replacement trade)
- Buy in the money longer duration call and sell short duration out of the money call (Poor Man’s Covered Call)
- Ride the up trend with an Out of the Money Call Debit Spread– double up and reset
- Buy Call Back Ratio for Credit and Zero Extrinsic Back Ratio (ZEBRA) trades
Each of these trades is built for a different type of trade mentality, so it is a personal choice based on risk, time frame, and how active a trader wants to be in the market. However, with the exception of the covered call, all leverage capital and risk a total loss of premium paid but with big potential gains.
When is a good time to do these kinds of trade? Selling options is best when IV is high. Buying options is best when Implied Volatility (IV) is low and option premium is cheap. When IV is high, big moves are anticipated, but even if the market goes up, IV can contract quickly and significantly counter the gains from an up move. One overall measure to watch is the VIX volatility index. VIX has a long-term average level of 18, and when it gets in the low teens, between 12-14, it doesn’t have much lower it can go. Individual stocks can be checked for their IV level by looking at IV rank or IV percentile. When VIX is low and a stock has an IV percentile or rank below 10, I’d consider the stock IV as low. This scenario happens frequently, especially in bull markets, which occur much more of the time than bear markets. On the flip side as the market goes up and IV goes down, selling options get less lucrative and more risky.
Let’s take the five strategies one at a time. There are also detailed write-ups of each on separate pages, so this is an introduction to these trades and to contrast the risks and benefits of each before digging in deep.
Covered Call Trades
Of the five trades listed above, the Covered Call is the most conservative and the only trade that is based on a net sale of options. The trade is a combination of owning 100 shares of stock and selling a call against the shares. Because the amount of capital at risk is essentially the value of the shares of stock, which are owned in the account, this trade has no leverage from options- instead it reduces leverage and risk by adding a hedge against the shares owned.
Let’s say a trader sells a call with a Delta of 30 against their shares. The net Delta of the Covered Call position becomes 70. This means the two part position acts like 70 shares instead of 100, making the position less volatile. Since the only option involved is one that was sold, time decay always works for the call seller.
Many traders love Covered Calls because it allows them to collect premium as a source of income on shares they already own, without taking on any additional risk. For many conservative option traders, this is the one and only option trade ever needed. Depending on the underlying and tactics used, it is possible to make 5-15% income on stocks in a portfolio. Because the trade involves selling options, the probability of profit is greater than 50%, the highest probability of the five trades listed.
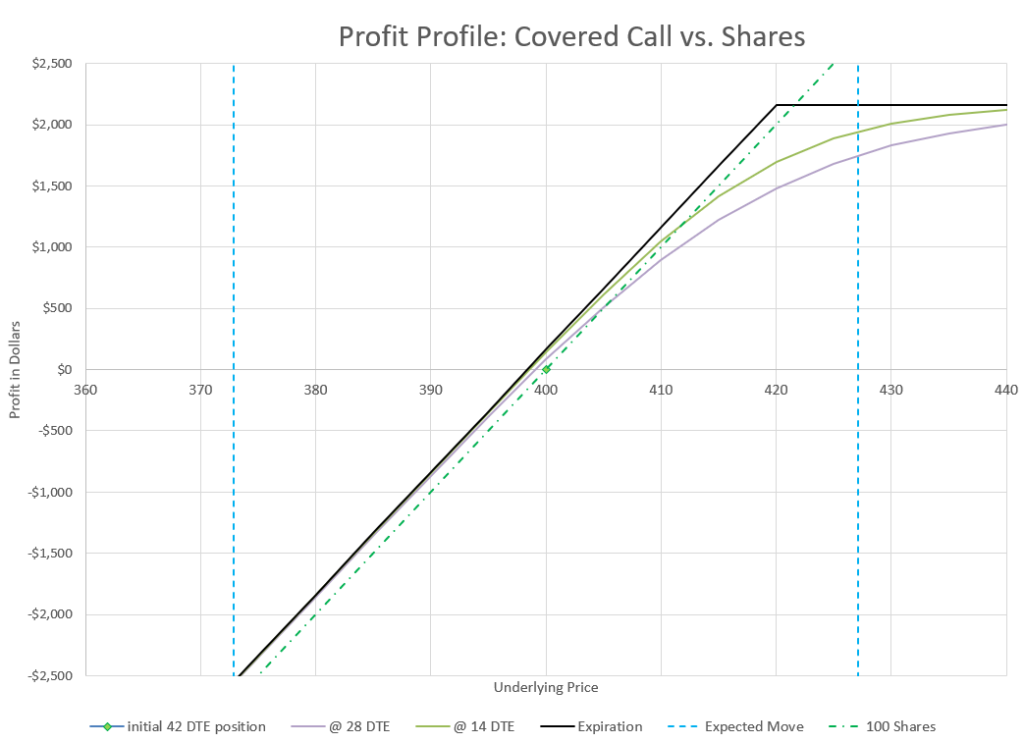
So, what’s not to like? It depends on your perspective, but the Covered Call limits upside gains, but does only a little to reduce downside risk. If a Covered Call owner has stock that goes up a huge amount, the call will limit how much profit can be made. The trade will be a profit, but without the call, the profit could be more. By selling a call, the Covered Call trader is collecting premium in exchange for the possibility of missing out on a big up move. On the downside, collecting premium might be a small consolation if the stock drops dramatically.
For a conservative trader, the Covered Call is a way to reduce risk compared to simply owning stock outright. For an aggressive trader, the Covered Call uses a lot of capital to get a return potentially the same as the market, with no real downside protection. I’ve come full circle as a trader myself, going from a big fan, to dis-illusioned by the lack of upside, to recognizing the benefit of a less-volatile, positive probability trade.
Stock Replacement Call Trades
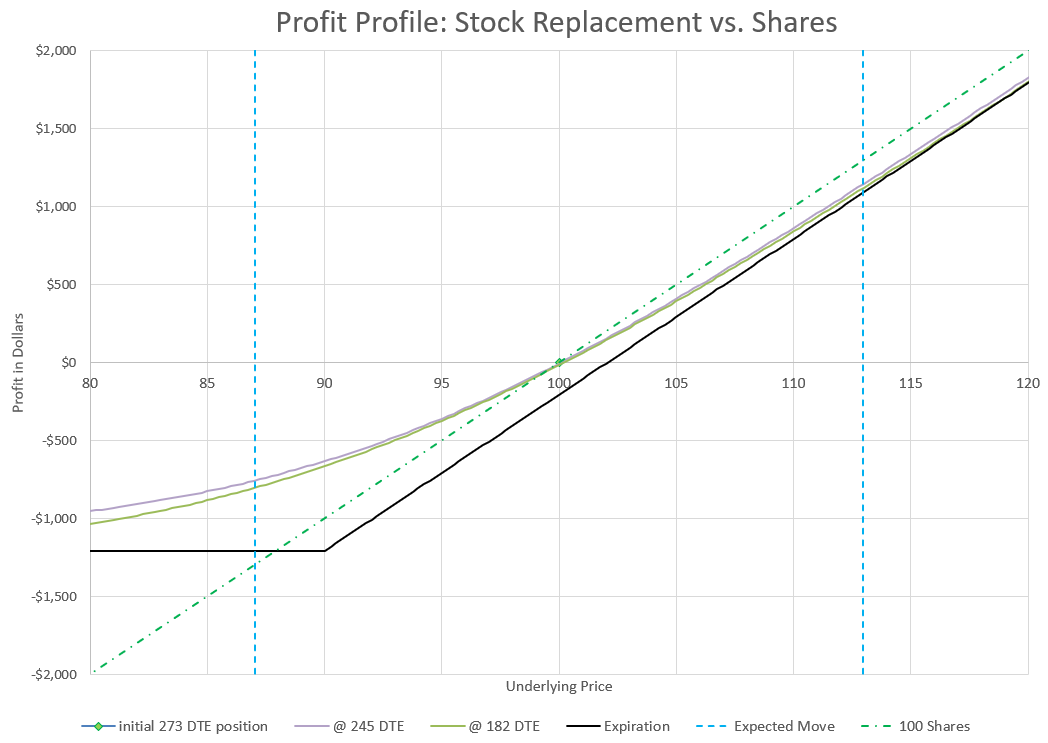
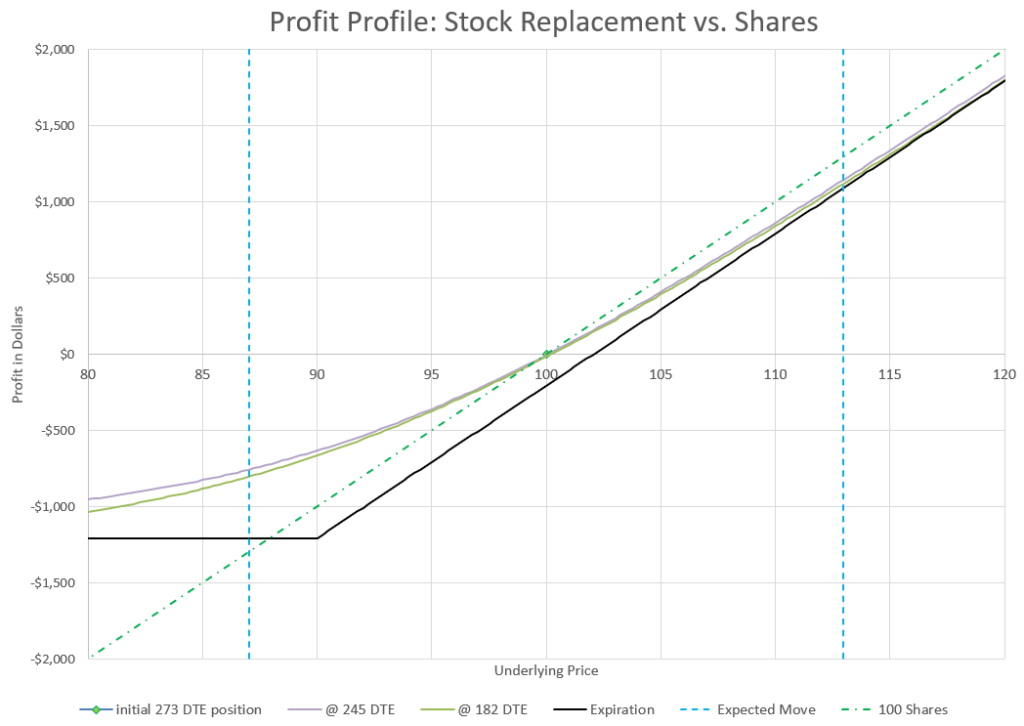
The next strategy is one that is often referred to as stock replacement. With this strategy, we can buy options that have the same upside as shares of stock but at a fraction of the cost. In theory any time someone buys a call, there is the same upside as stock, but some set-ups give a trader more of the upside benefit than others.
When I think of using options in place of stock, I’m looking for two things, relatively high probability and low Theta decay. When buying a option with no hedge, the natural way to lower time decay is to buy a call well out in time where it will decay slowly. To get it to move with the underlying stock, having an in-the-money option can get most of the move up (or down).
So for this strategy, I look for options 6-12 months out with a Delta value of 75-80. These options will likely cost 10-20% of the cost of the shares as they have significant intrinsic and extrinsic value. With over 6 months until expiration, time decay is slow, but still present.
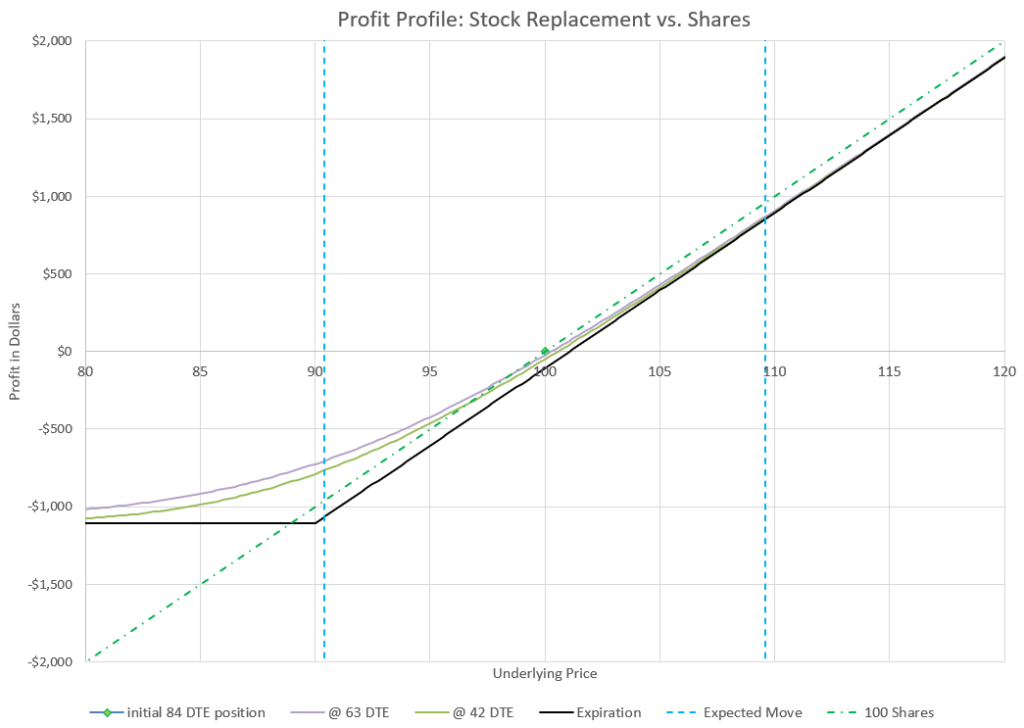
Because I’m buying an option with a Delta of 75-80, I have the equivalent of 75-80 shares of stock from a price movement stand-point. If the price goes up, over time the Delta will increase and the option will behave closer and closer to the movement of 100 shares of stock.
The risk to the downside is limited to the amount paid for the options, so a big market drop could wipe out the position, but even a big drop would still likely hold some value, but mostly the extrinsic time value. However, the really good news is that losses in the options on a downturn are less than the losses that would come from 100 shares of stock.
My goal in this trade is not to hold until expiration, but to either exit or roll to a longer duration before we get into the last quarter before expiration. If the stock price has gone up, I can roll to a new time at a higher strike price and collect the amount the stock has appreciated less the time decay that was lost.
This trade needs a small move up to break even, so the theoretical probability of profit is a little less than 50%. But, by getting out way before expiration, the odds get ever closer to 50/50, and in a bull market the unlimited upside with limited downside is a pretty compelling proposition.
One watchout with this trade (and the others as well) is thinking that since we use just one fifth or one tenth of the capital of buying stock that we can now buy five or ten times as many options and really cash in. We have to respect the downside risk. A big move down will wipe out this position. So we don’t want to put all our eggs in this basket.
But when the market is frothy and looking like it is going nowhere but up, this is a good way to participate in the upside while protecting the downside, assuming that there’s plenty of capital left to deploy if the market suddenly goes against the position.
Poor Man’s Covered Call Trades
Covered calls have a number of trading advantages- they reduce volatility, provide some income, somewhat cushion a position from a fall. But, to have a covered call, you have to own stock first to sell a call against it. However, we just discussed the idea of using long calls as a substitute for stock, so if we sell a call against our stock equivalent we can have a low cost equivalent of a covered call, in other words a Poor Man’s Covered Call.
One difference is that our long calls have decay, and we want to counter that decay by selling calls with the same or more decay in our favor. A great way is to create a diagonal spread, selling calls that are closer to expiration while buying calls that are further away.
By selling a call with faster decay against our long call with slower decay, we can actually get a trade that has a greater than 50% probability of profit. The trade-off is that we limit the upside. The trade has defined risk and defined maximum profit.
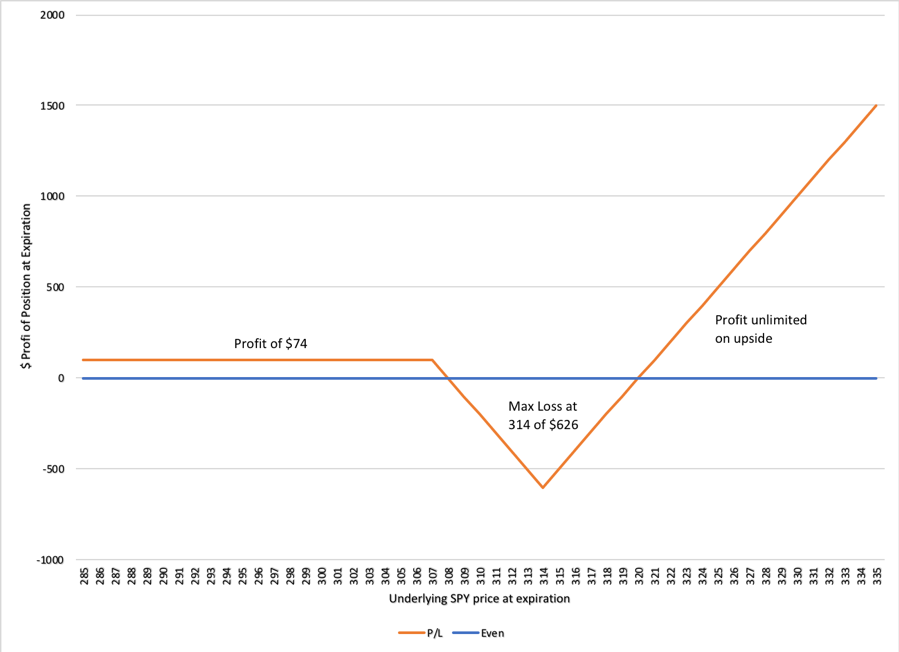
My typical setup is to buy a 75 Delta call about 12 weeks out and sell a 25 Delta call about 6 weeks out, or half the time. If we look at a chart of each of the options profit potential along with how they compare to just owning stock, we get a bit of a complex chart:
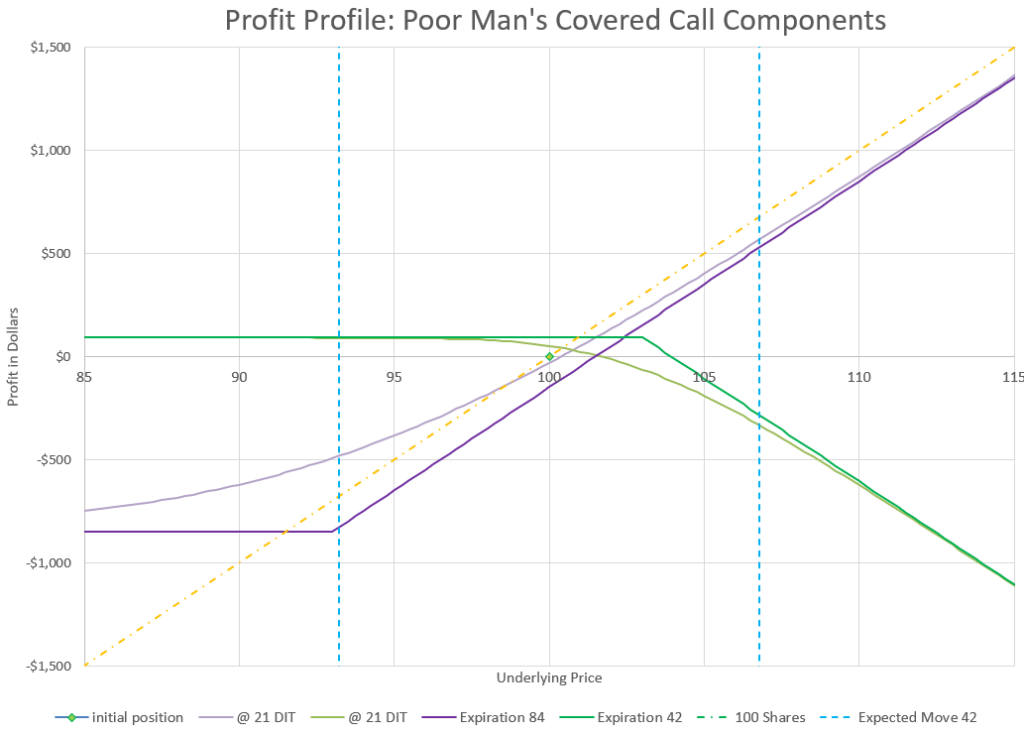
The key thing when looking at diagonal spread positions is that we really can’t think that much about expiration, especially for the long duration portion of the trade because it expires later. So, we really have to pay attention to how the projected values will behave at different points in time prior to expiration.
Another thing to notice is that the short call we sold has a strike price much closer to the current price than the long duration call. This means that there is more potential downside than upside, but that’s true with a regular covered call as well, actually even more so. At least our downside on this trade is limited.
When we put it all together in a chart, we can see how the trade profits not only when the market is up, but when the market is flat as well. Profitability with no underlying price change is due to the faster decay of the shorter duration short calls.
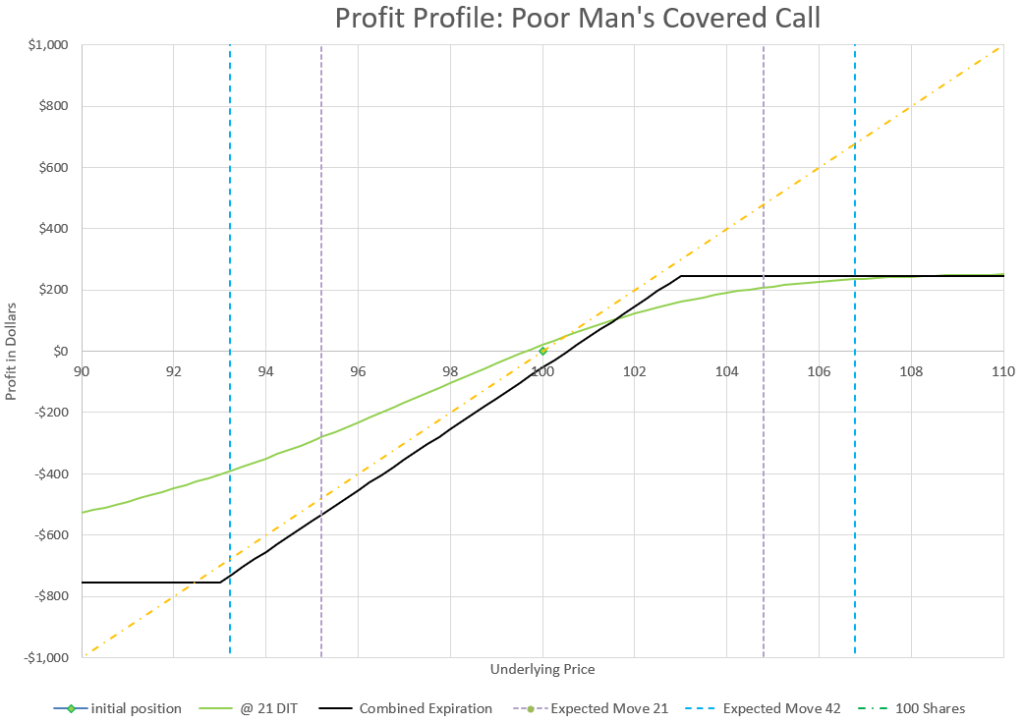
Looking at the overall Delta of this trade, it opens with a net Delta of 50, or the equivalent movement of 50 shares of stock. So this position is half as volatile as owning 100 shares of stock for a cost equivalent to about 7.5% of owning 100 shares.
From a profit standpoint, our capital required was $750 and the maximum profit is $250. This shows how much upside we’ve given up by selling the call, compared to unlimited upside with the call alone. However, if we look at a “sweet spot” on the profit chart above, we can see that if price goes up from 100 to 102 in 21 days, the profit is around $150, a 20% return on capital for a 2% move. In comparison, a 2% price move on the earlier long call option only would yield about a 7% return on capital, and owning stock outright would net the owner, well, obviously 2%. one way or the other, I can roll out at the same time I’m repositioning the short leg.
Is there any magic to 84 and 42 days? Not really, it’s just a time frame that I find fairly manageable without a lot of stress, but with plenty of premium to collect on the short side of the trade. Longer durations have less stress, and shorter durations are more volatile with more potential profit. It’s a choice that depends on your trading preferences and risk tolerance.
There’s a lot of ways to manage the Poor Man’s Covered Call, and I’ve written about them in an extended post.
Buying an Out of the Money Call Spread
Buying an out of the money call spread seems counter to every theoretical calculation a person can do. The probability of expiring in the money is low by definition and time decay is the enemy big time. But, over the years I noticed that when I sold call spreads that were supposed to be profitable, either alone or as part of an Iron Condor, those spreads seemed to lose money often, and often lost a lot. One thing I’ve learned in trading is that if a strategy you use continually loses, try doing the opposite. So, here we are. I’ve done a lot of back-testing and trading my own positions to come up with a low probability strategy that actually wins over time.
As I tested different variations of this strategy, it became clear that the key was to keep the amount of capital required low with lots of upside potential, but high enough that the position has a chance for success. Also, this is a trade that works best when the trade is closed for a win and not held to expiration. It also does best with low implied volatility in a bull market.
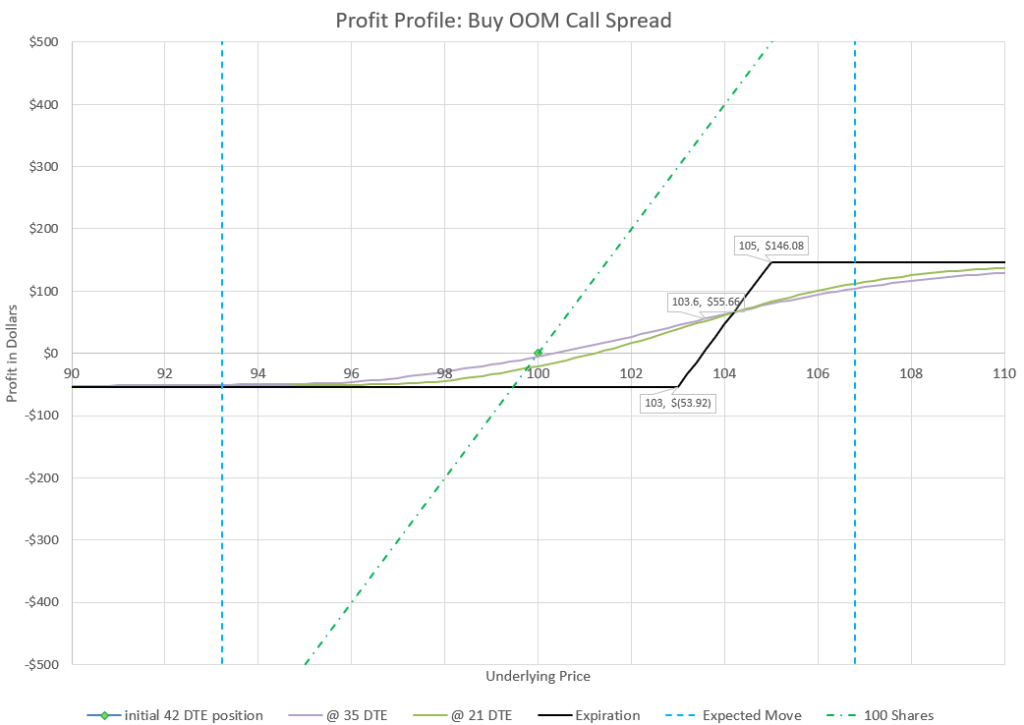
Buying a spread helps compared to buying a single out of the money call, because the sold call has similar Theta decay to the long call and counters the biggest reason for quick losses from buying calls.
With a little time and early management, this trade has a history of an actual positive average profit, even though the probability of profit from a single trade is well below 50%. Big wins can outpace a larger number of small losses. Read the detailed post about this strategy to find out the specifics to success with this trade that goes against virtually every concept I tend to advocate for.
The Call Back Ratio
In front ratio spreads, usually the goal is to sell more options than what is bought to have lots of decay protected a hedge of a long option. Front ratios are so much more common, that most people just call them ratio spreads and don’t even consider an opposite version, a back ratio.
A back ration spread involves buying more options than selling to take advantage of a big market move. With a call back ration, we may for example buy two calls and sell one call. If the market goes up, the two long calls will make more money than the short call will lose. The disadvantage is that Theta (time decay) can be a big problem. So, I have two variations of this trade that I use that somewhat counter this problem, but not completely.
A Delta neutral back ratio call spread is created by selling a call and buying two calls with exactly half the Delta of the call that was sold. The net Delta is zero, and the trade should net a credit- a trader is paid to enter the position. If both call strikes are out of the money, like when selling a 30 Delta call and buying two 15 Delta calls, it is very possible that the position will expire with everything out of the money and worthless, so the trader keeps the premium. If the market goes way up, the long calls will start to overcome the value of the short call with unlimited profit potential. Sounds great, doesn’t it? The downside is that the trade could end up with the short call in the money and the long calls out of the money worthless, so the trader is stuck with a loss quite a bit bigger than the credit received to start with.
An almost opposite variation flips the position of the long calls to make the trade a net debit and create the equivalent of 100 shares with zero extrinsic (time value). I picked up this concept on TastyLive.com. The Zero Extrinsic Back RAtio trade, or ZEBRA, buys two 75 Delta calls and sells one 50 Delta call for a net Delta of 100, or the equivalent of 100 shares of stock. The extrinsic value of these positions tend to cancel each other out, with twice as much time value in the short call as each of the long calls. So we get the movement of 100 shares of stock for a fraction of the cost and no extrinsic value for the position. In many ways this is a lot like the stock replacement discussed earlier.
The zero extrinsic value is a little deceptive in that the extrinsic value doesn’t decay equally. The extrinsic value of the two long calls decay faster than the extrinsic value of the short calls at the money. So, in the short term, Theta is negative, and we still need the market to move up to make money.
I discuss the ins and outs of both of these back ratio strategies in the extended post on this topic.
Conclusion
Beginning option traders like to buy calls to start their option trading, and over time often learn the advantage of selling options and probability. But there’s a reason that long trades involving calls exist- the market goes up more than it goes down. We need strategies that use call trades to benefit from market moves up without experiencing huge amounts of time decay, or huge swings in positions. These 5 strategies provide some choices to get in on a bull market with calls. Share your favorite bullish call trades in the comments.