if we sell a call against our stock equivalent we can have a low cost equivalent of a covered call, in other words a Poor Man’s Covered Call. One difference is that our long calls have decay, and we want to counter that decay by selling calls with the same or more decay in our favor. A great way is to create a diagonal spread, selling calls that are closer to expiration while buying calls that are further away.
Covered calls have a number of trading advantages- they reduce volatility, provide some income, somewhat cushion a position from a fall. But, to have a covered call, you have to own stock first to sell a call against it. However, we have discussed the idea of using long calls as a substitute for stock, so if we sell a call against our stock equivalent we can have a low cost equivalent of a covered call, in other words a Poor Man’s Covered Call.
One difference is that our long calls have decay, and we want to counter that decay by selling calls with the same or more decay in our favor. A great way is to create a diagonal spread, selling calls that are closer to expiration while buying calls that are further away.
By selling a call with faster decay against our long call with slower decay, we can actually get a trade that has a greater than 50% probability of profit. The trade-off is that we limit the upside. The trade has defined risk and defined maximum profit.
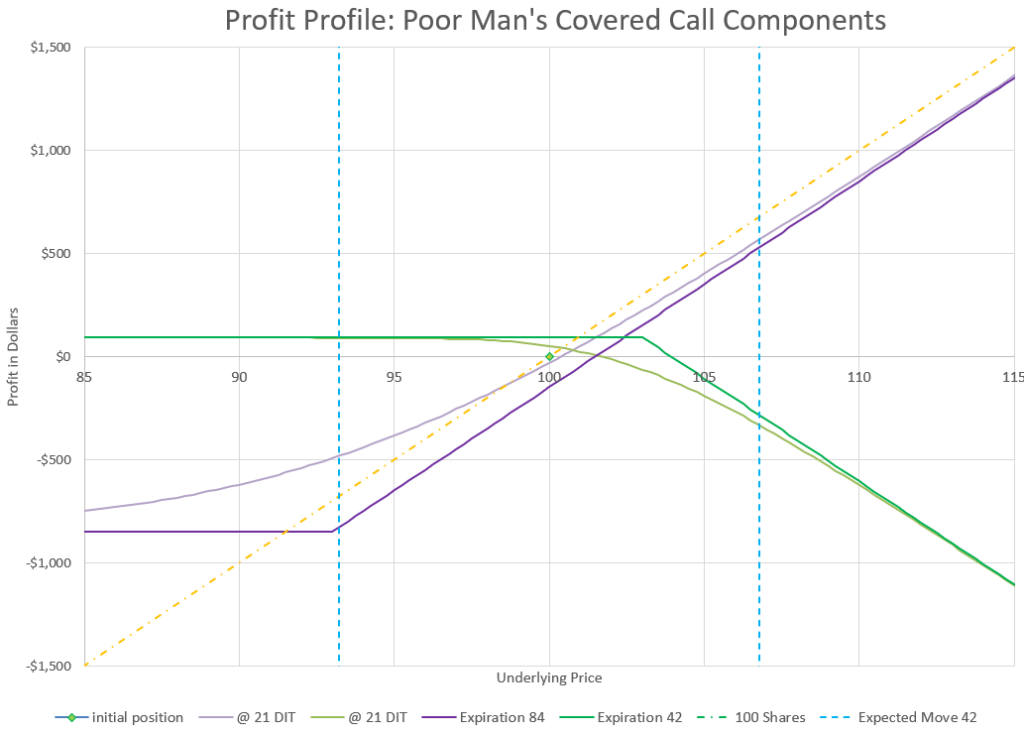
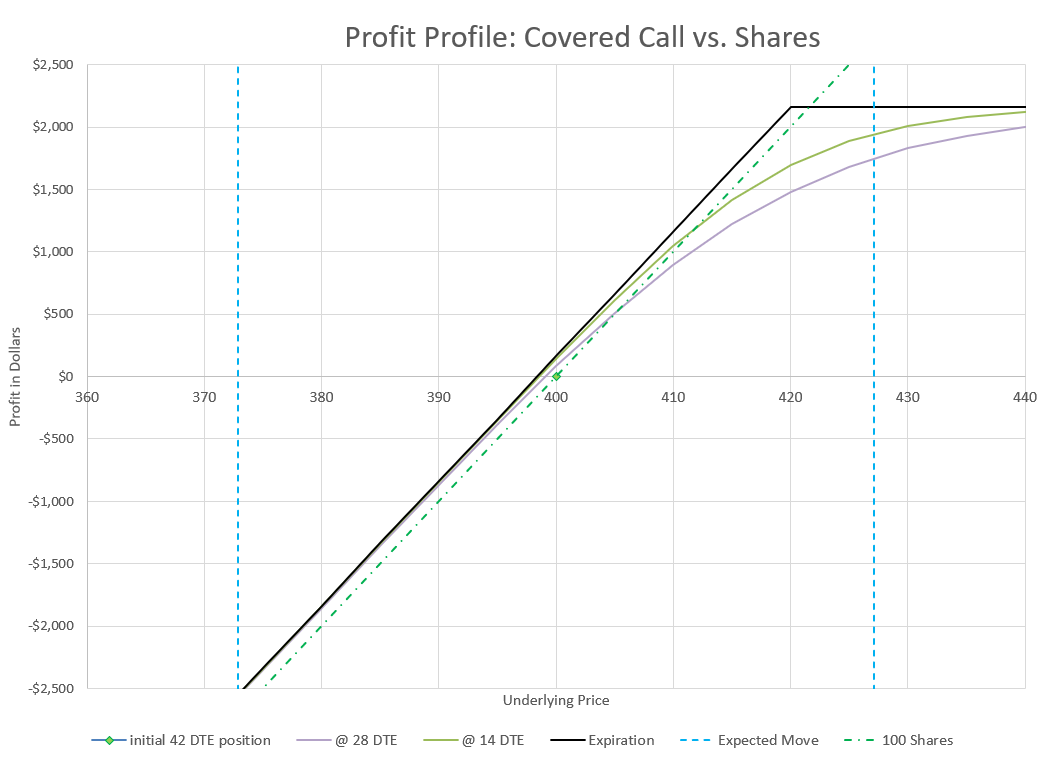
My typical setup is to buy a 75 Delta call about 12 weeks out and sell a 25 Delta call about 6 weeks out, or half the time. If we look at a chart of each of the options profit potential along with how they compare to just owning stock, we get a bit of a complex chart:
In this chart we have two options with their own profit profiles at expiration. But, since they don’t expire at the same time, it is more important to see how they will perform at a certain point in time, like half-way to expiration for the shorter duration short call. After 21 days, the short call profit profile hugs the expiration profit profile much closer than the longer duration long call.
The key thing when looking at diagonal spread positions is that we really can’t think that much about expiration, especially for the long duration portion of the trade because it expires later. So, we really have to pay attention to how the projected values will behave at different points in time prior to expiration.
Another thing to notice is that the short call we sold has a strike price much closer to the current price than the long duration call. This means that there is more potential downside than upside, but that’s true with a regular covered call as well, actually even more so. At least our downside on this trade is limited.
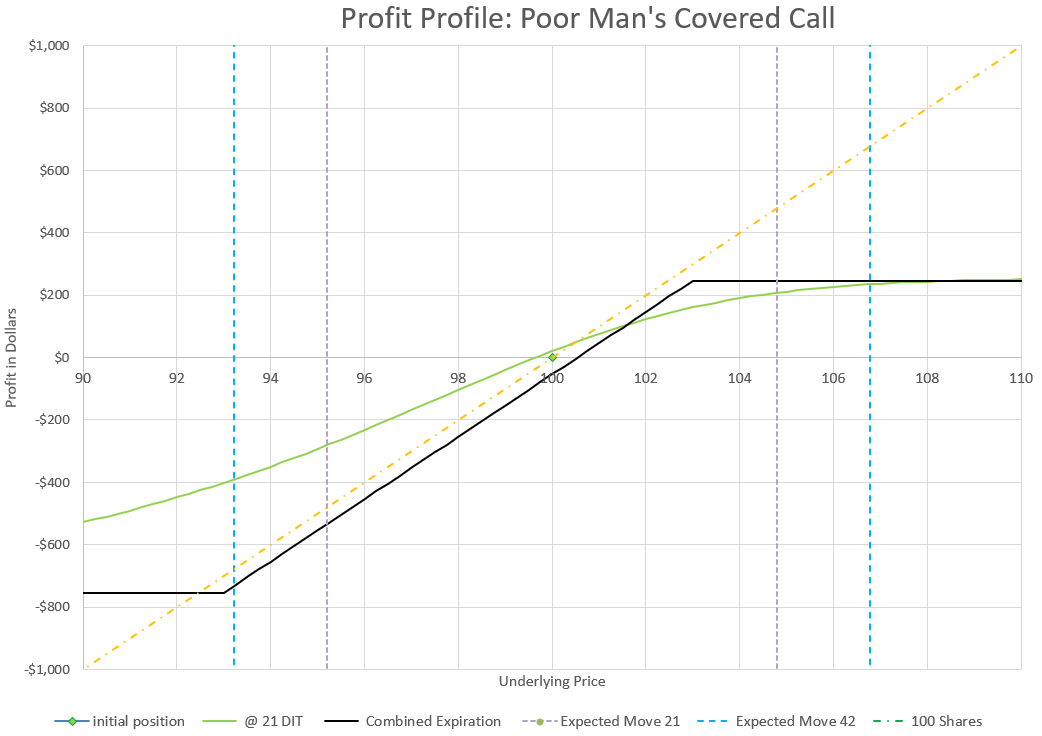
When we put it all together in a chart, we can see how the trade profits not only when the market is up, but when the market is flat as well. Profitability with no underlying price change is due to the faster decay of the shorter duration short calls.
Notice the 21 days in trade profit line is profitable even in a slight down move.
Looking at the overall Delta of this trade, it opens with a net Delta of 50, or the equivalent movement of 50 shares of stock. So this position is half as volatile as owning 100 shares of stock for a cost equivalent to about 7.5% of owning 100 shares.
From a profit standpoint, our capital required was $750 and the maximum profit is $250. This shows how much upside we’ve given up by selling the call, compared to unlimited upside with the call alone. However, if we look at a “sweet spot” on the profit chart above, we can see that if price goes up from 100 to 102 in 21 days, the profit is around $150, a 20% return on capital for a 2% move. In comparison, a 2% price move on the earlier long call option only would yield about a 7% return on capital, and owning stock outright would net the owner, well, obviously 2%.
Managing the Poor Man’s Covered Call
How do we manage a Poor Man’s Covered Call? Generally, there are three ways to manage positions like this: hold, fold, or roll. Let’s take them one by one.
Hold means we just hold until expiration. But, remember these options expire at different times, so we could hold until the short leg expires and close the long. We’ll get good Theta decay and not really need to pay much attention. Probability of profit is over 50%, so it’s a viable strategy. However, if we let both options expire independently, we can see from the expiration profit chart that we need an increase in price to be profitable, so we do need to get out of the long call before expiration, preferably when we exit the short call.
Folding or getting out with an early exit isn’t a bad choice either. We can set a profit target, say half the maximum profit and set a limit order and also have an equal stop loss or slightly larger stop loss, and let the trade play out. Probability is over 50%, so hopefully we catch a modest up move and miss any big down move, collect a nice profit, and move on. As a short term strategy, this can be a good approach, especially if we were to set up a ladder of ongoing versions of this every few weeks and just let each one play out individually.
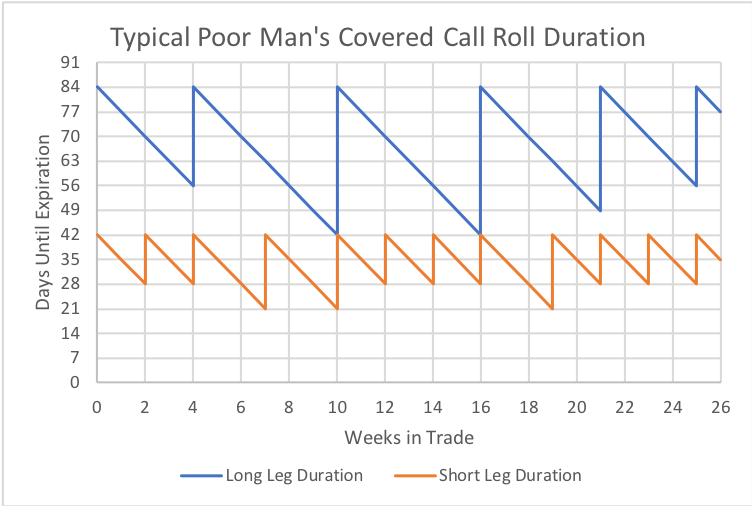
If you’ve read much of the other parts of this site, you know that I tend to favor rolling strategies, often continuous rolls. I like to roll positions out in time, over and over, adjusting them up or down with the market. Generally, the plan for this trade is to actively manage the short duration leg more than the long duration leg, but keep the long duration out in time and the short duration around half the time as the long, give or take a bit.
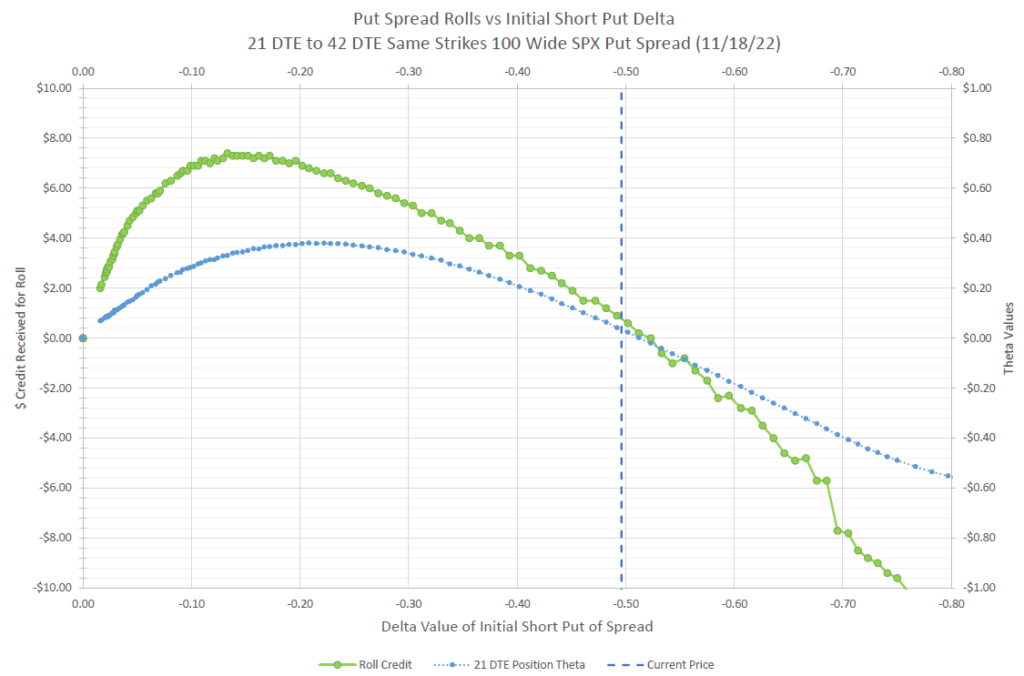
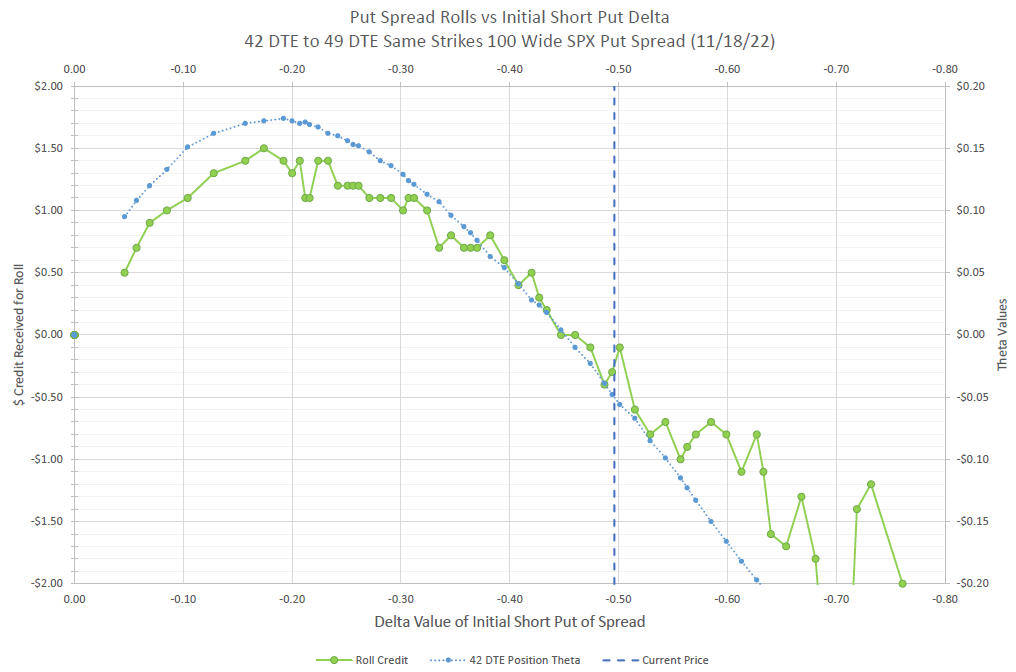
Here’s an example of rolling a position that starts with a short call at 42 days and a long call at 84 days. Typically, the short leg will get rolled more often, since it is decaying faster and is more prone to changes in Delta value and its premium.
In the chart above, I’m illustrating the concept. The idea is that every two to three weeks the short leg gets rolled out in time. Well, which one is it, you might ask, two or three? I would look at it based on criteria, if the short has gotten way out of the money, say below a 12 Delta in two weeks, I’d roll out and establish a new 42 day position and collect a net credit. Or, if the short strike is being tested and has moved to a Delta of 40 or more, I’d roll out and try to reduce Delta and collect a credit in the process- it’s easier to roll a single short leg for a credit than to roll a spread, so I should be able to improve my position in the process. If however, the price keeps Delta between 12 and 40, let’s just keep collecting Theta and wait until 21 days left to roll. At that point, we roll out to 42 days again and pick a nice strike and get a nice credit for our effort.
For the long call, I mostly just leave it alone. I let it do its thing until it gets down around 42 days and kick it back out to 84 days. If the market is up, I can move the strikes up to 75 Delta and get a credit. If the market is down, I’ll have to pay to roll out. If there is a really big move one way or the other, I can roll out at the same time I’m repositioning the short leg.
Managing Big Moves
So, we can set up rules to guide our rolls and generally just let the data from the market dictate our actions. The only other thing to consider is what to do if the price jumps way outside our strikes? With individual stocks, this is a clear possibility, so there needs to be a plan. On a huge jump up, the choices are to close for a max profit and move on figuring that all the good news is priced in, or reset with a roll to new strikes in anticipation of further up moves. On a huge down move, we can close out both sides for whatever premium is left on the long call if it looks like the bottom has fallen out for good, or just hang on to the long call and hope for a reversal, maybe selling a new call at the same price to cushion the blow. There’s no right answer, just the right answer for each trader’s personal tolerance for risk. But, every trader needs a plan. The one strategy that many traders take by default is to cash in small gains and hang on to big losers, which pretty much guarantees a losing portfolio over time.
Overall considerations
Is there any magic to 84 and 42 days? Not really, it’s just a time frame that I find fairly manageable without a lot of stress, but with plenty of premium to collect on the short side of the trade. Longer durations have less stress, and shorter durations are more volatile with more potential profit. It’s a choice that depends on your trading preferences and risk tolerance. Many traders of this strategy like to go to much longer durations with their long strike, to six months or even a year, to keep Theta less, but the trade-off is that the cost and downside risk is more.
Similarly, is there magic to 75 and 25 Delta? Not magic, but the goal is to have more decay in the short strike than the long, so equally distant Deltas at different expirations should achieve that. Many traders will buy call strikes deeper in the money to make this advantage greater, with the trade-off of a higher premium cost and having more more capital.
Between time to expiration and the Deltas chosen, we can significantly adjust Theta of our long strike. We can also greatly control the amount of capital required for the long call, from around 5% of the cost of stock to 20%. Understand that this is the trade-off, capital cost and downside risk vs. decay. The ultimate extreme is going back to a covered call, where we own stock instead of a call. Buying a call instead saves capital, and also limits the loss. So, in choosing the long side of the strategy, consider the choice of time and Delta as part of a continuum of risk and reward.
Trade Sizing: Leverage and Risk
Finally, remember that just because a poor man’s covered call has less capital required than a standard covered call, it doesn’t mean that it is a good idea to do 10 poor man’s covered call positions instead of a single covered call. Just because a trade is affordable, it doesn’t mean it is a good idea to bet the farm on it. The poor man’s covered call is a trade of leverage. It can be a trade to reduce volatility or greatly enhance volatility.
Let’s look at our example trade on $100 underlying stock on a $10,000 account. We could buy 100 shares of stock for $10,000 as a base case and use all our capital and we have market risk all the way to zero with a Delta value of 100.
If we set up one contract of the poor man’s covered call like our above example, we risk $750 and have the equivalent of 50 shares of stock, so much less volatility and downside risk, while still controlling a notional 100 shares through our contracts. Our loss is limited to $750, which will occur if we hold our long to expiration with a stock price change of more than 7%. This becomes a very conservative trade compared to owning stock or a traditional covered call, if we keep the rest of the account in cash.
If we trade two contracts, we have 100 Delta in total portfolio for a cost of $1500. At this point, our volatility is the same as 100 shares at the current price. However, our loss is limited to $1500, not $10,000 like stock. But now, we lose 15% of the account value on a 7% down move as we are controlling 200 shares of notional value through 2 contracts. We also get double the benefit to the upside compared to one contract. We also get double the Theta of a covered call, or a single contract of a Poor Man’s Covered Call. So the trade acts like stock when the price stays close to the opening price, but shows some leverage on moderate price moves. Arguably, one could say the extra benefits of leverage are worth the potential added risk to the downside- we still are only risking 15% of the account value, not all of it.
What if we take the trade to an extreme? We can easily do 10 Poor Man’s Covered Call contracts for $7500 cost. Our Delta increases to 500, so we get 5 times the movement of owning 100 shares, and our ten contracts now control 1000 shares of stock, a notional value of $100,000! With all this leverage, we get huge Theta. We also get a lot of volatility. If the stock goes up 1%, we make 5%, but the downside is the opposite. The big risk is that we can now lose 3/4 of our account if the stock goes down just 7%. Now we’ve made this trade into a virtual roulette wheel, big wins or big losses. Our probability of profit is still over 50%, but we’ve taken on a huge risk. Our max loss is a move down of just one standard deviation, which is not that unlikely. In fact, if we trade like this for very long, we will surely hit max loss within a small number of trades. We can potentially limit worst case scenarios by cashing out when the going gets tough, but that goes against natural instinct and can be hard to follow as a plan. The bottom line is that this would be a clear example of way too much leverage.
The point of these capital use examples is to show that a trader has to really understand the advantages and risks of leverage in a trade like this. The same trade can be very conservative, or extremely risky, depending on the context of the account it is in. So it is up to each trader to evaluate how the combination of trades affects the performance of the full account. You can read more about these concepts in my write up on Portfolio Management.
Assignment Risk
Since the Poor Man’s Covered Call involves selling calls, there is always the potential for those calls to be exercised by the buyer. With an actual Covered Call, the exercise means the covered shares are sold to fulfill the contract. But with a Poor Man’s Covered Call, there are no covered shares, just a long call in the money. Assignment in this trade means that the account has to sell shares that aren’t in the account, so the account holder will end up with short shares plus cash from their sale.
From our example we have been using, let’s say that the stock goes up to $105 and the short call of our position gets exercised by the owner of the call. We wake up the next day with -100 shares of stock and $10,300 added to our account. And we still have our long call contract well in the money. It’s a mess. A lot bigger mess than just having our long stock sold, because there are more moving parts. But it’s a good mess, because our positions have made a nice gain, especially our long call.
We can untangle our mess by buying our short shares back. We can also sell our long call at the same time to get a clean slate and then decide whether we want to open new positions at Deltas that are closer to where we’d like to be. So it isn’t that hard to straighten everything out.
In my write-up on Covered Calls, I wrote a long section on how to avoid assignment. The discussion is the same for this trade, so I won’t repeat it. Read the Covered Call write-up if you want to explore those tactics. There’s really less concerns about assignment with a Poor Man’s Covered Call because eventually the long call needs to be sold or rolled and the combination of the two can be re-positioned together if needed.
Final Thoughts
The Poor Man’s Covered Call has a lot of advantages compared to owning stock and selling calls. The trade provides a bullish outlook with positive Theta decay, while limiting risk to the downside. It typically has a greater than 50% probability of profit, while being a debit trade, which is rare in options trading. The trade does provide leverage, so care must be taken in managing the size of the position within any account.
The Covered Call can be done in almost any account, requires no extra capital if you own 100 shares of stock, potentially increases portfolio income, and reduces volatility of returns.
Most discussions of options start with the Covered Call. The Covered Call can be done in almost any account, requires no extra capital if you own 100 shares of stock, potentially increases portfolio income, and reduces volatility of returns. What is not to like?
What is a covered call?
For those not familiar, a covered call is a trade where the owner of stock, sells a call for that same stock. This can also be done with exchange traded fund (EFT) shares. The risk of selling the call is “covered” by the shares that option owner has. The worst thing that can happen to the call position is that the stock price goes up and the call is exercised and the shares are “called” away.
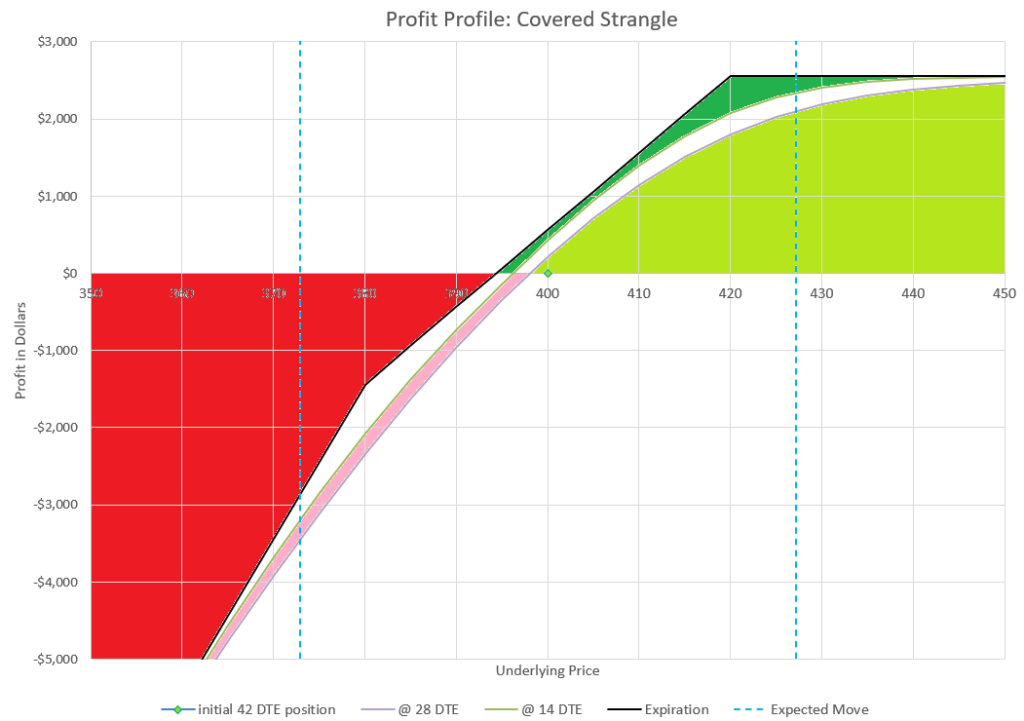
Let’s look at an example. Say we own 100 shares of a stock currently trading for $400 per share. We can sell a call with a strike price of $420 expiring in 6 weeks or 42 days for a premium of $2.00, and collect $200 (1 contract is 100 share times the premium). By selling a call, we agree to sell our 100 shares for $420 any time in the next 6 weeks if a call buyer exercises the option. We don’t have a say in it, only the buyer does. But, if it happens, we also keep the $2.00 premium we just collected, so the total profit would be $22 over the current $400 share price, a 5.5% gain in 6 weeks or less. More likely, the call option will expire worthless if we don’t do anything and we keep the $2.00 premium and the 100 shares. That’s the proposition, and the potential outcomes from holding until expiration. And most people who discuss selling covered calls end the discussion with that, but this site is written for data-driven option traders, so let’s dig in deeper.
Below is a profit chart showing the profit profile at different points in time. One thing to notice is that the all the lines near the current price see to be close to parallel, or tracking with the expiration profit and the profit from just holding 100 shares alone. Those two lines are parallel, with the difference being the $200 that was collected when the call was sold.
However, if we look closely the lines representing the value at 28 days and 21 days aren’t quite as steep. This is because the time value varies significantly over different underlying prices. Initially, the Delta of the call being sold is 0.20, signifying that its value will change by 0.20 for every dollar the underlying stock changes in price, and meaning there is a 20% chance it will expire in the money. I find it easier to think of the our Deltas in whole numbers representing 100 shares, so our 20 Delta calls that we sold combine with the 100 Delta of the underlying shares to give us a net Delta of 80. So initially, our total position is going to move up or down $80 for each dollar in price that our stock changes. That means our position is only 80% as volatile as owning stock outright.
Covered calls improve the probability of profit over owning stock alone in exchange for giving up unlimited upside.
Another thing to notice is that even after a few weeks, the position has a profit even in a small $1 decline in stock price and is ahead of stock alone for the first several dollars in price increase compared to owning stock outright. So, if the price doesn’t move much, we have a profit and a better profit than owning stock. This is a nice outcome when the market doesn’t move.
A big move down is still a big move down for our total position, we just lose $200 less than we would have if we hadn’t sold the call which is only a small consolation if the stock drops 10 or 20 percent. As the market goes up, the position makes money, but we have an upper limit based on the strike price of the call. A quick move up increases the Delta of the call and keeps the overall position value well away from the expiration value until we get to expiration. So, at big moves, we have virtually unlimited risk to the downside and limited profit to the upside, which seems a bit backward.
If you sell covered calls much, you’ll have a number of situations arise of extreme moves in one direction or the other that can be very frustrating. This situation really turned me off from this strategy for a long time until I focused into probabilities more and worked out my management strategies. Before we get into those, let’s break this trade apart to see how each component behaves individually and see how that might make you think twice about the strategy.
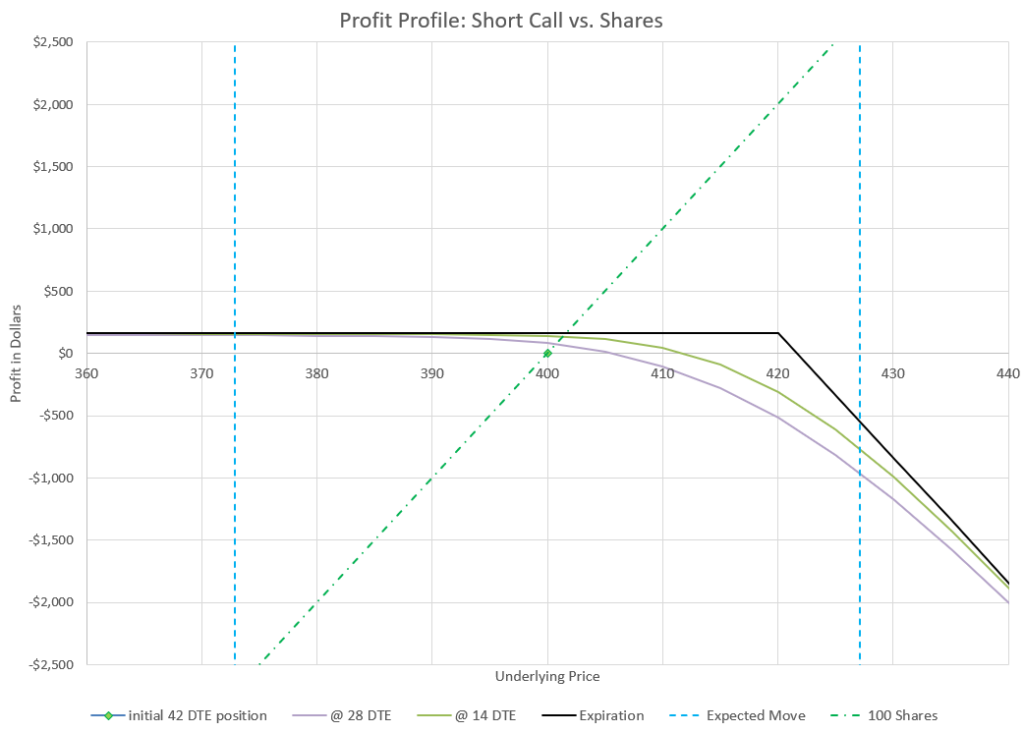
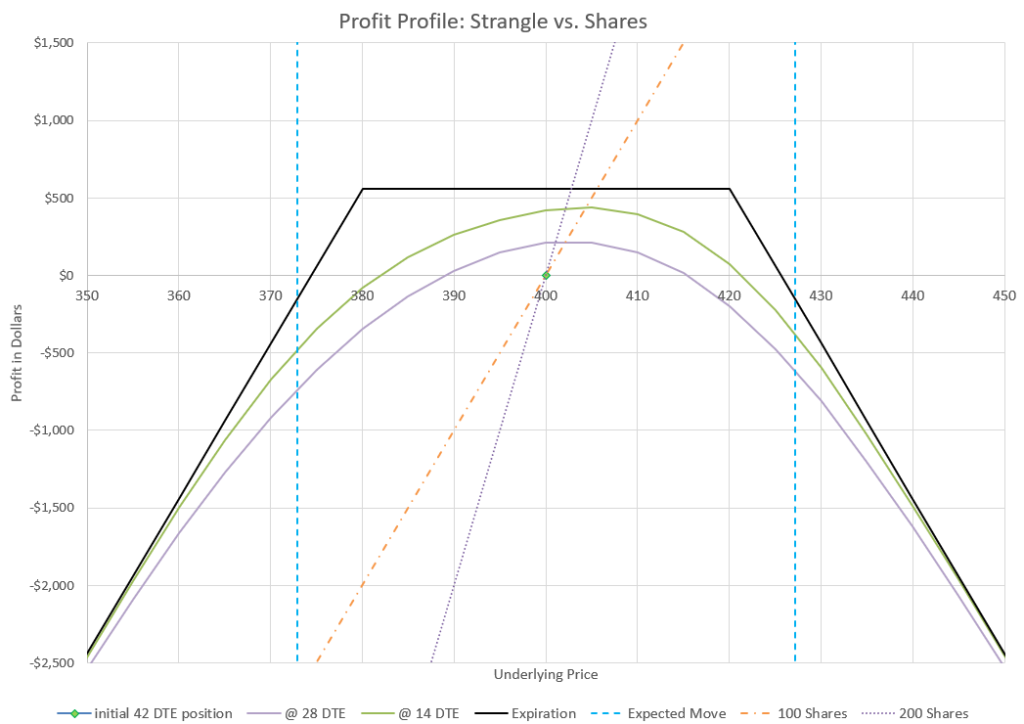
Here we see the profit profile at different prices and times for just the call that is sold and the underlying shares.
Anyone who isn’t a fan of the covered call can point to a graph like this to help explain what there is to not like about selling a call. The issue is that in a big up market the call can lose a lot of money- all the money that the stock is making, and that is money that is then gone through the short call. We could have had a big profit from owning stock, but now we don’t. Before we get to feeling too sorry for the trader in this situation, we need to back up and remember that we didn’t actually lose money, the trade is a profit, just not as profitable as if a call hadn’t been sold.
Particularly in bull markets, selling calls outright is often a losing strategy over time. Even though the trade has a relatively high probability of profit, the losses of the lower percentage of losers can be much bigger than the gains. Run backtests and it is hard to find a naked call selling strategy that is profitable over time. So, one might decide to skip the call selling and just stay long. But we are talking about covered calls, not naked calls, and the stock portion of the trade make a difference.
I’ve read lots of books and articles about how selling calls is like creating a bonus dividend on stock- make an extra 5-10% per year by selling calls on stock that you already own. The actual results would say that maybe with good management, a covered call seller will beat the buy and hold seller. Just don’t expect selling calls to be a get-rich-quick scheme. It isn’t.
What can be done to improve results of selling covered calls? First, we need to have a mindset to look at the true benfits of selling covered calls. Next, we need a toolbox of management strategies for dealing with the ups and downs of selling covered calls. And finally, we need realistic expectations of the type of results that can be achieved. If we do all these things, we’ll find selling covered calls to be a satisfying strategy.
Benefits of Covered Calls
Selling covered calls has three significant benefits-reduced volatility, additional income, and improved probability of profit. Let’s take them one by one.
Trading options can be used as a way to influence the volatility of the returns of a portfolio. Most people think that options are extremely risky, but it really is a matter of how they are used. Selling covered calls is a way to reduce risk by reducing volatility. If a trader has 100 shares of stock, the position goes up or down $100 for every dollar change in share price of the stock. If the owner sells a 25 Delta call against those shares, the total position will now move only $75 up or down for every dollar change in stock price. Voila, a less volatile position! While a 25% reduction in position volatility may not be that much, it is a reduction. Taken with other steps to manage the overall Delta of a portfolio, every action contributes to the final result.
The obvious benefit of selling covered calls is additional income from the call premium collected. But it isn’t how much premium we collect when the trade is opened that matters, but how much we keep when the trade is closed. I’ve said that this trade can be tough to show a profit from the calls themselves, so what is a reasonable profit target from the sales of calls? Generally, if a covered call seller can hang onto 25% of the call premium collected on average over time, that’s a successful outcome. As mentioned earlier, the challenge is that most of the time, the amount kept will be more, but occasional moves up will take big losses on the call portion of the trade. These losses are offset two ways- the long stock goes up when the calls lose value, and the calls shield some of the losses of stock on down moves.
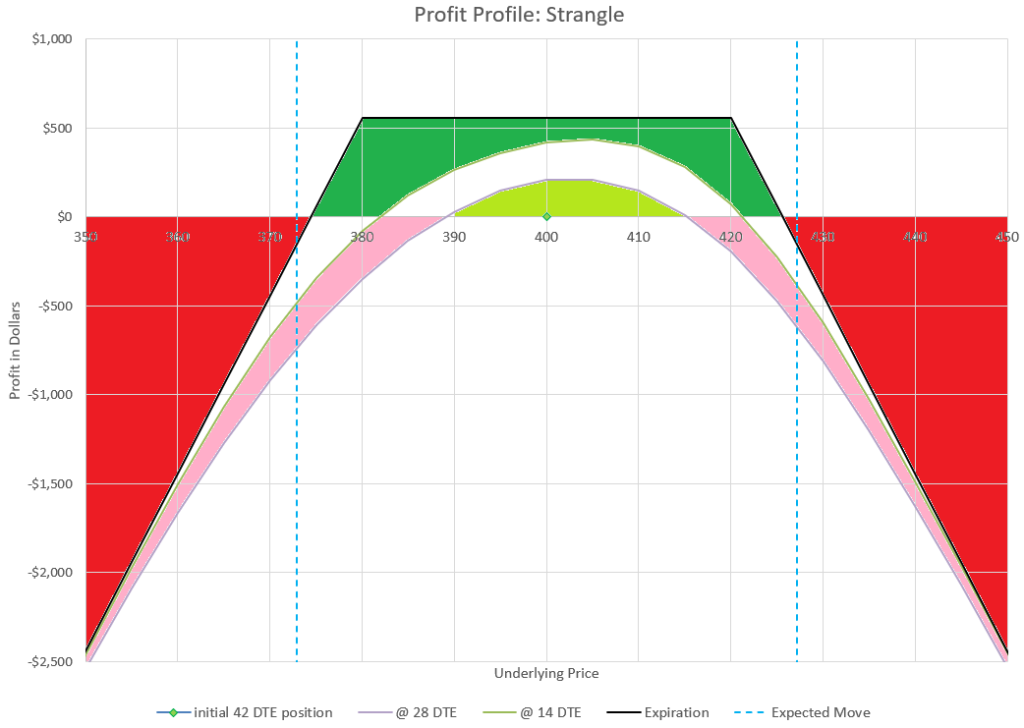
The nature of the trade is always one side is winning while the other side is losing. But there are also situations where both sides of the trade can win at the same time. Small increases in price allow the stock to go up and the short call option to decay in value with a little time passing. Looking at the original profit chart, we can see that the net profit is positive on both up moves and slight down moves, which makes the probability of profit greater than 50%. We can improve the probability by managing the trade early before the underlying price moves far from where the trade opened. This is one of several management strategies to consider.
Managing a Covered Call
As with all option trades, we have our typical choices for managing- hold, fold, or roll. But there are a lot of different scenarios that can impact our decision making, depending on price movements, implied volatility changes, and the approaching payment of dividends. There’s also philosophical strategy choices around whether a trader wants to let shares be called away, or avoid options being exercised. All these various considerations make it a somewhat complex menu of management choices for the trade that is often considered the most simple option trade of all.
Most covered call sellers I know or have read about consistently have covered call positions against their long stock. It isn’t something they sell for a while, then stop and start randomly. More than any other option trade, covered calls are a commitment to ongoing trades. The question is what that commitment is for each trader.
There are some traders that sell covered calls only when their stock is trading at high levels. The thought is that it isn’t likely to get much higher, and so it’s a good time to pull in some extra income. But what is high? And what is low? Whatever the market outlook, covered call traders need management strategies.
As mentioned earlier, most management strategies fall into the categories of hold, fold, or roll. With covered calls, holding means holding the calls until expiration or assignment, and dealing with the outcome. Folding would imply getting out when there is a win or a loss beyond a set amount, but most covered call sellers aren’t stopping when they hit a trigger, they want to keep trading. So, that leaves us with rolling, where we move from one call to another to another, collecting all the premium we can over time. I’m going to focus on holding strategies and rolling strategies as they make the most sense for covered calls.
Holding and Wheeling
When a trader sells a covered call, the default way to manage is to hold until the option expires or gets assigned. Many traders like this way of managing because of simplicity- just let the market play out. For stocks with less liquid options, frequent trading isn’t practical. Outside the most traded 100-200 most active stocks, there are few strikes to trade and lots of stocks with only monthly expirations. Many stocks don’t have any monthly expirations beyond around 45 days, so rolling month to month isn’t a legitimate choice until expiration anyway. So, if a trader is selling covered calls on a basket of stocks, many of the options can only logically be managed by holding until expiration or very close.
If a covered call is held to expiration, there are two outcomes. It expires worthless or the call is exercised and the shares sold for the strike price. The outcome determines the next step for most traders.
If the option expires worthless, most traders will turn around and sell another call option. Since options expire at the end of the week, this means selling on Monday of the following week or soon after to get as much premium decay as possible in each expiration cycle. Perhaps a trader will choose a strike and enter a limit order to try to capture a little extra premium on a small up move. If the option expired worthless because of a big down move, it could be a good time to evaluate whether to continue owning the stock or whether it makes sense to sell calls with the stock price so low.
Most covered call sellers try to avoid selling calls at strikes less than their basis price. For example, if a stock was purchased for $100 and a $110 strike is sold for $2.00, and the stock drops to $85 a share, the option will expire worthless and the trader’s cost basis becomes $98. If the trader now finds a good option to sell has a strike price of $95, this might be a no-go because there is no way to make a profit. Or it might get some premium back against the paper loss incurred. The trader has a decision to make.
I typically look for new strikes with a Delta between 20 and 30 for covered calls. I want to get good premium, and it’s okay to take on a higher probability of expiring in the money because my call is covered. Other traders sell much lower Deltas, trying to reduce assignment risk. It’s a personal choice- how much assignment risk does a trader want to get paid for.
When a covered call gets exercised and the stock is sold at the strike price, the seller has a few ways to proceed. If the stock was one that the owner was happy to be rid of, it is a good time to do something else with the capital that was freed up. But if the trader wants to get back in the position, a common tactic is to move to the next step of a Wheel strategy.
The Wheel strategy deserves its own writeup, but the covered call is part of this common covered strategy. The wheel is a cyclical strategy of selling covered calls and cash secured puts. Here is the basis steps of the Wheel:
Sell a cash secured put out of the money.
As long as the cash secured put expires worthless, sell another cash secured put.
When a cash secured put is assigned into long stock, sell a covered call against the stock.
As long as the covered call expires worthless, sell another covered call.
When a covered call is exercised, and the stock is sold, sell a cash secured put to restart the cycle.
Many traders like the Wheel strategy as it tends to force them to buy low and sell high. Puts get assigned when stock prices go low, and calls get assigned when stock is high. For many option traders, this is “the strategy.”
Rolling Continuously
Another approach is rolling positions regularly, well before expiration. The goal is to get a nice chunk of time decay, then close the position and open a longer-dated position for a net credit. A side benefit is that assignment of the call can be mostly avoided by frequent rolling. The strikes can also be adjusted with each roll to stay close to optimal Deltas and probabilities.
Not all stocks and options are optimal for rolling. Good underlyings for rolling calls need to have good liquidity with lots of strikes, good option volume, and frequent expirations. I like stocks that have weekly expirations because they tend to have good volume and lots of choices. These stocks tend to have weekly expirations out up to six weeks, and monthly expirations every month for several months out.
As mentioned earlier, I like to sell calls with Deltas between 20 and 30. With rolls, I look for new strikes in that range where I can collect a net credit. That isn’t always possible, so we need to consider the various scenarios that can arise, and have a plan for each.
Let’s start with the easiest scenario- the stock price doesn’t change. In our earlier example, we sold a 420 strike at 42 DTE for $2 when the stock was trading at 400. Two weeks later, the premium has decayed to $1 and the stock is still at 400. We can just close our current call and sell another 42 DTE call at 420 for $2, and have a net credit of $1. We made $1 profit on a $400 stock in 2 weeks- a 0.25% return while lowering risk and the stock didn’t change. If we could do that every two weeks, we’d have an extra 6.5% return in a year. We just need the stock to cooperate with our plan. But we know that it isn’t that easy, prices change.
Rolling up when the stock goes up
When underlying stock prices go up, calls increase in cost and the Delta gets higher. The goal of each roll becomes trying to move the strike price up to get a Delta a little lower while still collecting a credit. Looking at our earlier example where a call was sold at 420 when the price was 400, let’s assume that after 2 weeks, the stock price has gone up to 410, a 2.5% increase, which would not be unusual at all. Our call has gone from a value of $2 when we sold it to $4 because it is closer to the money. If we roll back out to 42 days at a 420 strike, our new Delta would now be 40, higher than we like. If we roll to 430, we would have a 25 Delta, but we would have to pay a debit because of the premium cost difference. However, we find that we can sell a 425 strike for $4.20, 20 cents more than our current call will cost us to sell, and the Delta of the new call would be 34, closer to where we’d like to be, but not all the way. It’s a compromise. We can collect a net $0.20 credit and move our strikes up a bit. This would be my choice.
One reason I don’t get wound up about getting all the way to my target Delta is that I know that stock prices go up and down. So, while my Delta is high on this roll, if the market goes down, the Delta will come back to where I was targeting. I somewhat expect that, but I really don’t hope for that, because I get much more portfolio movement from my stock than from my call. Remember that when the price went from 400 to 410, and the call went from $2 to $4 in value, the net of that move was $8 profit- a $10 gain from the stock against a $2 loss from the call. The price move up is always a good thing when we have a covered call, even if the call’s value is a loser for us.
But what if the price keeps going up and the call keeps getting more expensive and our calls end up in the money, or even deep in the money? No matter how far the stock goes, our calls are a combination of intrinsic and extrinsic (time) value. The time value of the call is always decaying. We can always roll out to the same strike for a credit, and usually we can roll up a little as well. Let’s say our call that we started with in our example gets to a point where it is $20 in the money and has a value of $22 with 28 days left to expiration. We look around our choices to roll and find that any roll up two weeks further out will not get us as much premium as we have to pay to close, so we see that we can sell a call $19 out of the money for $22.10 with 49 DTE. Is that a good deal? I think so, because we are locking in a dollar more value if the option were to be exercised while collecting 10 cents to do it. As our calls get deeper and deeper into the money, the chance that our stock gets called away goes up, so every strike price increase we can get with a roll improves the price our stock could get sold at.
How long do we keep this up if we get deep, deep in the money? At some point, we may find that there aren’t calls that are liquid around the strikes we are trying to roll to. That’s when it’s game over for me. I’ll stop rolling and let the call get exercised and sell the stock. I’ll have a nice profit on the stock from where I started, and re-evaluate what to do. Maybe I’ll wheel back in by selling a put, or maybe I’ll look for another opportunity in another stock.
Rolling down when stocks go down
Rolling down as stock prices go down is actually a little trickier and can be a trap. The issue is that while the call makes money when the stock goes down, the stock loses several times more value. As an option trader, the challenge is to step back and see the big picture. We can’t just look at our call profit, but the total position as we strategize going forward.
A key consideration in managing rolls down is looking at the cost basis of the overall position. If our earlier example was that we started by buying stock at $400 a share, we start with a cost basis of $400 per share. If we then sell a call for $2, our total cost basis is reduced to $398. Every call we sell reduces our cost basis. Let’s be clear. This isn’t our cost basis for tax purposes, but for how we might choose to think about our overall trading position. The IRS looks at the profit and loss of each individual trade, not how trade after trade impacts your total net costs. But many traders like to think about the total capital they have spent and collected to evaluate whether to continue with a strategy.
So putting this concept to use, let’s say our stock that we’ve been discussing throughout this write-up goes down from 400 to 390 in the two weeks after we opened the trade. Our 420 call price drops from $2 to $0.25 with a Delta of 5, almost worthless. Should we roll down? We could roll to a new 410 strike 42 DTE call selling for $2. 410 is above our cost basis, so if the stock went up beyond 410, we’d still have a nice profit, so why not. We can collect a net credit of $1.75 and reduce our net cost basis to $396.25. We’ve done great on the call, but remember our stock lost $10 per share, while we only made $1.75 on the call.
If the stock bounces back from here, we would tackle the position with a roll up strategy like we just discussed. But if the stock keeps going down, we can keep rolling down.
Let’s say that after our roll down, the stock drops to 375 after another two weeks and our call drops to 10 cents of premium. We look at 42 DTE strikes and find that we can sell a 395 strike for 2.10 because IV has increased from the drop in stock price. Is this still a good deal? If we sell this call, our net cost basis will now drop to 394.25 while our strike is 395. If the option were to be exercised at 395, we’d have a small profit, so if we still like the stock, this trade could still make money.
If we take another hit to the stock price, any rolls of similar price differences at the times we have been trading will need to be sold below our cost basis. If we want to keep our strikes above the cost basis, we can go further out in time, or take a lot less premium at lower and lower Delta values.
If we follow the stock further down with even lower strikes we enter into a lose/lose situation. If the stock keeps going down we lose, and if the stock goes up beyond our strikes we also lose because we are likely to have to sell for less than our net cost basis.
By this point most traders will either abandon selling calls on the stock, or dump the stock and find something else to trade. Every trade needs a plan, and one part of the plan is knowing what you will do in a big loss- is there a price that enough is enough? As we’ve discussed at other points, the biggest mistake most traders make is taking small profits on winners, and holding onto big losers- a recipe for a losing portfolio over time.
Big moves up and down can be tricky to manage for covered call holders, even stressful. But considering that compared to holding stock alone, a covered call seller is still in a less volatile place.
Avoiding Assignment
Is there a way to know if a call that we sold is going to get exercised by the buyer? Most of the time it’s pretty clear cut, but occasionally it is luck of the draw. Put yourself in the shoes of the call buyer-when would it be a no brainer to exercise your call option? In the money at expiration is generally automatic, but early exercise is usually driven by either an event in the next day that makes a buyer want to lock in a profit, or a need to close out a call that has become illiquid. Let’s go through these scenarios and see how to avoid being on the other side of the trade.
This section assumes that a trader wants to avoid assignment. As explained earlier, there are lots of traders and individual situations where a trader is satisified or even desires to have their stock called away. If you want to have your short calls exercised, do the opposite of this section’s advice and keep your calls in values that are subject to assignment.
A quick overview of the mechanics of assignment. Options are managed by an options clearinghouse. Option buyers have the “option” to exercise their option contract at any time prior to expiration. The buyer notifies their broker that they want to exercise an option and the broker notifies the clearinghouse. The clearinghouse then randomly matches up the requests to exercise options with short option contracts that are currently open. The clearinghouse assigns these contracts to sell their shares to the option buyers who have exercised their option. Option owners typically have until 5:30 PM Eastern Time, or an hour and a half after the market closes to notify the broker they want to exercise their call. The actual transaction generally is done around midnight while the market is closed. Key points are that it is up to the buyer, happens when the markets are closed, and is random.
Expiration Assignment
If a call is in the money when it expires, it almost certainly will be exercised by the buyer. Most brokerages automatically exercise all their customers options that expire in the money as a courtesy and also to save the administrative hassle of having every option buyer request the option to be exercised.
The logic is simple. The stock is worth more than the strike price, so it wouldn’t make sense to not exercise the option and buy the stock for less than the current price. That was the point of the buyer in purchasing the call option to begin with, to make money when the stock went above the strike price.
Occasionally, an option might expire right at the strike price or a penny or two in the money. Some option buyers may choose not to exercise because of the costs outweighing the benefit of buying the stock at a lower price. Or some news may make it clear that the stock will be worth less when the market opens the next day, make exercising a losing proposition. However, these scenarios are very rare, and a trader shouldn’t expect or count on them.
Just because a stock expires out of the money doesn’t mean that it won’t be exercised. When there is positive news after the close, and option buyers anticipate that the stock will open above the strike price, they can still exercise the option after the market close but before the clearinghouse assigns options to be exercised. If a call option buyer has a call with a strike price of 420 and they expect the stock to open at 421 the next day, they can exercise the option buying at 420 and sell the next day for 421. If you are on the other side, you shouldn’t be surprised, it happens.
How do we avoid all these expiration assignments? Simple, don’t hold options to expiration. Close or roll out options before they expire. Even if your plan is to hold to expiration and then sell another, you can close the expiring option on expiration day and sell a later expiring one at the same time, so you can keep getting decay over the weekend, since expirations generally happen at the end of the week.
Even if a call is in the money, you can roll it out in time and not get your stock called away at expiration. There is still early assignment risk and we have ways to greatly reduce early assignment, but expiration assignment is generally automatic.
Early assignment due to dividends
Probably the most common reason for call buyers exercising an option early is dividends. On the day that a stock goes ex-dividend (when owners of stock are credited with an upcoming dividend payment) there is a big benefit to being a stock owner vs a call owner. The upcoming dividend payment is baked into the stock price prior to the ex-dividend date and comes out after it. Call values also reflect this in pricing.
If a call owner has a call with a strike price in the money or within the amount of the anticipated dividend and less than the extrinsic (time) value of the option, they will execute the option every time. In fact there are traders that will buy options at the close of the day before a stock goes ex-dividend to immediately exercise for a profit if the arbitrage opportunity exists. It usually doesn’t because the market is very efficient.
There are two ways to avoid assignment on ex-dividend day. Have a call further out of the money than the dividend amount, or a call with more extrinsic value than the dividend. Let’s look at each situation.
If you have a covered call that has a strike price close to the current stock price, you are likely to be assigned. If however, the call is well out of the money, it won’t be exercised.
For example, if a stock is trading at $400 a share and you have sold a $420 strike call with a $3 dividend being credited the next day, no call buyer will exercise because they would have to pay $420 to own a $400 stock with a $3 dividend, a value of $403. Why spend $420 when the stock can be purchased for $400?
On the other hand, if the stock price is $400 and a call buyer owns a $401 strike call when a $3 dividend is being credited, then the option can be exercised to buy a stock for $401 that has a value of $403. Good deal for the buyer, right? Maybe- it depends. It depends on the extrinsic value of the call option. And you thought covered calls were a simple topic?
The extrinsic (time) value of a call impacts whether it makes sense to exercise or not for a dividend. For example, if a stock goes ex-dividend tomorrow trading at $400 today with a $3 dividend, would it make sense to buy a $401 strike call for $4 and exercise it? The buyer would pay a total of $405 to get a $403 value, a loss. On the other hand, if there were a $401 strike selling for $1, buyers would line up for blocks to buy as many as possible to pay $402 for a $403 value. In practice, prices wouldn’t work that way, because stock prices are varying while the market is open and option prices are adapting to make capturing a dividend on a stock close to a break-even trade as ex-dividend day approaches. So, you won’t find an option priced lower than the combination of stock price and upcoming dividend, but you can find options more expensive than the combination. What determines whether it is the same or more? Time value.
Extrinsic or time value of an option can make a call option more valuable to hold than to exercise to capture a dividend, even in the money. In our previous example we discussed a $401 strike call with a value of $4 vs. $1. What determines the difference in prices? Time and to a degree implied volatility. We can’t do anything about implied volatility- it is whatever it is. But we have total control over the time value of our covered call option.
The further out our covered call is from expiration, the more time value it has. So, if we have a call with a low amount of time value, lower than the coming dividend, we can roll the call out in time to make it have more time value than the dividend. The greater the difference in time value vs the upcoming dividend, the less likely the call will be exercised.
If we have a covered call with a strike price near or in the money, we can avoid assignment by rolling to a point in time where the extrinsic/time value is more than the expected dividend. It doesn’t guarantee that a rogue call owner won’t exercise for a loss, but it becomes highly unlikely.
As an example, if we have sold a 390 covered call trading for $11, expiring in two weeks, and the current stock price is 400, and a $3 dividend is expected to be credited to owners of record the next day, we are in position to have our stock called away. Why? Because our combination of strike price and call value is $401 (390 + 11) and the value of stock plus the dividend is $403 (400 + 3). Any owner of a call would cash in their call option for stock and collect the dividend. However, if we roll out 6-8 week further in time and keep our 390 strike but have a call worth $15, we are likely safe to keep our stock. Our $15 call has a $10 intrinsic value (400-390) and a $5 extrinsic value (15 -10). The extrinsic value is more than the $3 dividend. Seen another way, the call strike price and value now total $405, $2 more than the value of stock plus dividend, so it’s not a good value to exercise the call. Generally, if we have a covered call within a few weeks of expiration at or in the money, it will be exercised on the night before an ex-dividend date. Calls significantly further out in time will be safe.
For calls deep in the money, it can get difficult to go far enough out in time to have enough extrinsic value to be greater than the coming dividend. I once had a covered call stock run away from me to the upside, and I rolled my calls over and over. Eventually, my strikes were 25% below the stock price. Even with calls 6 months out in time, I had very little extrinsic value, almost all the call’s value was intrinsic. The Delta of my call was almost 100, so I had capital tied up that wasn’t going up or down hardly at all, no matter what the stock did because my call’s price moved almost exactly opposite of my stock. I decided as a dividend approached that it was time to let my position get called away, because I didn’t want to roll out 6 months further to get more premium. Sometimes, we just run out of ways to keep the position alive.
What timeframe for Covered Calls?
Throughout this write-up I’ve used 42 DTE as an example for writing covered calls. Is this optimal, or is there better durations? Generally, I like starting around 6 weeks and not letting my positions get within 3 weeks of expiration. I can adjust every few weeks or so, and I don’t have to watch my positions constantly. There’s good decay, at least enough for me.
Trading closer to expiration means faster decay, but more volatility in prices. For traders that can manage the additional changes in price, this might be fine. This is a covered call, so the worst case scenarios aren’t that bad, especially if the plan is to hold to expiration, or if the plan is to “wheel” the position.
Trading farther out in time allows for even lower volatility in exchange for less premium decay on a daily basis. Selling covered calls with more time to expiration can allow a seller to sell strikes farther out of the money as well for the same Delta value, giving the position more cushion in an up move. More time is generally equal to less stress.
The right strike for selling Covered Calls?
In addition to choosing a timeframe for selling covered calls, a trader has to pick a strike to sell. I tend to choose strikes with Deltas between 20 and 30 for covered calls, which is inside the expected move. Because I plan to roll well before expiration, I will likely roll before the stock will end up in the money. The calls are covered by stock, so I’m not particularly worried about my calls getting into the money on occasion.
Other traders are more conservative in choosing call strikes and want to be well outside the expected move. They will give up much of the premium to keep the probability of their call from getting in the money. There’s a somewhat popular book on selling covered calls that recommends 12 as the right Delta for selling a call. The author never says it, but 12 Delta is more than a one standard deviation move at expiration, and so it is “likely” that the call will expire worthless. If that’s the goal, then that’s as good of logic as it gets.
On the other side, if a trader wants out of a position, the value can be maximized by selling a call at the money and having a high probability of having the position called away. A “wheeling” trader might want a high delta especially when prices appear to be peaking, to sell the stock before it starts going down. The higher the Delta, the more the call counters the stock, reducing the position volatility. It’s depends on the trader’s goal for the trade.
Final Thoughts
Trading options is all about making choices of trading one position for another, trying to move to a position that has better probabilities of profit, or less risk, or some other variable that is important to the trader. We can see there are lots of ways to trade what many would consider to be the most straight-forward option trade of all, the covered call.
Buy stock at a big discount? This strategy is often referred to as stock replacement. We buy calls, have the same upside as shares of stock but at a fraction of the cost. Look for two things: relatively high probability and low Theta decay.
Want to buy stock at a big discount? This strategy is one that is often referred to as stock replacement. With this strategy, we can buy options that have the same upside as shares of stock but at a fraction of the cost. In theory any time someone buys a call, there is the same upside as stock, but some setups give a trader more of the upside benefit than others.
When I think of using options in place of stock, I’m looking for two things, relatively high probability and low Theta decay. When buying a option with no hedge, the natural way to lower time decay is to buy a call well out in time where it will decay slowly. To get it to move with the underlying stock, having an in-the-money option can get most of the move up (or down).
So for this strategy, I look for options 6-12 months out with a Delta value of 75-80. These options will likely cost 10-20% of the cost of the shares as they have significant intrinsic and extrinsic value. With over 6 months until expiration, time decay is slow, but still present.
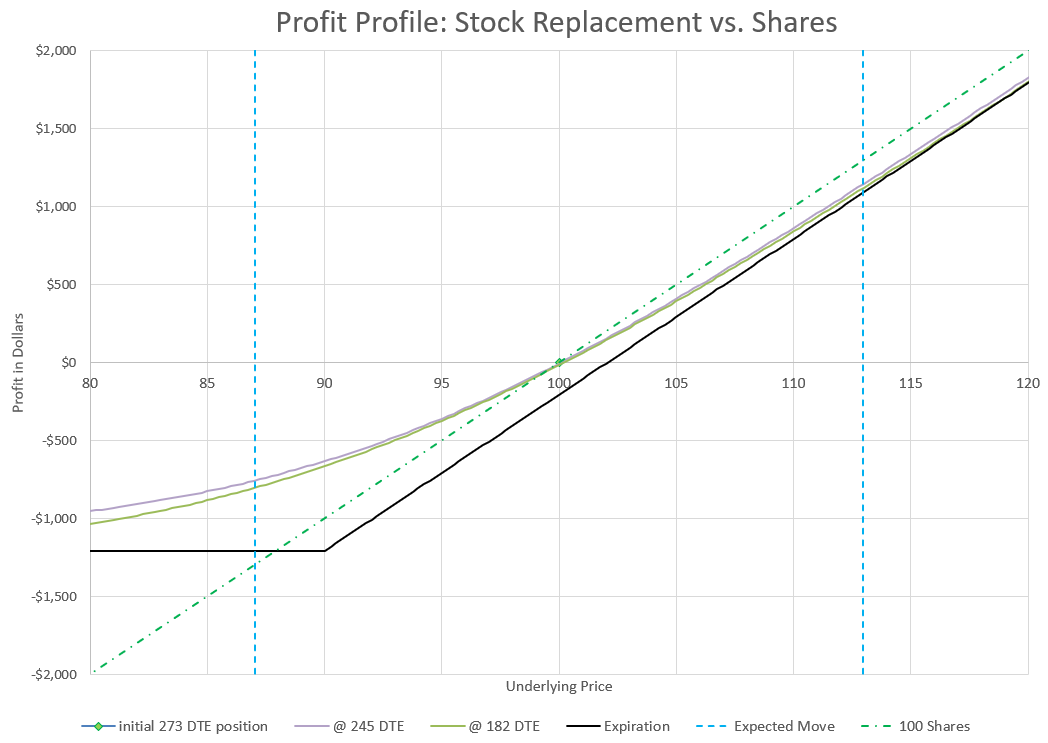
In this example, a call is purchased with 9 months (273 days) until expiration with a Delta of 0.78. Notice that even after a month or even three months, the profit curve is very close to that of owning stock around the money. Notice that the downside is significantly less than stock.
Because I’m buying an option with a Delta of 75-80, I have the equivalent of 75-80 shares of stock from a price movement stand-point. If the price goes up, over time the Delta will increase and the option will behave closer and closer to the movement of 100 shares of stock.
The risk to the downside is limited to the amount paid for the options, so a big market drop could wipe out the position, but even a big drop would still likely hold some value, but mostly the extrinsic time value. However, the really good news is that losses in the options on a downturn are less than the losses that would come from 100 shares of stock.
My goal in this trade is not to hold until expiration, but to either exit or roll to a longer duration before we get into the last quarter before expiration. If the stock price has gone up, I can roll to a new time at a higher strike price and collect the amount the stock has appreciated less the time decay that was lost.
This trade needs a small move up to break even, so the theoretical probability of profit is a little less than 50%. But, by getting out way before expiration, the odds get ever closer to 50/50, and in a bull market the unlimited upside with limited downside is a pretty compelling proposition.
One watchout with this trade (and other long call option strategies) is thinking that since we use just one fifth or one tenth of the capital of buying stock that we can now buy five or ten times as many options and really cash in. We have to respect the downside risk. A big move down will wipe out this position. So we don’t want to put all our eggs in this basket.
But when the market is frothy and looking like it is going nowhere but up, this is a good way to participate in the upside while protecting the downside, assuming that there’s plenty of capital left to deploy if the market suddenly goes against the position.
What level of option risk goes best with what type of underlying security? Depending on the option strategy, your choice of underlying security type can have a big impact on your outcomes.
What level of option risk goes best with what type of underlying security? Most people reading this might wonder what in the world is the point of this topic and why should I care? Depending on the option strategy, your choice of underlying security type can have a big impact on your outcomes. This might get a little deep, but hang with me and I think it will be worth your time.
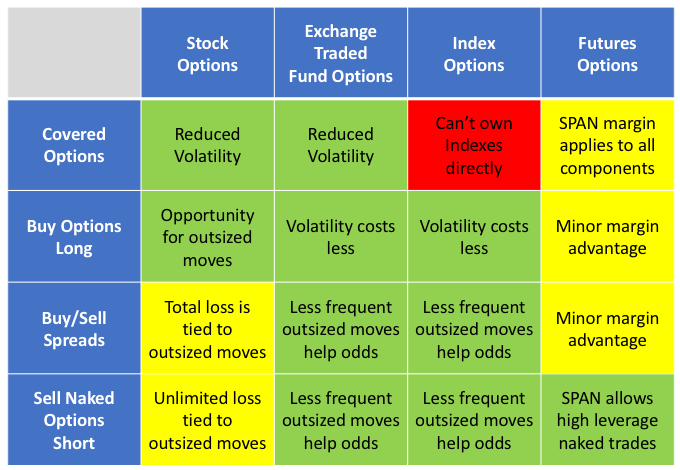
Level 0: Covered options- cash secured puts and covered calls
Level 1: Buy options
Level 2: Option spread trades- buy an option, sell an option
Level 3: Naked option selling
There are also four general types of underlying securities for trading options. With each comes different advantages and disadvantages. As a reminder the four types are:
So the question and point of this post is to examine which risk permission levels work best with which types of underlyings. It’s not an obvious question or an obvious answer. Most traders would say it doesn’t really matter- more risk is more risk, and less risk is less risk. But some underlyings are better built for certain strategies more than others. It doesn’t mean you can’t trade a strategy for a certain underlying, it is more of a question of what is optimal for the type of risk and potential return you are seeking in a trade.
The Matrix
I made a sixteen square matrix to evaluate each combination. I rated each pairing based on how well the option risk matched with the characteristics of the underlying. My conclusions are simply my opinions, and I welcome discussion and other opinions backed by data. So here is my matrix and what follows is the data and logic behind it.
Some types of option strategies and risk are better suited for certain underlying securities than others. With each combination is a brief explanation. Green choices are best.
Let’s review the boxes one row at a time, by risk level.
Covered Options
Covered or secured option strategies include covered calls, cash secured puts, covered strangles, and the wheel strategy. These strategies use the full value of underlying shares either in cash or shares to protect against loss from selling short options. The options being sold are much less volatile than the value of shares, so covered options are the only option choice that is a clear reduction in risk compared to owning shares outright. All versions of this option trading strategy limit upside growth while allowing the potential of losses to zero, but most of the time these strategies outperform owning stock outright. So how does this type of transaction impact different underlyings?
Individual stocks can be very volatile. Positive or negative news about earnings or products or lawsuits or mergers or management changes can make stocks move way outside their expected moves. These outsized moves happen more often than normal statistical distributions would predict. Even so, individual stocks tend to have options with much higher implied volatility than the overall market. For stock investors that want to dampen day to day moves of their portfolio balances, selling secured or covered options is a great way to participate in individual stocks with less drama. Because of the crazy volatility of individual stocks and the high implied volatility of options on individual stocks, covered options are a great match for individual stocks.
I would argue that for both the covered strategy and the stock underlying type, this is the strongest match in this row and column. There is no better underlying for covered options than individual stock, and there is no better option risk level for individual stock. I know a lot of people will disagree, but as we look at the other combinations, I hope you’ll at least understand my point of view.
Covered options on exchange traded funds are fine trades. It’s probably the safest possible option strategy there is if we want to call any kind of trading “safe.” We combine a bunch of volatile stocks together into a product that dampens volatility down substantially. Then we sell options against that new product that will rarely see moves outside the moves that are expected. The options may not pay a lot, but they won’t lose often either. A very boring way to make steady gains (and I’m thinking of boring as a good word here).
An argument could be made that covered options on ETFs is perfect for both, because it’s a double volatility reduction, and for risk-averse traders that’s a great combination. I get that, but for me, I think it’s a little too much volatility reduction, and sacrifices too much option premium for safety. Be less volatile with stocks by selling covered options, or be less volatile with riskier option strategies by using ETFs, not both. But I’m generally a risk taker, so maybe I under-appreciate the double volatility reduction of covered option strategies with ETFs.
Covered options on indexes is the easiest combination to rate on the matrix, because it is the one combination that can’t be done. We can’t own an index outright, so we can’t sell a covered call. If we sell a put and get assigned we don’t get the index, we just pay up the cash we lost. So, there isn’t a real way to sell covered index options on the underlying index. This is the only red square in the matrix because it can’t be done.
Covered options on futures can be done, but it doesn’t really make sense. Futures and futures options are all governed by span margin, so really there isn’t an official way to sell covered options on futures, because there is margin being used on every leg of the trade. No piece is fully “covered.”
I almost made the covered futures options block red, but you can kind of do it if you set aside the cash that the full notional value of the future is worth when you sell a call against a future, or sell a put on a futures contract. The problem is that your buying power won’t show that you’ve locked up the full notional value, so you have to track it yourself. It just isn’t what futures are about.
Let’s do a quick example to illustrate. Let’s say we have a futures product that trades for $1000 with a multiplier of 50. So the notional value of a contract is $50,000. If we buy a futures contract, the broker will use SPAN margin and only take away at most $10,000 of our buying power, even though we are on the hook for the full $50,000. If we sell a call on the same future, we’ll likely gain buying power, as we just reduced the volatility of the position. Maybe SPAN margin says we now only need $5,000 buying power, while we remain at risk for $50,000. So, our broker and SPAN margin don’t make us “cover” our options. You can keep $50,000 in your account to cover the trade yourself, but nothing forces you to, other than wanting to eliminate any risk of blowing up your account in a downturn. It’s fine to do this, but it technically isn’t a covered option, so it’s a yellow square on my matrix.
Buying options
When most people first learn about options, buying an option is the trade they can easily understand. You pay a premium to have the option to either buy or sell something. Margin is not a factor, because the risk is defined. The risk of the option is the cost, it can end up worthless, a total loss, but no more than what was paid to own the option. If the option ends up in the money, it may be profitable, maybe very profitable. Leverage comes from the possibility of virtually unlimited profit for a relatively low cost.
Buying puts or calls is like going to the security market casino. It’s a low probability bet that might pay off big, but often will lose what you gambled. But let’s not get all “judgy” against the strategy- lots of directional traders buy options to get the most out of a move they think will come. When implied volatility is low and the market is rolling up nice gains, it can be a very lucrative trade that exceeds its predicted probability. But which underlying security types are best fit to take advantage?
Individual stocks can make big moves up or down, and owning an option in the right direction when a big move happens can be great! But the market knows that individual stocks are prone to big moves so options are expensive to buy. A little move won’t cut it. A trader has to be very right on timing and direction.
But, if buying calls or puts is your thing, the biggest rewards are with individual stocks. So, I’ll give it a green square.
Buying options on ETFs is cheaper than stocks, but the likely moves won’t be as big. However, if the goal is to ride a trend that is going up faster than what implied volatility predicts or a slide going down, ETF long options are a good choice.
In a bull market, selling calls is usually a loser, which means that buying calls can be a winner. Buying calls on an ETF in a bull market will hit a lot of winners usually without a lot of capital required, so probably the best use of the strategy in this row.
Buying put and call index options is a very similar situation as options on ETFs. It’s really a matter of preference, depending on several factors. Some brokers restrict access to index options, so it might not even be a choice for some accounts. Most index options are bigger notional value, often 10 times as big as the equivalent ETF, so it might make more sense for a bigger account to use index options, while smaller accounts stick to ETFs. There are a lot more ETFs available than index options, so niche indexes either don’t have an index option or have such poor liquidity that the only choice is an ETF. Commissions per contract are often higher on index options, but per notional amount are lower. So, it depends on a lot of things. I’ve discussed the differences in much more detail in my write-up of different ways to trade the S&P 500. All the same trade-offs are true for the Nasdaq 100 and Russell 2000. So, for some traders buying options, the index option might be best so I’m coloring the combination green, but for most traders smaller, more liquid ETFs are going to be a better choice.
For futures options, the issues are similar as comparing index options to ETF options, except that buying futures options outright negates much of the advantages of futures options, but keeps the negatives. Futures options are a favorite of experienced and sophisticated traders because they can be traded with lower SPAN margin requirements, giving a trader more leverage, and also letting opposing positions reduce buying power. But, if a trader is only buying options, buying future options doesn’t gain much in buying power, but will cost a lot more in commissions and slippage from lesser liquidity than ETFs or index options. In my opinion the only time it makes sense to buy a futures option is to counter a bunch of short futures options or other futures position. I talked about this in my discussion of buying the 1 DTE straddle with futures options.
In the end, unless you have a really good reason to buy options on futures, it generally is a better trade to buy a similar ETF or index option product. So that’s why I colored this combination yellow.
Trading Option Spreads
Let’s define an option spread as buying and selling an equal number of puts or calls. There are a lot of ways to trade spreads, and many of my favorite strategies fall in this broad risk category. Option spreads have defined risk, but as strategies get more complex, understanding exactly how much risk a trade has defined can get a little tricky. It isn’t as obvious as the risk with buying an option, but the risk is known.
We can think of spreads in two main categories, debit and credit spreads. Debit spreads are trades where a trader pays to enter the trade, and credit spreads pay the trader to enter the trade. Credit spreads are often the highest leverage version of selling options, with the highest potential return on capital for many positions. With that potential high return on capital comes the risk of a total loss, often many times the amount that was collected to open the trade. How do these factors impact different underlyings?
With individual stocks having more likelihood of an outsized move, there is a bigger chance of a total loss on a credit spread, although that is somewhat balanced by higher premium from higher implied volatility. Debit spreads tend to limit max gain in exchange for improved probabilities compared to buying options outright. So, debit spreads on a individual stock miss out on big gains without a outsized increase in probability of profit.
Many traders favor spreads for individual stocks over naked options because of the defined risk limiting losses to a defined amount. My view is that both strategies have to contend with outsized moves and it’s a matter of picking which poison does the least damage. But because so many like spreads as a risk reduction for individual stock options and it is a viable strategy, I’ll rate this combination a yellow.
I’m going to lump ETF options and index options together for spreads. Just like with the earlier discussion on buying options, the difference between ETFs and indexes is a matter of preference and an individual’s account situations. Strategically, I like both for buying and selling spreads. Because ETFs and indexes are made up of many stocks, they have much fewer out-sized moves than individual stocks. This makes the leverage of spread trading work well, both in credit and debit type spreads.
As for buying spreads, I’ll occasionally buy a call spread when the market is particularly bullish and Implied Volatility is low. Buying options in any style is usually a low probability trade, but there are ways to improve odds, and using a spread to have decay on the short leg off-setting the decay being lost on the long leg can be a big help. We can get more exotic with diagonal trades selling a nearer term option while buying a longer term option and actually having positive Theta for our trouble. In all these trades I like ETFs and indexes because the results tend to be more consistent.
Many of the ratio type trades that I do utilize two sets of spreads, like the popular broken wing butterfly trade. Again, I like ETFs and indexes because outsized moves are less likely than individual stocks.
You may be sensing a theme. Less outsized moves make using the highly leveraged option spread on ETFs and indexes my favorite choice for spread trades. It’s green squares for both, and my favorite use of ETFs and indexes, as well as my favorite way to trade spreads.
In theory, futures option trades with spreads should also be as favorable as ETFs and indexes. They work about the same and have the same type of probabilities. But there are two things that I don’t like about trading spreads on futures. One is a personal nit-picky concern, and one is a concern that virtually any trader would have.
Let’s start with the most legitimate concern. Futures options are less liquid than ETF and index options. They have wider bid-ask spreads, and they are harder to fill close to the mid price between the bid and ask. In many trades, the tick size, or the amount you can adjust your limit price by is substantially bigger than for the same trade on an index option on the same thing. For example, on $SPX index, we can adjust our limit orders by 5 cents up or down, but with /ES futures, we have to adjust our order in increments of 25 cents. To make it worse, often the volumes are much lower and even giving up 25 cents won’t get an order filled. So, it can cost a lot to get filled, and we haven’t even talked about commissions, which are generally also higher, both per contract, and even more so as percentage of the notional value of the position. Maybe someday these costs will get lower and it won’t bother me as much, but I just don’t like it for spreads with futures options.
But what about SPAN margin you might ask? Doesn’t that extra margin make it palatable to pay a little more so you can get that super-duper leverage for traders that like more risk and more reward? Well, this is my nit-picky problem with spreads on futures. SPAN margin isn’t that much extra buying power for spreads with futures options compared to indexes, ETFs, and individual stocks. Because spreads have defined risk, the two sides of the trade already have formed a hedge and SPAN margin doesn’t give much more buying power than the reduction from calculating the max loss of the total spread being wiped out. To be fair, futures traders get some additional buying power, but it isn’t enough for me to justify the higher costs of trading spreads with futures options.
I know there are traders out there that like futures with spreads that little extra buying power that comes from SPAN margin, but for me it makes more sense to go with an index option or ETF option where my risk is defined and doesn’t change. So, I’m giving this spot on the matrix a yellow. Proceed with caution.
Selling Naked Options
Selling naked options is supposed to be the riskiest of the whole bunch of risky option trades. In one way it is in that maximum losses are essentially undefined, but even with margin, the leverage of Theta or Delta as a percentage of buying power is often less than what happens with spreads. So, as long as we avoid outsized moves (which we can’t, by the way) there’s a strong argument that selling naked options is not nearly as risky as it would seem at first glance.
Let’s be clear about what selling a naked option is about. With covered options, we can sell a call or a put and there is either cash or shares covering the short option positions. For naked trades, the broker lets us sell on margin. Often we are only required to have something like 20% of the notional value set aside for covering the option sale. That’s great for our account as long as the price doesn’t move against us more than that 20%. Actually, the broker will increase buying power requirements as price moves against a position, so the requirements are always in flux. But with plenty of extra cash as a buffer and markets not going crazy, it’s manageable.
So, we are selling options on margin. What underlying type does this work best with? Let’s check out our four choices.
Individual stocks are the most likely underlying to have an outsized move, so they are the most likely to get a naked option trade into trouble. It doesn’t take much, a change at CEO, a merger or acquisition, surprising earnings announcements, good or bad product news- any of these can trigger a move way beyond the expected move. With individual stocks, the probability of an outsized move both up or down tends to be greater that what Delta would predict, or it often just isn’t that great compared to the other products with diversified components.
That’s my reason for avoiding naked options on individual stocks. I know lots of people trade naked options on stocks all the time, diversifying their holdings to reduce overall risk. But for me, why not use an underlying that is already diversified? I know individual stocks have higher Implied Volatility to pay a seller to take on that added tail risk, but for me it just isn’t enough. I’ve seen too many situations where a trader has gotten a very nasty surprise and lost way more than they thought they could. It can happen with any naked trade, but it’s more likely with individual stock options. So, for me this is a yellow box- proceed with extreme caution.
Now, let’s not try to make the argument that naked options on the other types of underlyings are super safe. They aren’t, and you can lose big. Ask anyone who had naked puts on the S&P 500 (any version) when Covid hit in 2020. It was bad. But those kinds of moves happen much less often than negative moves in individual stocks. People that trade naked options take a lot of risk, and so the question for the remaining three underlying types isn’t which one is least risky, but which gives you the biggest bang for the buck? If you are selling naked options, you better know what the risk is, but how do you maximize return when you have a trade go your way?
Like the last two levels of risk, ETFs and index options have essentially the same pros and cons for naked options. While there is significant tail risk, it isn’t as high as individual stocks. So, naked options sales on ETFs and indexes tend to perform better than the expected move would predict. This makes these underlyings a better choice for underlyings on naked options. As a result, I’m giving these matrix squares a green rating.
Finally, we have selling naked futures options. On one hand this is a highly leveraged trade with ultimate tail risk due to SPAN margining. On the other hand, this combination gives a trader the potential for significant high returns on high probability trades that otherwise might not make sense.
I look at naked futures options as the ultimate “go big or go home” trade. If a trader wants to trade futures options, selling naked gives the ultimate amount of exposure for the least buying power. SPAN margin allows a trader to use a fairly small amount of capital to open a naked trade. And if a trader balances the Delta of both sides of a trade, buying power requirements become even less, as the total risk is considered in required capital.
SPAN margin also lets a trader have different sides of the trade be at different expirations and have the net exposure of each side be considered in the SPAN margin calculation. The point is that for the most agressive, risk-tolerant option trader, there is no higher leverage way to sell options than selling naked options on futures. For that reason, I really like futures for naked options.
Selling futures options naked still have the issue of poor liquidity and higher commissions, but the flexibility of SPAN margin finally makes it worth the cost for risk-tolerant traders. It is worth noting that the liquidity and commissions are significantly more of an issue for traders that trade “micro” versions of futures options, like /MES, compared to /ES. Whether it is a futures product on an stock index, a commodity, or a currency, the micro versions just have a lot less open interest and liquidity. So, if account size limits trades to micro futures, a trader has to watch which expirations and strikes can be entered and exited without huge price slippage, particularly when exiting early.
Despite the cost issues with futures options, selling naked futures is my favorite use of futures options, and my favorite way to sell options naked. I give it a green box on the matrix. I don’t rate it this way to suggest it is a safe trade, but that it is the ultimate use of options leverage.
Bonus sections
There are a few option strategies that don’t fit neatly into the four categories of risk that I think deserve a special mention because I talk about them in other parts of the site.
Bonus #1 Ratio Style Trades
Ratio style trades are a more complicated type of strategy where there is an unbalanced number of contracts sold vs bought- a lot of times a 2:1 ratio in some variation. If there are more contracts sold than bought, the trade becomes a level 3 naked trade, like the 1:1:1 or 1:1:2 put ratio trade that I discussed in other pages. But often, I use a level 2 defined risk version of the trade by adding long options to equal out the short options, usually creating a wide credit spread along with a narrow debit spread, like a broken wing butterfly (1:2:1), broken wing put condor (1:1:1:1), or 1:1:2:2 put ratio.
These trades are technically either a group of spreads (level 2), or a spread with a naked short option (level 3), but is there a difference in what underlyings are best for these kinds of trades because of the ratios and odd ways of managing these types of trades? The short answer is not really.
For level 2 defined risk ratio trades like butterflies, condors, and 1:1:2:2 trades, I like ETF and index options for their liquidity and reduced volatility. This is the same logic as with spread trades in general.
For level 3 naked versions of ratio trades where there are more short options than long, my preferred underlying is futures options due to the reduced buying power of SPAN margin. These trades tend to be fairly highly probability of profit, but with significant tail risk from black swan type events. SPAN margin considers this risk and allows a trader to use a fairly small amount of capital to enter this kind of trade. Anyone trading this way must consider the significant tail risk into their management strategy.
A trader can use ETF or index options for these naked ratio trades, but they consume a lot of capital with standard option margining. Traders with portfolio margin accounts might find this more acceptable. For understanding of different types of margin in options, see my post on the topic.
Bonus #2: 0 DTE trades
0 DTE trades have special considerations because of their short time frame. Let’s throw in 1 DTE and any options trade that has just a few days until expiration. All these trades focus on either last minute moves or the extreme decay that comes in the final days or hours of an option contract.
Individual stock options don’t have daily expirations, so expiration day trades are usually limited to Fridays or end of month at most. That essentially eliminates them as a candidate, but it gets worse.
With options near expiration, assignment at expiration or near expiration is a big concern. Individual stock options and ETFs in the money can be unexpectedly assigned into shares in the days before the options expire. And if options are held to the end of the expiration day, assignment can happen even if the market closes with options out of the money. A late after the market news event could trigger option holders to exercise their options on individual and ETF options, so you never know.
So, that leaves index and futures options. Index options are settled to cash at the market close. Futures options expire into futures contracts at the market close. A trader doesn’t have to worry about after market events impacting an expired position. The only exception to this is monthly index options that settle on the open of the market, but stop trading at the market close of the previous day. These contracts have AM expiration, where almost all other options expire in the PM, at the market close. The ticker symbols for index options expiring and settling at the market close generally end with a “W” for weekly, which originally was for the weekly expirations that happened every week, but now happen every day. The monthly options, which are the very original index options, don’t have a “W” at the end of their ticker indication.
Settling to cash vs settling to futures contracts or shares is a big difference. Most expiration day traders don’t want to deal with the underlying securities ending up in their account and the significant notional value that comes with them. Because of that, index options are far better choices for trades approaching expiration.
Traders with small accounts can choose between micro index options, like $XSP, micro futures options like /MES, or ETFs like SPY. They have different pros and cons. Micro index options have fairly poor liquidity with wide bid/ask spreads and big tick sizes for poor fills, but settle to cash at expiration. Micro futures options have worse liquidity and bid/ask spreads, plus high commissions, and settle to futures contracts, all negatives, but are usually half the notional size of the other two low capital choices. ETF options tend to have good liquidity, but settle to shares at expiration, or after expiration. None of these are ideal, but if a trader wants a small option stake on expiration day, these are the choices to consider.
Conclusion
So, there you have it. A fairly exhaustive analysis of the various combinations of trade types vs underlying security types. Some of the factors I consider most important in this analysis, may be less important to other traders, and some accounts at certain brokers may not even give a trader a choice to have some of these types of underlyings available. Others may not have some risk permissions available.
In any case, my hope is that whatever level of risk or underlyings a trader has available, it is clear what combinations make might more sense from a viewpoint of risk, potential reward, capital usage, and trading costs.
Most people have full time jobs. Can someone manage an options portfolio and work full-time without watching the market all day? I say yes.
Most people have full time jobs that don’t involve the financial markets. Can someone manage an options portfolio and work full-time without watching the market all day? I say yes, and they may do even better than a full time trader. The reasons may surprise you.
For several years I was a full time options trader, watching positions in a bunch of accounts, adjusting every day as the markets moved. Many of my positions were short duration, which meant that I needed to stay on top of them. Much of my strategy involved rolling to avoid getting to expiration or to keep my strikes out of the money. There were lots of good reasons to spend the day reviewing every position in every account to determine if any adjustments were needed. And I enjoyed it. It was fun managing accounts that were growing and generating the income I needed.
But in 2022, I had a series of events that drained my accounts that provided my spending money. (Separately, I’ve written about my lessons learned in 2022.) I’m not yet to the age where I can take money out of my retirement accounts without penalty, and I didn’t want to get into Substantially Equal Payment Plans (SEPP) to commit to withdrawls- that’s a big topic for another day in itself. The bear market coincided with some unexpected expenses, so I liquidated most of the liquid accounts I had available at bad times. My accounts that had been providing nice streams of income lost a lot of value when I needed them most. So as the year came to a close, it was clear I needed to get a “real” job again.
Changing to a full time “real” job
In January of 2023 I started working full-time, a typical 9-to-5 job. But I still had a number of accounts to manage, a combination of retirement accounts and leftovers from my cash/margin accounts that I hadn’t completely used up. (I didn’t go broke, I just wasn’t flush enough to live off my accounts that I could draw from.) I had to have a different approach to account management- the days of full-time trading were over.
I still wanted much of my portfolio to be option-based. I’ve seen how options give me leverage and the ability to manage in any type of environment. But I knew that my approach to managing daily had to dramatically change. I couldn’t watch the market and do my job, so I needed to completely change my trading routine.
First, I decided to stop all 1 DTE and 0 DTE trades. Honestly, these had not been that profitable and were the most time-consuming positions I had been trading. It was almost like I had been trading them to keep my day completely filled with activity. If you read about my 1 DTE Straddle management approach, you’ll see that I try to take profit and adjust positions throughout the day, which is very time-consuming. 0 DTE trades are just as time-consuming for most strategies. I know some traders open a position and set up stop and profit limit orders and go about their day, but even that seemed like more than I wanted to do. So, no more expiring option trades.
Next, I moved all my shorter duration trades out in time. I was doing some 7 DTE put spreads, rolling almost every day. These were problematic in the 2022 bear market anyway, so it wasn’t a hard decision to get rid of them. I also decided to mostly stop doing 21-day broken butterfly trades. This was a harder decision, as I’ve had good success with defending these even in tough times, but I knew that I just didn’t want that responsibility to keep an eye on them.
So, I was left with positions mostly 4-7 weeks from expiration- put spreads, iron condors, covered calls, covered strangles, some 1-1-2 ratios, and some long duration futures strangles. All these trades are far enough out in time that a move during the day won’t be a huge loss or need an immediate adjustment.
Initially I thought I’d try to spend a half hour each morning when the market opened before I started my job. For a few weeks I did this, but I found that my work often required me to be available for an early call during that time, or there were urgent items that couldn’t be delayed, and that time wasn’t available. I’d miss a day, then it was two or three in a row, and I realized I needed to be able to have an approach that could go several days at a time without requiring action. But, I also noticed that missing several days wasn’t hurting my market results, especially in a choppy market.
Since almost all my trades are based on profiting from premium decay, time is my friend. I need time to pass and the market to remain somewhat stable. Getting away from the daily noise of the market up for some reason one day and down the next for another reason helped remind me that selling options is about being patient. It also reminded me that market movements are mostly noise that is statically insignificant. If I don’t react to every move, the market tends to chop up and down and not really move that much or that fast over time, which is exactly what a seller of options needs.
My new routine
With time, I’ve settled into a trading routine of doing a thorough review of all my positions about once a week. For positions in the 4-7 week to expiration window, I like to roll and adjust Delta about once a week, essentially kicking the can down the road, trying to pick up a percent or two of return on capital each time. Timing isn’t critical, but I want to keep my spreads in the sweet spot where they decay the most, with short strike’s Deltas in the high teens to low twenties. I’ve written about this in many posts that address best Deltas for put spreads.or for rolling put spreads. I’m leaving a bit of money on the table, missing the very best timing, but I’m making up for that by not over trading, which I clearly was in 2022.
Some of my longer duration trades, that are 2-4 months out, can go weeks or even a month or more without an adjustment roll. My weekly checks just make sure that they are not getting close to being tested or getting to a duration that I want to extend. My philosophy with those positions is an “if it ain’t broke, don’t fix it” approach. So, not much to do with these.
So, it takes me about an hour a week to make adjustments during market hours. I find a break in my day, or a day when I can get trades in early before my work day starts. I’ve been surprised at how manageable it all is. I’ve realized that when the day comes that I don’t need a job anymore, I will be able to manage my trades with a lot less time than I was using the last several years. I don’t plan to ever trade all day long again.
Results
The great news is that I’m very happy with my results. My most aggressive accounts have been pulling in about 10% returns each month so far in 2023, and all my accounts are handily beating the market. So, I’m very happy with my new approach. I know that the market isn’t always this calm, but I also know from 2022’s bear market that longer duration trades in high volatility have much better outcomes than short duration trades, so I’m confident that this approach would have done well in that environment, better than I did trading every day with short duration trades.
A covered strangle? It’s a conservative three component trade made up of long stock and selling both a put and a call out of the money.
What’s a covered strangle? It’s a three component trade made up of long stock, selling an out of the money call, and selling an out of the money put. It’s a high probability trade that is less volatile than owning all stock, but uses a lot of capital keeping returns somewhat limited. It’s a great way to ease into strangles, which typically are reserved for very experienced traders. It can be traded in almost any account because it only requires Level 0 option permission approval, so most retirement accounts will even allow it.
A covered strangle is bullish, making money when prices go up.
Technically, a covered strangle is a combination of a covered call and cash secured put, two strategies that are a favorite of many conservative option traders. It’s “covered” by stock on the call side and cash on the put side. Let’s say we have 100 shares of the SPY ETF trading at $400 per share, a value of $40,000. We can likely sell a 420 strike call a month out for about $2.00 premium or $200 total for the 100 share contract. If we have another $38,000 cash in our account, we can sell a 380 strike put for around $4.00 premium or $400 for the contract. We’ll likely collect a little around 1.5% of our capital at risk. We have $40,000 in stock and $38,000 in cash securing our strangle. We can hold to expiration and let the chips fall where they may, or my preference of managing early and rolling out for more credit.
A trading friend has been talking up covered strangles to me for years. Honestly, I’ve looked past it as it seemed like a boring trade that takes a lot of capital for a somewhat small return. At first glance, there’s limited upside because gains are capped by the call, and unlimited (to zero) downside. If the stock price goes up, the call can be triggered and the stock sold for the call strike price. If the stock price goes down, the stock and the put both lose value. And we are doing this for a 1.5% return on capital? And this is supposed to be a good conservative trade? Actually, yes! Let’s dig a little deeper and see why.
Probabilities, Volatility and Manageability
There are three major factors that make this trade desirable. First, there is a better than 50% probability that this trade will deliver a profit. Second, this position is significantly less volatile than being fully invested in stock. And finally, strangles are one of the most forgiving trades to manage, allowing continual repositioning, or a variety of other trade variations if held until expiration or assignment. As a bonus benefit, we are invested in stock, often with dividends, and over time the market tends to go up for a gain. Let’s review each benefit in detail.
Probabilities of Profit
If we look at our example trade mentioned earlier, let’s assume that we are selling a 20 Delta put and a 20 Delta call. We can quickly see that if held to expiration, there’s a 40% chance of one of the options expiring in the money- 20% for the call, and 20% for the put. If the concept of Delta matching percentages is new to you, refer to my webpage on Delta. But even if an option ends up in the money, it doesn’t mean the trade loses. We can look at it from just the stock, just the strangle,or the full covered strangle.
The stock itself is a slightly better than 50/50 proposition. On average, we expect to see a bit better than 0.5% return per month. But that’s on average. Our expected move for a month tends to average about 4%. (See the page on Expected Move if this is a new concept.) So, a lot of up months and a lot of down months, but we also expect the stock to stay inside the strike prices of the options sold. Historically, our monthly probability of profit is between 55 and 60%. Individual stocks may have somewhat different probabilities than indexes, but most are in this range.
This chart illustrates the profit contribution of the strangle components and the 100 share components. For contrast 200 shares profit is also shown. Notice that only the strangle profit changes with time passing- the shares profit only based on price changes.
The strangle of a short put and short call have well defined probabilities. While the probabilities of ending in of the money are 40% at expiration, we also have to consider that we have collected premium that gives us an additional cushion before we actually lose money. In our example, we have collected $6 premium and have strikes $20 away from the current price. We don’t lose money at expiration until the stock price ends up over $26 away from our starting price. A quick check of options Deltas will show that we have about a combined 25% probability to expire over 26 points away from our starting price, so we have a 75% probability of at least some profit from the strangle. If we manage early, we can improve this probability to an even higher rate, reducing the possibility of an outsized move blowing through our strikes.
If we do some basic math, the average probability of the stock and strangle would be a little better than 65%, based on our probabilities of each part of the trade. But there’s a little more subtlety to probabilities of the covered strangle, due to the interaction of options and stock. On the upside, we could be assigned and have our stock called away if the market goes up more than 5%. We’d make $2000 on our stock plus keep the $600 option premium we collected, a $2600 profit on $78,000 capital, a 3.3% return. No matter how high the stock goes, our gain is capped at 3.3%. On the downside, our stock starts losing money immediately, but we still have our $6 premium collection that buffers our total position down from $400 to $394 before the covered strangle is at a loss at expiration. The put doesn’t add to the loss at expiration until it is in the money, but below that both the stock and the put lose equal amounts as the price declines. If we check the option table, we have somewhere around a 38% probability of our stock expiring more than $6 below our start price, so actually we have a 62% probability of profit for the full covered strangle.
If it wasn’t already clear, the covered strangle is a bullish trade. Up moves are always profitable, and the only way to lose is a market decline more than the total premium collected. That shouldn’t be a surprise, owning stock is bullish, a strangle is neutral, and the combo covered strangle is still bullish.
We’ve discussed in other posts that Delta actually overestimates moves and that probabilities are actually higher for profit, especially on the put side of the trade as put buyers buy up insurance to protect from big moves down. Since our risk is to the downside, our probabilities actually are a little better than Delta might suggest.
From this discussion, you can see that there are a number of ways to think about probabilities with a covered strangle. The takeaway should be that probability of profit is high. In a bit, we’ll talk about how management can help improve our odds even more. But first, let’s talk about how a covered strangle reduces portfolio volatility.
Portfolio Volatility Reduction
It should be somewhat obvious that when we combine a pure bullish strategy of owning stock with a neutral strategy of a strangle, we have a combined strategy that is somewhere in between. Let’s compare a covered strangle to being fully invested in stock.
Comparing the profit and loss of a covered strangle to 100 shares or 200 shares of stock shows more profit if price doesn’t move much and less change with price overall. The only time that being fully invested in stock outperforms is when there is a large move up.
Using Delta to represent equivalent stock (another way Delta can be used), 200 shares of stock has a 200 Delta value. A fully neutral strangle paired with 100 shares of stock has 100 Delta value. Both positions use the same capital, but the all stock position will move up and down twice as much day to day as the covered strangle. Delta will vary from neutral as the underlying price changes, reducing with price increases and increasing as prices go down. So, position volatility will go up if the underlying price declines, and vice versa. It should also be clear that the strangle and the stock behave differently, and that difference diversifies the price response of the covered strangle.
You might think that with a decrease in position volatility, we would be giving up a lot of potential return. But actually, we can expect as much as 0.5% average return per month from the strangle, about the same as the stock. But since one side of the covered strangle is likely to do better in each point in the trade, returns are likely to be more consistent than either by itself.
Managing Strangles
Of all option trades, strangles are about the most manageable of all strategies. Both the short put and short call can almost always roll out in time for a credit, whether the strike is in or out of the money. With spread type options, only out of the money strikes can collect credits from a roll. For single short options, there is no long strikes to buy back.
The Strangle portion of the Covered Strangle is profitable at expiration when prices stays inside the expected move.
I like to use rolls to recenter my strikes around the latest prices. Going back to our example, if the underlying price went down to 390 after a couple of weeks, we should be able to roll our strikes out a few weeks more with 370 put and 410 call, and collect a credit. The idea is to use rolls out to just keep collecting credit. Compared to rolling spreads and iron condors, there’s way more forgiveness, and more likely profit even in moves that test the strike prices of either option. Sometimes, I may pay a debit on the tested side to move the strikes well out of the money, and collect a bigger credit on the untested side and move the strikes closer to the money when they are very far away. Even if my strangle position is showing a loss, I can usually still collect a credit and keep the trade alive and let time decay the increased premium.
My goal is to consistently collect credit from rolling the strangle as the underlying stock goes up and down. Using SPY at around $400 a share, I’ve recently found I can roll out weekly from around 25 DTE to 32 DTE and collect a $2 premium net credit, or about 0.5% of my cash secured capital. A year of that would be 25% return, which would make most conservative traders very happy. I can’t do that every week because sometimes a big move sends my positions into a tested area where I need to adjust strikes to recenter and the net credit is smaller.
Many traders don’t mind the assignment either way and happily wheel between covered calls and cash secured puts, but I like to try to keep both options of the strangle in this situation if I have the capital available to support a position. The strategies aren’t that different, but with a covered strangle, I can adjust easily no matter which way the market goes, and not have to buy and sell my shares of stock.
Assignment due to dividends is a possibility, which I find as a minor annoyance, but actually manageable. Remember that the calls are covered, so worst case when a stock goes ex-dividend and is close to being in the money, it will get called away. Then, a trader can use the wheel strategy and sell a put to get the shares assigned back. I avoid this by adjusting strikes so my calls are far enough out of the money that it never makes sense for an assignment to occur. I also don’t hold options that are near expiration and most likely to get assigned, especially at dividend time. But again, since the calls are covered, there is no real risk, just the selling of shares for a profit.
Level 0 Strangle?
Brokers have different levels of option trading permissions. I’ve written about this in my pages on different levels of risk and comparing risk. Level 0 is the lowest level of risk and easiest for a trader to be permitted. Most brokers consider covered trades as Level 0, although some brokers may have a different name for it. The reason most consider this option permission level as zero is because it is actually less risky than holding the same amount of stock, whether the position is a covered call, a cash secured put, or a covered strangle. That means less risk for the broker and for the trader. This makes covered option trades a favorite of conservative traders.
Since we are talking about strangles, how different is the risk of a covered strangle from a margined and naked Level 3 strangle, or a futures option naked strangle? The big difference is that there is nothing covering the risk in either direction with higher risk levels of strangles. There is absolutely no limit to the risk to the upside. Prices can keep going up, and a naked short call keeps losing no matter how high prices go. On the downside, most brokers only require around 20% of the capital at risk for a trade to be executed. So losses can greatly exceed the initial capital in a big downturn. In contrast, a cash secured put can’t lose more than the cash required at the start of the trades, because 100% of the value of the stock that would be assigned at the strike price has to be in the account. The highest strangle risk is from using naked futures options which utilize SPAN margin, and even less capital required, which also means even more potential for crazy losses if the market gets out of hand.
Because Level 0 covered strangles have several times less risk than naked Level 3 strangles, they provide a great way to get used to trading strangles. Traders can get familiar with the mechanics of strangles without the risk of naked positions. And covered strangles are still a viable way to make a return on investment that often beats the market, particularly in flat and down years.
I’ve written about different types of underlying securities, but covered strategies including covered strangles can only use stocks or ETFs, because a trader can’t own an index. Stocks and ETF are familiar to most all traders, and many aren’t even aware of index or futures options, so covered strangles mean nothing new to learn.
Probably the biggest issue for trading covered strangles is the amount of capital required. For my favorite ETF underlying, SPY, trading at $400 a share, the shares alone are $40,000 and selling a cash secured put ties up approximately another $40,000. So, for the smallest 1 contract increment of a covered strangle, a trader needs $80,000. For many traders, this is out of reach. A low priced stock might be more of a practical choice, so Ford Motor (F) trading recently at around $12 a share needs about $2,400 to get a covered strangle going.
Because individual stocks typically have more implied volatility than ETFs, there is more premium to collect, making individual stocks good candidates for covered strangles. Since the trade is covered and risk is slightly less than owning stock outright, it can be argued that covered strategies are best used with individual stock. Assignment is more likely in individual stocks because outsized moves are more likely, but the position is covered by cash and stock, so assignment is just a feature of holding a covered strangle. For traders who haven’t experienced assignment on a naked position or spread, assignment on a covered position is a much less stressful way to be introduced to the concept.
It may appear that I’m portraying the covered strangle as a beginner option strategy, but it is really a sophisticated method of reducing risk. Most people are scared of options because they are considered risky. The covered strangle is one strategy that uses options to reduce risk compared to owning equivalent shares of stock. Many conservative investors utilize covered strategies, not to speculate, but to lessen the volatility of their returns. Most financial planners will give you a deer-in-the-headlights look if you ask about this strategy even though it reduces risk and should be a common tactic. But most financial professionals are completely unaware of ways to use options to reduce risk. So for that reason alone, don’t ever think of covered option strategies, including the covered strangle, as a beginner strategy. I think of it more of a way to be fully invested and sleep better at night strategy.
Many people are buying and selling options with zero days to expiration (0 DTE in option lingo). But is this a good idea? Are there strategies that actually work? Or is this just gambling? Well, like many things in options, it depends. There are strategies that have been successful with years of history, and we’ll dig in to discuss them.
In 2022, the option exchanges rolled out options on a few indexes that expire every day of the trading week. This has caused a frenzy of option trading by individuals who are trading a variety of expiration day strategies every day. Many people are buying and selling options with zero days to expiration (0 DTE in option lingo). But is this a good idea? Are there strategies that actually work? Or is this just gambling? Well, like many things in options, it depends. There are strategies that have been successful with years of history, and we’ll dig in to discuss them.
Over the past several years, the frequency of option expirations has increased dramatically, particularly for the major indexes, the S&P 500, the Nasdaq 100, and the Russell 2000. Initially, there were only monthly expirations that expired on the third Friday of the month. Options expiring every Friday were added several years ago, and Monday and Wednesday were added a few years back, and finally in 2022, Tuesday and Thursday expirations were added. Trading volume has grown exponentially, and trading on options expiring within the next few days are now the majority of option trades. Clearly, expiration day trading is very popular.
I’ve been exploring trading strategies for expiration day for several years, going back to when we started having expirations available for Monday, Wednesday, and Friday. I’ve discovered that 0 DTE is not for everyone, can have many elements of gambling for many, but has a few strategies that have a positive expectancy of profit.
Things to know about 0 DTE
First off, 0 DTE requires a different mindset than longer duration trading. Profits and losses explode in minutes, making the importance of having a plan critical. Options in general require strategies and planning, but 0 DTE is significantly more volatile. So, for traders that can’t handle huge swings in value over very short periods, 0 DTE may not be a good place to go.
For traders that do trade 0 DTE, I highly recommend keeping a log of all trades to be able to evaluate whether the strategy being used is actually working. Some trades have fairly high win rates, but have big losses when they lose- a log will help a trader determine if the wins outweigh the losses over the long run. Also, keeping note of what went well and what went wrong will help a trader learn from success and failure. I can tell you that most traders that fail do so by not sticking to their own rules for managing risk.
One key consideration is the Pattern Day Trade Rule that applies to accounts with less than $25,000. Federal regulations prevent small accounts from opening and closing the same position the same day more than three times in any 7 day period. Doing so will place severe limits on the traders account. If you have an account with $25,000 or less, or even just slightly more, you need to be very aware of this rule and how it works before even thinking about 0 DTE trading or any short duration in and out trading strategies.
There are a number of ways to trade 0 DTE. Some traders try to get in and out, while others hold a trade to expiration at the close of the day. Some are net buyers of options, what I will call debit trades, while other are net sellers, or credit traders. I say “net” because many strategies involve trading spreads, buying one option and selling another, generally the more expensive being hedged, protected, or partially financed by the cheaper option.
When options are expiring at the end of the trading day, all the characteristics of options are sped up. From a data driven standpoint, there are three key Greeks to consider. The two most obvious are Theta and Gamma which essentially battle it out for the day. But Vega also plays a key role, as big moves spike up Implied Volatility and option’s premium, and calmness can sap premium almost as fast. With hours or even minutes until the options expire, the Greeks’ calculations stop meaning as much as the concepts behind them.
Options sellers are banking on Theta eating away the premium as the day progresses. If the option ends out of the money at the end of the day, it is worthless. On the other hand, Delta will end the day at either 100 or zero and is likely to swing huge amounts during the day, which is the measure of Gamma, the change of Delta. So option buyers are looking for options to get in the money and run way up in value.
Since we are talking about expiration, it is important to understand the implications, which vary depending on what underlying the option is based on. Remember, there are four types of underlying securities, and at expiration the differences really stand out when an option expires in the money. For stock and ETF options, in the money options are settled with shares, which may not be the best outcome for day trading. In addition, while expiration option trading ends at the closing bell, expired stock and ETF options can be exercised until midnight, so even options that end trading out of the money still might be exercised if market conditions change after hours from news or earnings impact. Index options are much more straightforward. Index options are cash settled based on the price of the index at the closing bell. Because of this, index options, like SPX, are generally the preferred trading vehicle for traders holding options through the closing bell. Futures options settle with futures contracts unless the futures contract is also expiring the same day. However, futures options are assigned based on the price at the closing bell, not any after hours moves, so a trader knows at the bell whether there will be an assignment or not. So switching between underlying types for 0 DTE trades in not a trivial decision.
As mentioned before, because 0 DTE trades can rapidly change in value, having a mechanical trading plan becomes critical for consistent success. Most traders that trade short/selling strategies use stop losses to keep losses from getting out of hand, and long/buying strategies use some type of trailing stops or rolls to protect winning positions and keep upside unlimited. There are a few trades where holding to expiration (no matter what happens) could be considered, but I think 0 DTE are best managed by active trading based on market action.
So let’s get to it. Let’s discuss some typical strategies, both from the long and short side, considering what it takes to be successful.
Selling options with 0 DTE
Most 0 DTE option sellers I know actually sell spreads to define risk. Selling naked options on expiration day simply requires too much capital and carries too much risk for the average trader. The width of the spread can vary based on the strategy or capital available to the trader, but wider spreads tend to decay faster than narrower spreads. These trades are expected to win a high probability of the time, but to avoid severe losses, stop losses are also critical parts of the strategy.
While there are many variations of these strategies- different times to enter and exit, trading one side or both sides (puts and/or calls), entering or exiting all at once or legging in based on the market, the core of the strategy is the same. Sellers want to sell at a relatively high premium and buy it back for less or even let it expire worthless. I’m going to focus in on two common strategies that I have had success with and 0 DTE trading friends have done successfully- a wide Iron Condor and an Iron Fly. For discussion, let’s assume that we are selling spreads directly on the S&P 500 Index, ticker symbol SPX.
0 DTE Iron Condor
Iron Condors on expiration day seem to perform best way out of the money, selling options with 10 Delta or less and buying 30 to 100 points further out of the money. Greek calculations for 0 DTE can be flaky and vary widely, so many traders are more comfortable choosing strikes based on the premium available. For example, a trader may sell the lowest put strike that sells for over $1.00 or maybe over $1.50, and buy the put that sells for under $0.75 or $0.50. For perspective, you can estimate the expected move at any time in the day by adding the premium of the at the money put and at the money call. Generally, these strikes are between 1.5 and 2 times the expected move for the put being sold and another half expected move further for the put being bought as a hedge. So, it’s highly likely that the strikes will expire worthless.
Similarly, we do the same thing on the call side, selling a call and buying a higher strike call for less. If we choose similar Delta values, the premium for each call will be less, but the difference in premium may actually be more if we have the same width wings. It is a matter of preference as to whether to try to collect as much on the call side as the put side.
The risk vs reward for this set-up is the net premium difference between what was sold and what was bought and the difference between strikes. For example, if we sell a put for $1.50 and buy a put at a strike price 40 points lower for $0.70, we are risking 40 to make 0.80. Then, if our calls were sold for $1.20 and bought for $0.40, we have another 0.80 on another 35 wide spread. So in total we have 1.60, but still only 40 risk because the options can’t expire in the money on both sides. Actually, because the options are for a multiplier of 100, we risk $4000 to make $160. So, if all goes well, we make a 4% return on the capital needed in one day. Some traders sell slightly closer strikes to try to collect more premium, and others sell for less to improve probabilities.
While probabilities are fairly high that the strikes will end up out of the money, we never know for sure, so we have to protect our capital. Most traders I know use a 2x stop loss on each side. They limit their loss to twice the premium they collected on each side. So, if a put was sold for $1.50, losses are limited to $3.00 by entering a stop loss on the short put at $4.50. While a stop can be entered for the price of the spread, it isn’t recommended because during the day prices can vary in weird ways and stops can trigger on spreads when the price hasn’t really moved much. I’ve read numerous posts of traders who were frustrated by a stop that was executed when there position was in no danger because of a rogue quote. If possible, it’s best to have the stop trigger based on the bid price of the option if your broker allows it- for the same reason- to avoid bad quotes triggering a stop.
It can be frustrating when a stop triggers just as the underlying price hits the high or low of the day and reverses. A trader looks at this and thinks, “Gee, if I wouldn’t have triggered the stop, my option would have expired worthless. I took a 2x loss when I could have had a gain.” Unfortunately, a trader never knows when the price will reverse and when it will keep going. The goal is to stop our loss at 2x and not let it get to 10x or 20x. We can recover from small losses, losing all the capital of a spread trade can be devastating.
The Iron Condor is a 4 legged trade, so if one leg is stopped out, we still have three legs. On the side where the stop occurred, the long position will have gained value, although not as much as the short strike lost. We can hold the long strike in the event that price keeps moving, making the long strike more valuable. However, since the strike is likely still well out of the money, it is likely to expire worthless and probably is best to be closed out soon after the short strike stop occurs.
When we are stopped out on one side, it is even more likely that the opposite side will expire worthless. However, there is a small possibility that price action could reverse and move far enough to stop out the other side as well. For that reason, some traders will close out one side if the net premium has decayed 80 or 90% of the way while there is still a lot of time left in the day. The choice is take risk off the table, or hold out for that highly probable last 0.25%. Again, it’s personal preference.
So, let’s look at the various potential outcomes of our $1.60 Iron Condor: 1. most likely (~70%) both sides expire worthless $1.60 profit 2. sometimes (~25%) one side is stopped out and the other expires worthless ($3.00 loss on short stop, $0.20 gain on long, $0.80 profit on other side) $2.00 loss 3. rarely (~5%) both sides stopped out, assume no net gains from long strikes so $6.00 loss ($3.00 each side) Adding all the probabilities together, we get an average return of 0.33 profit, or $33 on our $4000 capital. That’s just under 1% per day.
Can some traders do better? Yes, there are lots of variations that some traders believe give them a better advantage. But lots of traders do worse. Why? Because managing trades while sticking to a plan isn’t easy for most traders.
How can the trade be varied? Some traders enter the trade at different times in the day. They may enter at market open and again a few hours into the day. They may open on just one side based on technical indicators predicting movement in a certain direction. They may add based on one side based on market movement. They may have plans to add new positions when an old one is stopped out. Which variations work and which ones don’t? The probabilities are essentially the same but can be tweaked by collecting a little more or less in each trade.
Some may wonder why we wouldn’t just look at stopping out the whole Iron Condor when it loses twice the premium collected instead of managing each side separately. While it could be done that way, the challenge is that each of the legs of the trade are very dynamic in their values and the relationship between them changes dramatically during the course of the day. If the trade is opened early in the day, it is likely that by the final hour of the day only one position will have any meaningful value. Also, managing puts and calls separately allows traders to add and take away positions on either side independent of how they treat the other side.
On an ideal day for this trade where the market doesn’t move much after the Iron Condor position is opened, all the legs will decay proportionately and have little value left by the afternoon period a few hours before expiration. This is because expectations of the remaining move for the day will decrease and the price distance that was 1.5 times the expected move will become 3 to 4 times the remaining expected move. Since the probabilities are exponentially smaller of being tested, the premiums simply evaporate. One doesn’t have to wait to the very end to see the result.
Other days Iron Condor traders may see the price creep around moving toward one of their short strikes. Big moves early in the day can quickly lead to executing a stop, but the nerve-wracking position is the one is close to stopping out all day as the price moves ever closer to a strike price but not close enough to trigger a stop. For some traders this is stressful, for others fascinating. To avoid stress, many traders set their stops and go on about their day knowing that the market will decide whether the trade wins or loses.
Iron Fly 0 DTE trades
A completely different approach to capturing decay on expiration day is selling an Iron Butterfly or Iron Fly as it is more commonly called. The Iron Fly is created by selling an at the money call and an at the money put and buying protective wings outside the expected move of the day. The trade simulates a straddle, but defines the risk as the width of the wings to keep buying power reasonable. Most traders try to open these trades soon after the market opens and get out fairly soon, taking advantage of early morning premium decay as the market settles in.
As discussed earlier, the at the money put and call premium imply an expected move for the remainder of the life of the option. How big the expectation is varies from day to day. For example, on days when the Federal Reserve announces interest rate policy, the expected move is much higher than other days. Other anticipated news events can also trigger uncertainty about pricing changes to expect later in the day, driving premium higher. Other days, little news is expected and low premiums reflect that. So setting up this trade requires a review of prices to pick wing strikes that are appropriate.
Generally, most traders look for Iron Fly wings that are 1.5 to 2 times the implied or expected move. For example, if the total premium of the at the money put and call is $30, one might choose to buy puts and calls $50 away from the money. These should be fairly cheap compared to the at the money strikes. The idea is that there isn’t much decay left, these long options are simply protection from a sudden outsized move. An alternative is to use a set price for one or both of the longs, like $1 for the long call and buying the equidistant long put, which may cost slightly more due to pricing skew.
The most common management strategy I’ve seen for this trade is to set a win target and an offsetting stop loss, and let the odds play out. Iron Fly sellers pick either a percentage target or a dollar target for profit and typically set the stop loss at twice the win target. For example, one trader may target a profit of 5% of the premium, while another may target $1.50 profit every day. There’s logic for either approach, big values may hold value until the news event that is expected to move price, while low values may decay slowly. The key is that the bigger the target, the longer a trader is in the trade.
Why not go for it all and let the position expire? First of all, one short strike will definitely be in the money at expiration while the other short strike will be worthless. The day to day variation in results would be huge, perhaps making 50% return one day and losing 140% the next day. In addition, most studies I’ve seen on this approach suggest that this is a net losing trade over time.
The idea of getting in and getting out is that there are periods of time during the day, primarily at the open, when the level of uncertainty drops significantly in a matter of minutes or a few hours. Even with price movement, expected moves drop faster and the premium of the Iron Fly decays for a win.
In practice, the Iron Fly can tolerate a move of a few strikes up or down initially without stopping out. Early in the day the market often moves around searching for a price to stabilize on. The Iron Fly seller expects that movement to be small enough most days that a stop isn’t triggered and the settling price is close enough to the price where the trade started that the profit target can be achieved.
Setting a stop order or profit limit order is trickier with an Iron Fly than with the Iron Condor. The issue is that with the Iron Fly, a price move of the underlying generally impacts three of the four legs. One short goes into the money and the long on that side starts increasing in value, while the other short starts decreasing in value. The long on the untested side goes from low value to nearly worthless and isn’t a factor. A set and forget stop strategy would be to set a stop for the whole four legs, but triggers and fills can be inconsistent. Another approach is to watch the direction of price and set a stop for the three legs that are most impacted. Another is to set a mental stop and manually close if the price goes beyond your mental stop.
For example, let’s say we open an Iron Fly for $30 credit and target $1.50 profit. We can enter a limit buy to close order to buy the whole position back for $28.50. We could alternatively place a stop loss order at $33. Some brokers allow a bracket order that combines the two orders into one for a situation like this. If we want to watch and mentally manage the order, we may choose to only close the three legs that have meaningful value.
Time in the trade can vary from minutes to hours. Some days the price sticks right where the Iron Fly was sold and the price decays in 5-10 minutes. Other days, the price may grind away varying premium between the profit and stop targets for hours. Many traders set a time limit- if the trade doesn’t hit a stop or profit target in 2 hours, close it and move on.
Time to enter is a bit of a personal preference as well. Some traders try to enter within seconds of the market open when there is the absolute most premium available. Others wait five to fifteen minutes for the initial big move to stop. Some do just one of these trades a day, while others open several at different points in the day. Some avoid Federal Reserve days while others embrace them. There are advantages and disadvantages to each way of entering, but often it comes down to comfort of the trader with a chosen approach, the probabilities are similar.
Over time, the math is fairly simple with this trade. We need to win more than twice as often as we lose. The studies I’ve seen show this as a net winner. The other key is stay mechanical and respect identified stop values. Most people who fail at this trade do so by getting sloppy with their stops and hoping for prices to reverse while the loss multiplies. Discipline can’t be overstated.
Long Strategies for 0 DTE
Buying an option on expiration day requires a strategy that can overcome the rapid time decay of the option purchased. Since there are huge volumes being bought each day, there must be some validity to this approach.
Buy 0 DTE Straddle
One simple approach is to buy a straddle and hope for an outsized move. This is essentially the strategy discussed in the post on the 1 DTE Straddle I’ve written about separately, just done on expiration day. The difference is that at 1 DTE, there is overnight movement that may impact pricing, while once the 0 DTE trading day has started, we only have the day’s price movement to consider.
This strategy is essentially the opposite of the Iron Fly strategy and counts on movement of price to exceed time decay. Since risk is limited to the premium paid, there isn’t much value in selling wings, which would limit the upside of any move.
When would one open a 0 DTE straddle? Perhaps right at the open, looking to capture a big early morning move. Or just before a big announcement, like the Federal Reserve interest rate announcement or press conference. Or maybe at a point in the day where there is time left but the straddle is just very cheap and a small move will make it profitable.
The biggest challenge is deciding when to get out both for winning and losing positions. The position won’t expire worthless, so should there be a stop loss? When a position wins, when is the profit enough to justify the strategy over time? Since the trade has theoretical unlimited profit, shouldn’t we preserve that potential? Tough choices, so thinking through a plan ahead of time for the situation is critical.
My go-to plan is usually to roll in the money puts toward the current strike price when I can collect a significant percentage of the roll distance. Early in the day, I might roll my strikes $10 when I can collect $7. Later in the day I may do it if I can collect $8. The idea is to take some of my winnings off the table while allowing for additional movement to make more. I protect myself from a reversal wiping out my profit. I find this approach reduces the volatility of my win and loss amounts.
Jump on the Trend with a Long Option
Many traders like to use Technical Analysis to predict future movements of the market. They detect when a trend in one direction is starting and determine how long they expect it to last. A great way to take advantage is to buy a call when the market is trending up and sell it at the top before it has time to decay, or buy a put on a downtrend and sell it at the bottom.
Generally, the idea is to get in opportunistically and get out. Time is ticking against the option buyer on expiration day, so the buyer has to be right on direction and right on timing. If the trend is small or slow moving, premium will decay faster than the underlying price can increase it.
A typical strategy on an uptrend is to buy a call a few strikes out of the money. For SPX, this might cost $10 premium or $1000 for the contract. The Delta value might be 30, so that a $10 price move would net $300.
If the strike ends up in the money and is above 50 Delta, a roll to a higher strike should net at least half the distance of the roll. For example, one might roll up $10 for a $5 credit. Or wait to get further in the money where a roll up could net a higher percentage. Or just close the trade when technical analysis says that the move is approaching the top of the range.
The same basic strategy would work with puts on a downtrend. In either case, the market needs to move decidedly in the buyers favor for there to be a profit.
Time of day impacts premium pricing as well. Early in the day there is obviously more premium than late in the day. Buys earlier in the day can follow long all-day trends and make up for the high premium to get in. Late day buys can pay off quickly with a fairly small move in the direction of the trade. A trader has to be aware of the time left and manage accordingly.
The Binary Event
Often, the option premium and price movement of a day is greatly influenced by a single scheduled event. A piece of news, like an economic report, or a Federal Reserve rate announcement is often anticipated by the market with high option premium before the event and much lower premium after. These events are referred to as “binary,” in other words true or false, 1 or 0, good or bad. The impact of these events really have three outcomes for option traders- the market goes up, the market goes down, or the market basically doesn’t move. A trader doesn’t really know what the market will do, so how can we play one of these events.
A starting point might be to look at how much premium is elevated. Sometimes the market is expecting a big impact and sometimes a small one, and it often pays to be contrarian in regards to expected impact. How do we know if the premium is high or low? It takes only a few weeks of watching premium prices to grasp whether premium is higher or lower than normal, and if the high premium for a binary event is extra high, or actually a bargain. If premium is lower than normal, it might be a good time to buy options, either a straddle, or an out of the money call or put in the direction that the market is most susceptible to a big move. If premium is extra high, selling an Iron Fly or Iron Condor might make more sense.
Binary events tend to behave in crazy ways. When the initial news comes out the market may rocket in one direction for a few minutes and then reverse back to where it started or even switch from a big move in one direction to another. Most market observers explain this by noting that the very first reaction is from robot traders that look for certain numbers or words in a statement and interpret them as bullish or bearish, triggering large buys or sells. Then a combination of cooler heads prevail, as the market digests the information and puts things in context. After a while, the market decides whether to take the event as a positive, negative or neutral for the near-term future.
I know many traders avoid binary events because of the unpredictability of market behavior. There simply isn’t a built in probability advantage to any specific trade, and big losses are a distinct possibility. For traders that do like these trades, a plan for managing the trade is critical, when to get in, and a plan to hold, fold, or roll depending on the behavior of the market.
Conclusion
0 DTE trades are extremely popular now that they are available every trading day. However, that doesn’t mean that they are an easy way to make money. In many ways, they are the closest option trade to gambling that there is available. Gaining an edge requires developing and following a plan that accounts for both the potential movement of the market and decay of options. For traders that regularly trade 0 DTE options, it is critical to track all trades to make sure that the strategies used actually average a positive return over time.
I’m actually not a big fan of 0 DTE. For me it is too much drama with too little edge. The rest of this site is dedicated to other strategies that I prefer. But for traders that have the wits and discipline to trade 0 DTE, all I can say is “best wishes!”
In 2022 I had a rough year in many ways, but also had many successes, and need to take away some lessons from it.
Moving into a new year, it is always good to review trading in the past year to see what can be learned. 2022 is no exception. I had a rough year in many ways, but also had many successes, and need to take away some lessons from it.
Overview
2022 was a bear market year. Coming into the year, I was trading some very aggressive, short-duration bullish options positions, despite lots of warnings of troubles on the horizon. This resulted in a big loss in January and February, until I adjusted to a more neutral approach. However, I got away from many core philosophies and still didn’t recover as well as I could have.
What didn’t work and why
My biggest losses came from three main strategic mistakes, one that was new to me, and two that I should have know better. The new one was selling short duration without an appropriate exit strategy. The old should have known better losers were trading options on individual stocks and selling calls too close to the money.
Short duration trades
In 2021 I rode the bull market with a trade that was perfect for an almost straight up market, the 7 DTE rolling put spread. I’ve written about it, and you can read about how great it worked. However, when the S&P 500 went down over 400 points in a month at the beginning of 2022, there was no defense with the strategy of rolling. Because I had so much success with selling 7 DTE put spreads, I was reluctant to admit that the strategy wouldn’t work. I wasn’t prepared for a move down that didn’t bounce back. We had plenty of warning that the Federal Reserve was going to stop pumping money into the economy and instead raise interest rates and reduce the money supply. But, I left myself exposed with lots of short duration put spreads as the year began.
I tried to fight the down moves with rolls and a variety of other tricks I’ve used over the years, but there really was no defense for short puts close to expiration in a plummeting market. As I’ve come to learn, in down markets puts can be underpriced for the risk, and short duration puts can actually be a good buy. The book “The Second Leg Down: Strategies for Profiting after a Market Sell-Off” by Hari Krishman details a number of studies to back this up.
I’ve heard from a number of people that they had success with short duration options even in 2022 by going a little further away from the current price and either holding or using stop losses to keep losses from getting too big. But, I didn’t do that. Later in the year I tried to get back into selling some short duration options and got burned again. My style of rolling is just not a good fit for short duration options.
So, as expiration approaches, there is a lot of time decay that is very tempting to take advantage of. The flip side is that to get that decay, options must be sold quite close to the current price making them susceptible to a sharp move. Short term move of several times the expected move are not uncommon, especially in a bear market. For me, the returns are not worth the risk. My temperament is just not set up for this kind of trade.
More time gives more forgiveness. Looking to reduce risk from short duration options, I’ve focused studying ways to get the most out of longer duration options. I’ve done additional research on optimal Delta for selling put spreads at different time durations to maximize Theta. I’ve also gotten back to waiting for down days to sell bullish put strategies.
The only short duration trade I’m currently doing is an opposite trade to most of my other strategies. I’m buying 1 DTE straddles, as I’ve written about in a previous post. So far, so good with that.
Selling Calls too Close to the Money
Even in a bear market, selling calls can be painful. In a bear market there are often large counter-trend rallies where calls with strike prices close to the money quickly end up in the money. Implied volatility on index options is almost always significant skewed to the downside, making calls cheaper than puts. Selling the lesser call premium tends to not be adequate for the risk of a big rally. When I combine selling calls close to the money and with fairly short duration, I set myself up to be whip-sawed back and forth, reacting to each move in ways that locks in losses each way.
Ideally, I want to have positions outside of the market moves, far enough away in time and price distance that day to day price changes have little impact on me and I can just wait for time decay to work my option prices down over time. Puts tend to have more strategies that can be profitable when selling than calls. If you don’t believe this, just try back testing short option strategies and see if you can find one where calls beat puts- I haven’t found one.
Selling Options on Individual Stocks
I’ve written a number of times about how indexes are much less likely to have extreme outsized moves than individual stocks. 2022 is a great reminder of that. Many formerly valuable stocks lost well over half their value during the year, and a number of them lost over 90% of their value. I was exposed to some of this mayhem when I sold puts well out of the money on a few that seemed like they couldn’t miss, but then did.
I completely botched a trade on a company that I really like. Generac makes back-up generators as well as systems that store and manage electricity generated from solar panels. With the electrical grid getting less reliable, people are in need of their products. So, to mix it up a bit, I sold at $20 wide put spread in the low 200s early in the year after the stock had fallen significantly and seemed to be on an upward trajectory. Despite all their success in the market, the stock slowly declined, and I found myself rolling my position down and out a few times. Then, I made the fateful decision to sell my long put of the spread and switch from a put spread with $20 risk, to a naked put with a strike price of $200, cash secured. I figured that the stock was surely at the bottom of its range, and I wouldn’t mind owning it if it dropped a little more. Then Generac announced that they were going to miss earnings substantially because of a lack of installers available to deliver and install their equipment at residences. Overnight the stock dropped 30% after previously losing over 20%. Before I knew it, I was stuck obligated to buy a $100 stock for $200. I tried to roll out, but there were no takers to make a trade. I was assigned the shares, losing $10,000 per contract on a trade that originally had a max loss of $2,000 per contract. Multiple bad ideas- individual stock risk, getting cute when tested, not accepting a loss and moving on.
I also sold puts on ARKK, the Ark Innovation ETF. It’s not an individual stock, but it is a volatile managed fund of a relatively small number of innovative companies. Again, I thought that we had seen the worst of the market drop, especially for this fund, and I sold cash secured puts in the middle of the year. Since then, the stock has fallen by half- I had about a 10% cushion to start, but that is long gone and now I have shares.
There are some others that weren’t that bad, but the conclusion is the same. Options on major indexes are much less likely to be hit by outsized moves, particularly if there is a decent amount of time until expiration and the strikes are well out of the money. That is one of my core mantras and I strayed at my own peril.
What went well
Fortunately, not everything went as badly as the trades described above. I re-discovered some strategies that I had stopped using that worked well, and started using some new strategies that I was either skeptical of or unaware of prior to putting them into practice.
Selling Long Duration Puts
I’ve sold puts well out of the money well out in time many times in the past, but the allure of big Theta from short duration started getting the best of me. Why sell at 6 weeks or 12 weeks when we can make bigger returns selling at one week? Well, lots of reasons. Short duration takes lots of effort and is much more stressful. It doesn’t take a big move to blow past strikes that have value less than a week until expiration, while positions outside of the expected move a month or more out in time are much less impacted.
With positions 4 to 6 weeks out or even more, we get more consistent results and can reduce volatility of the portfolio. When a big move happens, we can wait a few days to see if the move reverses before making any adjustments. Often it does and there is no reason to intervene.
I’ve found that I can still sell spreads with Delta values in the teens that are in their maximum percentage of decay weeks or even months before expiration. While the percentage return isn’t as high as short duration, it is more consistent and higher probability of being positive. It isn’t exciting, but that’s okay.
Put Ratio Trades
The most popular page on my site every month is my explanation of how I trade broken wing butterflies. For a while I got away from trading this, chasing some other “shiny object.” I re-started trading the strategy and got back to winning. I have been a little more opportunistic with this strategy, opening on down days to get my strikes lower with higher IV, but the trade is high probability with rapid decay. The way I trade it seems to be just far enough out in time to buffer it from the volatile weeks that have come along regularly in 2022.
I’ve also had good success with the other put ratio cousins of this trade, the broken wing condor (or 1-1-1-1), and the 1-1-2-2 trade. The common thread to each of these is that there are two competing spreads in each case. I start with a debit put spread, typically where I buy a 25 Delta put and sell a 20 Delta call which acts as protection for a higher priced and wider credit put spread at lower delta values. The wider and lower Delta valued credit spreads decay faster than the narrow debit spread, and often switch from a negative value overall position when sold to a positive value position that I can sell to close prior to expiration. This happens when the wide credit spread decays to the point that it has less value than the narrower debit spread. So, I often collect cash when I open and collect cash when I close these.
Finally, I’m seeing success in the naked versions of these trades as well. Instead of having two spreads, I sometimes skip using the low long leg of the credit spread and go with selling a naked put. This leaves me with a debit spread protecting a naked put or two below it. So I end up with 1-1-1 or 1-1-2 versions of the above trades- true ratio spreads. These have undefined risk to the downside unless cash secured, and I trade them on margin. That ties in nicely with some of my other take-aways.
Using Futures Options to Pump Up Returns
After avoiding futures for many years, I’ve really become fond of them. I avoided them because I didn’t see the strategic value of buying or selling futures contracts on an index or commodity. I was also scared by the risk of aggressive use of SPAN margin. But what I’ve found is that futures options in particular allow me to sell high probability positions for very low amounts of capital, and then allow me to buy or sell actual futures contracts to use as a hedge and neutralize overall Delta. It can get complex very quickly and a trader has to be avoid building a house of cards that could collapse in a outsized market event. But when used with care, futures options and futures themselves provide valuable tools to increase returns.
I haven’t written much about the use of futures strategies on this site because I’m still working to distil the approaches into content that can be readily applied. Risk vs reward becomes much more significant with futures options, so risk management becomes a primary consideration in every trade and isn’t something to jump into without a comprehensive understanding.
All that said, I’m finding futures options allow me ways to magnify returns and also hedge my risks. I’ll be writing more in subsequent strategy discussions, but if you look at pages on four different underlying types and four levels of risk, there’s some initial content to consider. One specific hedge trade I’ve started using, the 1 DTE Straddle, came from my futures experience.
Selling Naked Futures Options
One place where I’ve found success with futures options is selling naked options well out of the money well out in time. Because of SPAN margin, these trades don’t require much capital. They also don’t move that much because of the long duration. I’m finding trades with lots of decay and really seeing the appeal of naked options. Long duration and low deltas cushion the positions from big day to day moves and give me plenty of warning to adjust when needed. While spreads have windows where they can be rolled for credit and other Delta values where they can’t, naked options can always be rolled out in time for credit. The issue is that some rolls are more lucrative than others.
So I finally see the flexibility and adjustability that naked options provide in defending against big price movements. The key is to manage size to keep risk reasonable.
Naked to me involves a variety of strategies from selling a single option, to selling the naked put ratio trades mentioned above. As I better define consistent management and hedging approaches to these trades, I’ll explain my naked strategies in more detail.
Using Research to Test Strategies
Finally, I’ve re-discovered the importance of doing my own research to understand trades I’m doing. I’ve shared many of my insights on this website, but I always have new ways to look at trade set-ups, impact of management, and understanding risk. I’ve written about the sources I use to research the market, and I still use the same primary approaches. I use current option tables, I do backtests, I analyze historic trends, and I model potential outcomes.
Sometimes it is easy to get caught up in what I’m doing every day and not stop and ask if the approaches I’m using at the moment are really valid. I don’t look to see if there is a better way. Research keeps me fresh, and often validates findings I’ve observed in the past, but strayed away from in my current trading. So, constantly looking at data from different strategies in different ways actually keeps my trading focused on approaches that work.
I also find that the biggest beneficiary of the studies I share is me. Writing things down to share makes me double check my work and get clearer as to what I’m doing. Sometimes in the course of providing data for a trading approach I’m doing; I realize that I could do better, and revise based on what the data says.
I also get a lot of inspiration from other sources- groups I’m a part of and sites I follow. My favorite source of inspiration continues to be TastyLive, which I often have playing in the background while I trade. I interact with a lot of other traders which also helps. I’ve written about the value of community in the past.
So my final thought is that I need to challenge myself to always keep learning and base my trading strategies focused on proven approaches with high probability of success and manageable risk.
I buy a 1 DTE straddle on indexes for two reasons. 1, It has a positive expectancy over time. 2. It is a hedge against short option positions
I’ve started buying 1 DTE straddles on the S&P 500 for two reasons. First, this straddle trade has a positive expectancy- over time it has made more than it has lost. Second, and perhaps more importantly, the straddle is a great hedge against my many short option positions further out in time. How I came to these observations and how I manage this trade are the topics of this discussion.
A straddle is buying a call and a put at the same strike price and same expiration. When traded at the money, it roughly represents the expected move of the underlying for that time period. So, buying a 1 DTE straddle for $30 would mean that the market expects the SPX index to move around $30 plus or minus the next day. Buying a straddle means the buyer is hoping the market will move more than expected, and the seller is hoping the market will move less than expected.
Normally, I only sell options or spreads for a net credit and wait for the value to decay away for a profit. I mostly sell options with expiration dates weeks or even months out and a decent distance out of the money. Those trades have a high probability of profit. However, they also carry the risk that an extended big move in the market could result in a big loss.
Profiting from the trade outright
With 2022 being a bear market year, I have studied more about ways to manage positions in downturns. One interesting book on the topic is “The Second Leg Down: Strategies for Profitting after a Market Sell-Off” by Hari P. Krishnan. One observation in the book is that options under 7 DTE tend to be undervalued and have good potential to make money or protect a portfolio in the midst of a downturn. The book has numerous interesting strategies to help navigate downturns. I’ve toyed with a few of these, but I couldn’t find a trade strategy that achieved the type of positive outcome I was looking for.
As I’ve noted elsewhere, I’m a big fan of the TastyLive.com broadcast site. Just before Christmas at the end of 2022, Jermal Chandler interviewed Dr. Russell Rhoads on his Engineering the Trade show. The topic was short duration options that are now quite prevalent. One key point is how very short duration at the money (ATM) straddles on SPX (S&P 500 Index) and NDX (Nasdaq 100 Index) are actually underpriced. If you buy a 1 DTE straddle at the end of the day and hold to expiration the next, it has averaged a positive return in the past year, which says these options are actually undervalued, counter to what we would normally expect.
I’ve added the presentation, which is broad ranging on the topic here: (Press the red play button to watch)
Starting at about 8:00 into this video, the discussion starts on how 1 DTE premium has been underpriced for the past year.
I decided to try buying these as a one lot and so far I’m seeing this work out with a positive return. And this has been during a few mild weeks with little movement. The straddle never expires worthless as one side is always in the money- it’s just a matter of how much. I have generally closed these early, selling the side that is in the money when I can for more than I paid for the straddle. So far, this has worked better than holding to expiration because we have been range-bound. When we get into a trending market one way or the other, it will likely make more sense to hold.
The hedging benefit
However, I found a second benefit that may be much bigger. I decided to switch over and buy a 1 DTE /ES (S&P 500 mini futures) option straddle in an account with a lot of short futures options for a 1 DTE straddle- not sure why I even decided to other than the size is half as much. Anyway, I noticed that buying one straddle greatly increased my buying power by over $27K, which didn’t make sense initially because I was paying a debit and I thought that would reduce buying power by what I paid-about $1500 ($30 x 50 multiplier).
It turns out that the futures SPAN margin saw this as a big risk reduction. (For more on futures options and margin, see the webpage on different option underlyings.) Buying the /ES straddle gives me 500 equivalent shares of SPY notional in either direction of price movement. This will counter several short options out in time and out of the money. So essentially it is a shock absorber for my futures positions.
Many traders are nervous about the overnight risk of holding short options, due the possibility of a big gap in price overnight. Having a hedge like this can help mitigate that risk.
The biggest question is how big of a position is appropriate? Well, keep in mind that if the market doesn’t move at all and closes very close to the strikes of the straddle, the straddle will be nearly a complete loss. So the size of the trade should be a very small portion of a portfolio, as this trade will be very volatile, going from losing nearly 100% some days to returning several multiples of the initial value others. Think of it as a volatile side trade that can reduce volatility of a much larger set of positions. Kind of a contradiction.
Futures make this obvious, but the same logic applies to any portfolio full of short option premium. The S&P 500 and Nasdaq 100 indexes have a variety of options underlyings at different costs to allow traders of virtually all account sizes to utilize this kind of trading strategy.
So, I think there are a number of angles to pursue this from a trading and portfolio management tool. I thought it might make a good topic to discuss with this group- the gamma of this trade provides a lot of protection at a low cost, essentially free over time, although likely to have periods of loss.
Essentially, I look at it as a great hedge that can still make money on its own. If I have out of the money longer-dated short options in a portfolio, they will make money on calm days, and the 1 DTE straddle will make money on turbulent days. And if I manage each correctly, each should make money over time.
Managing the Straddle
I tend to buy these straddles right at the close the day before expiration. On Fridays, I buy Monday’s expiration, which surprisingly often is about the same price as other days. I’ve tried buying two days out and laddering, but that gets to be a lot to keep track of if I try to manage early, so I prefer to buy at the money at the close for just one day.
Big moves by the end of the day can be very profitable for a 1 DTE straddle, so so can smaller moves overnight or early in the day that allow a trader to manage the trade or take some risk off the table.
Like all option trades, there’s always a management choice of hold, fold, or roll. This trade has all those elements to choose from.
As mentioned earlier, probably the simplest choice is to just hold to expiration. The odds are that over time, the trade will win more than lose. However, this may mean that we have a day where a trade is profitable at some point in the day, but then moves back toward the strike price and loses money. Finding a way to beat simple holding takes a lot of effort and since we know the worst case scenario is losing all the premium we paid, we may want to just let it ride. On days where the market is on the move, this can be very lucrative, as the max move may be at the close of the day. Think of holding as the default way to manage the long straddle.
I’ve found that calm days in a range-bound environment are ones where prices explore support and resistance levels before returning to a point closer the strike price. As the day goes on and price stays constrained, I look for a chance to sell one side of the straddle for a price more than I paid for the total. Earlier in the day, I feel like I can be greedy and wait for a big profit, but as the day goes on, I’m happy to get out for any profit. So, I’ll fold one side of the straddle for a profit when it doesn’t look like we are going to close at an extreme move. Occasionally, I might get to sell the other side if there is a late move in price to the other side of the strike price.
So, that’s hold and fold. How/why would I roll? Let’s say the market has moved a significant amount from the strike price, and I’d like to take a profit but still have the possibility of taking advantage of additional movement. I can roll my in the money option toward the current price for most of the distance rolled. For example, let’s say the price of SPX is down 40 points midway through the day and I’m worried it might come back up, but want to also benefit if it keeps going down. I could roll down my put 20 points and maybe collect $18, locking in 90% of the move. If the price keeps moving, I could keep rolling. The downside of this is that I don’t get 100% of the move, and I’m paying commissions on each roll, and these trades will be pattern day trades if I close the new position before the end of the day. I also will have a hard time locking into a profit that is beyond my purchase price, unless I have a really big move. But rolling is a choice to consider for some traders and some accounts.
Conclusion
So, there you have it. A volatile option buying strategy one day before expiration that averages a profit and can hedge other positions in a portfolio. I have found expiration trades stressful in the past, but this one has been much less stressful to me despite the volatile nature of it.
I’ve noticed some put spread rolls collect more credit than others. This study shows that there is an ideal Delta for rolling put spreads
After trading put spreads for several years, I’ve noticed that some rolls collect a lot of premium credit, and others are a struggle to collect any credit at all. I decided to study this to see if I could find if there is a “sweet spot” for rolling put spreads based on Delta values. I’m happy to report that there is.
It’s no secret that if a put spread gets fully in the money, it is impossible to roll to the same strikes in a later expiration for a credit. But when a spread is out of the money, I’ve seen a wide variation in credit when I roll, and I’ve often thought that there must be a best place to make a roll to get the most credit. If there is, I could devise a strategy to take advantage. So, I copied some option tables into Excel and pivoted the data a few different ways to figure out how premium from rolls vary.
Before jumping into the study, let’s discuss what rolling option spreads involves and why we might do it when a spread is out of the money. Rolling is one three ways to manage an exisitng trade- I covered the three ways in the page on managing by holding, folding, or rolling. One of my common management techniques is to continuously roll a position- I let the short spread decay in value, then roll it out in time to get more premium, and then let it decay all over again. Just repeat over and over. For those not familiar with the roll concept, rolling means executing a trade where an existing position is closed and a new position is opened all at once in one trade. The new options may be at the same strikes, which would be rolling “out,” or the strikes may be higher, which would be rolling “up and out,” or we could also roll “down and out.” Rolling a credit put spread that is out of the money out to the same strikes, will almost certainly generate a credit, which is the goal of this strategy. I’ve discussed this -approach in detail in other pages of this website, including roll for 6 percent a week, goals for rolling Iron Condors, the power of rolling Iron Condors, and rolling losing positions.
Rolling Spreads in the Study
I looked at a lot of different combinations of rolls, different durations, different times between durations, and I saw similar results. In the interest of keeping this write-up from getting lengthy, I’m choosing to just show a few examples.
7-10 DTE Roll
While I don’t trade a lot of options with durations of a week or less, I thought it would be good to look at this timeframe as the lower end of timeframes where we get outside of current week expirations. The following chart shows all the available combinations of 40 wide 7 days to expiration (DTE) SPX credit spreads rolling to the same strikes at 10 DTE.
Rolling out from 7 DTE to 10 DTE has the best credit when the 7 DTE short strike is between 10 and 20 Delta. Note that the Theta peaks at a slightly higher Delta.
I’ve shown the net credit for each roll combination, as well as the raw Theta difference for each existing 7 DTE 40 point wide spread. The x-axis is the Delta of each 7 DTE spread. The roll credit is shown on the left axis, and the net Theta is shown on the right axis. Looking at a peak value of approximately $1.20 per roll, we would collect 3% of the 40 wide spread. Meanwhile, the peak Theta of around $0.45 per day would equate to 1.1% of the width. So, holding might get a similar daily return, but with increasing risk as expiration approaches, but a roll would allow us to collect 3% and still collect additional Theta over again. Actually, that’s double counting. The Theta would just be the decay of the premium we are collecting. Just a few ways to think about the transaction. We can also look at actual strike prices and look at a few other values.
This graph shows roll credit plus Delta and Theta values for the positions
On this next chart, I’ve shown the x-axis as the strike price of the short put of the credit put spread. I’ve also added the Delta values of each of the puts for the 7 DTE spread as well as the Delta of spread position. In addition to the net Theta of the 7 DTE spread, I added the net Theta of the 10 DTE spread that we would roll to. So, each strike price on the x-axis is tied to six different pieces of data for a potential spread roll. While the roll premium and net Theta of the 7 DTE spread is the same information as the previous graph, the additional data can add more context.
Note that the Theta values of the longer duration spreads are generally lower than shorter. That should be expected. More time means slower decay. But the new spread will have a slightly higher Delta, which moves the peak of the Theta curve down in strike prices, because as we have seen in our study on maximizing Theta for a put spread, Theta tends to max out at short Deltas around 20, which will be further down after a roll. So, note from the chart that the maximum roll premium lines up for the most part with the maximum Theta of the spread we are rolling to.
The take-away from the Delta information on the chart is that as we get closer to the current price and have higher Deltas, the net Delta goes up, and the value of rolls goes down. Also, if Delta gets too low, there isn’t as much premium available in a roll to the same strike prices. I picked out the Delta values of the spread with the highest roll value, and it is approximately 14 Delta on the short strike and 8 Delta on the long strike.
So, the ideal scenario is to start with Deltas of around 20/13 and see the positions decay and Deltas to decline to 14/8, and then roll out to new strikes with Deltas of 20/13. If only the market would cooperate with our plan and let us do this all the time. Obviously, the market isn’t that consistent, so we have to manage in other ways.
Sometimes, we may want to roll down and out. Let’s look at the premium for 40 wide spreads and see what is possible if we want to collect a credit.
Looking at the premium differences, we can see opportunity to roll down at some strikes more than others.
On the above chart, I have plotted the premium value of 40 wide put spreads at 7 and 10 DTE, along with the premium collected to roll out to the same strikes. I’ve also highlighted possible rolls down and out. The highest strike where it is possible to roll down a strike and collect a credit is to go from 3920/3880 at 7 DTE to 3915/3875 for a 10 cent credit. When a spread is being tested, every bit helps, but clearly this roll doesn’t give the position much more breathing room. On the other hand, if we had the 3800/3760 spread, we could roll down 25 points to 3775/3735 for no cost. So, again it pays to stay away from being tested. But at this short of timeframe, it doesn’t take much of a move to get a spread in trouble, so let’s look at how a little longer duration would fare.
21-42 DTE
Let’s look at an example that generally matches up with the common strategy often associated with TastyLive.com. Interestingly, values peak out at about the same place based on Delta.
This example shows rolling from 21 DTE to 42 DTE, essentially doubling the time until expiration.
Again, the best premium for a roll is in the mid to low teen values of the Delta value of the short strike of the 21 DTE spread. Here we are collecting just over $6.00 to roll our 100-wide put spread out to 42 DTE. In that case, we would be collecting an additional 6% of the width of the spread. The 21 DTE spread would be decaying about $0.30 per day, so the roll allows us to collect around 21 days of decay in cash.
Notice that the observations we made on the 7-10 DTE roll hold almost exactly the same on the 21-42 DTE roll, even though we have much higher time to expiration, wider spreads, and proportionally longer rolls. One difference to note is that amount of premium and Theta are much less on a daily basis, but that should be expected as daily decay for similar Deltas gets higher as expiration approaches.
This graph shows the premium levels of 100 point wide spreads at 21 and 42 DTE, as well as the premium collected to roll out at the same strikes.
Another key difference is the distance that our strikes can be from the current price, giving the position more wiggle room for price changes. The above chart shows the premium of the various spreads available at 21 and 42 DTE. Notice that the lower strikes approach zero value while the spreads at higher strikes approach 100, which is the width of the spread and would be maximum loss for a credit spread at expiration. With spreads, the closer expiration gets the more of an S-shape we get when charting the premium. Since we are selling the spread, we’d like to see the value decay, either by staying out of the money as time goes by, or seeing the price go up, which would shift all the lines to the right on the chart.
What if we want to roll down to lower strikes when rolling out from 21 to 42 days? Let’s look at what would be available by zooming in a bit to the chart above to the area where there is credit available to roll out.
In this chart, we can see that the further we are out of the money, the more we can roll down for a credit. Once a spread is in the money, the opportunity to collect a credit is gone.
With plenty of time to expiration, we can roll out for nice credit or roll down quite a ways for some credit. For example, in the chart above, the 3700/3600 spread could be rolled down 150 points to 3550/3450 for 20 cents credit or rolled to the same strikes for $7.50 credit. The closer our strikes are to the money, the less credit we get to roll and the less we can roll down for a credit. And as we’ve seen, if our strikes are in the money, we would have to pay a debit to roll out. Having more time allows us to sell spreads that are much further away from the money and be able to roll out and away much easier than spreads that are closer to expiration.
42-49 DTE
One last example for contrast, we will roll out a relatively short amount of time from a 42 DTE put spread.
Again, we compare rolls at different Delta values, along with the net Theta of our current position.
So, this roll is from 6 weeks to 7 weeks until duration. However, our previous observations generally hold. The peak premium is at a bit higher Delta, in the high teens. This makes sense if we consider that we are only rolling out for about 16% more time, so our new spreads will have peak Theta much closer to our old spreads. This would point to the idea that the best roll is the roll that gets us to a new spread with a short strike Delta of around 20.
Again, our max roll amount equates roughly to the daily Theta multiplied by the number of days we are rolling out.
How to Use This Information
Readers may wonder, what good is this? A trader can’t really control where prices move to, so the Delta value is not really controllable by a trader. This is somewhat true, but prices do move up and down all the time, and so if I’m looking to roll out to get to a timeframe that has less volatility, I might be able to enter a limit order that seeks to collect close to the maximum roll credit possible. Often, I’m not in a big hurry to roll, so I can check out where the maximum should be and set up an order for 90% of that amount and go about my business. If it doesn’t execute after a day or maybe even a week depending on the timeframe of the position, I could change the order to something less lucrative.
Another way to look at this data is to realize that if my position has both strikes down in the single digits of Delta, I’ll likely want to roll up my strikes when I roll out to get to optimal Theta. On the other hand, if my position has strikes with Deltas in the twenties or thirties, I may want to try to roll down and out, and hopefully still collect a credit.
If my position has gotten even closer to the money or even into the money, I’m going to have trouble rolling for a credit, and I have some tough decisions to make. I need to consider all my choices: holding, folding, or rolling. If I’m deep in the money I might consider taking desperate measures. It all comes down to risk appetite and an overall plan of action. It’s best to have a plan for all possibilities ahead of time, and not try to figure it out when times get tough.
Final Take-aways on rolling put spreads
My thought process for looking into this was to find optimal credits for rolling spreads, so I could devise strategies to improve my results. After studying this, I was excited to find an answer that makes sense. Deltas in the teens for the short strike of the spread are ideal for rolling. The further out in time the roll is as a ratio of current DTE to future DTE, the lower the delta of the current spread for best credit from the roll.
A good starting point for estimating the best credit is to take current Theta of the spread and multiply by the number of days that are being rolled out. So, if Theta is 20 cents and the roll is going out 5 days beyond the existing spread, the best credit will be around $1.00.
Finally, realize that this study was for put spreads, not call spreads, iron condors, or naked options. Spreads have unique characteristics compared to naked positions, and their behavior does not translate over. So, I only apply this information to rolling put spreads.
I am studying how naked puts best roll as well and plan to do a write up in the future on the topic.