Buying an out of the money spread seems counter to every theoretical calculation a person can do. The probability of expiring in the money is low by definition and time decay is our enemy big time. But, over the years I noticed that when I sold call spreads that were supposed to be profitable, either alone or as part of an Iron Condor, those spreads seemed to lose money often, and often lost a lot. One thing I’ve learned in trading is that if a strategy you use continually loses, try doing the opposite. So, here we are. I’ve done a lot of back-testing and trading my own positions to come up with a low probability strategy that actually wins over time.
Just to be clear, this trade can be named a lot of different things. Some may choose to call it a bullish or bull call spread because it benefits from prices going up. Others may call it a debit call spread because a trader pays a debit to get into it, versus a credit spread where the trader collects a credit. So, it’s a debit spread, a bull spread, and it means we are buying one call and selling a less expensive call.
As I tested different variations of this strategy, it became clear that the key was to keep the amount of capital required low with lots of upside potential, but high enough that the position has a chance for success. Also, this is a trade that works best when the trade is closed for a win and not held to expiration. It also does best with low Implied Volatility in a bull market.
In high Implied Volatility environments, options are expensive, and it is hard to justify buying them. A big move is needed to make up for the large amount of premium paid, and time decay eats away at the position.
In low Implied Volatility environments, the cost of options is low, and strikes with fairly low deltas are often inside the Expected Move. This is much more true for calls than puts, due to skew. So, for not much cost, we can get into a position that often out performs its probabilities. And with active management we can greatly improve the long-term profit and loss.
Why buy a call spread and not just buy a single call option, you might wonder? Two reasons, cost and time decay. Buy selling a lower probability call, I can significantly reduce how much I pay for the position, but see an even bigger decrease in Theta, the Greek variable measure for daily time decay.
A key relationship to know is that the Delta values of the two options in the spread give a relative calculation of the value of the spread. The average of the Delta values taken as a percentage represent roughly the percentage of the spread width that the premium is worth. A call spread of a 30 Delta call and a 20 Delta call will have a premium value of about 25% of the width of the spread. So, if the strikes are $2 apart, the premium will be approximately 50 cents. The percentage is usually a little closer to the Delta of the higher Delta strike due to skew, but as a rough estimate, the calculation works well. Why would we care? Because if we double our Delta values, we double the value of our premium in a spread. That will be a key theme for this particular trade.
Call Spread Set Up
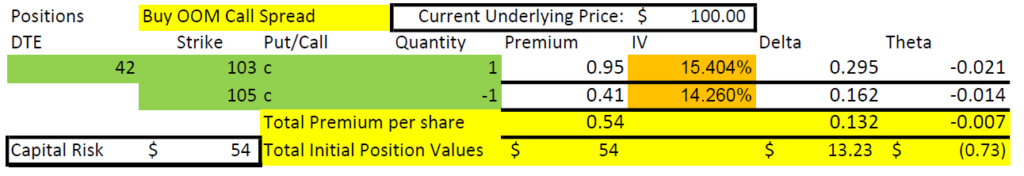
Here is the set up of my preferred strikes for an out of the money call spread. I try to open this trade with somewhere around 6 weeks until expiration so that time decay isn’t too bad and I have plenty of time to manage the position. Like most option trades, I choose my strikes based on Delta values. For this trade I look for a call to buy that has a Delta value in the 20s, and a call to sell with a Delta in the teens. I want the difference in Deltas to be somewhere between 10 and 15.
Let’s look at an example of a stock or ETF currently trading at $100 per share. I find that the 103 and 105 strikes meet my criteria with 42 days until expiration. The Delta values are 29 and 16, a difference of 13. The premium is 54 cents, or 27% of the $2 width between the strike prices. We are closer to 29 than to 16 as a percentage value. Our short strike has 2/3 of the Theta decay as the long, despite being less than half the premium to start, a contrasting relationship to our advantage. The net Delta of 15 also represents that we have the equivalent of 15 shares of stock, but instead of paying $1500 for them, we only pay $54.
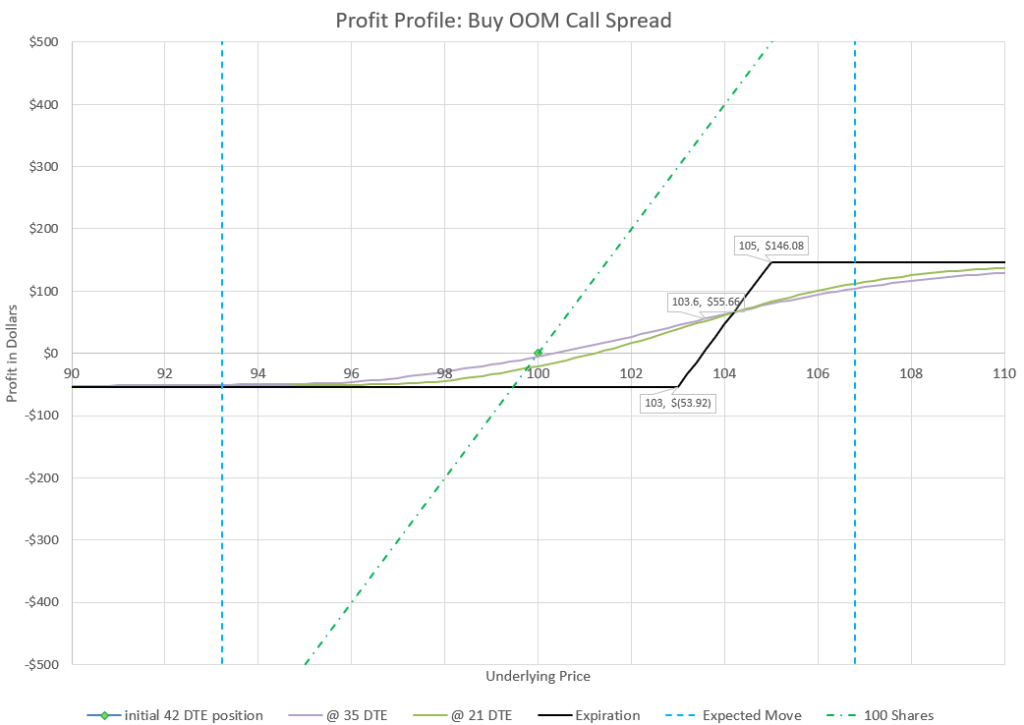
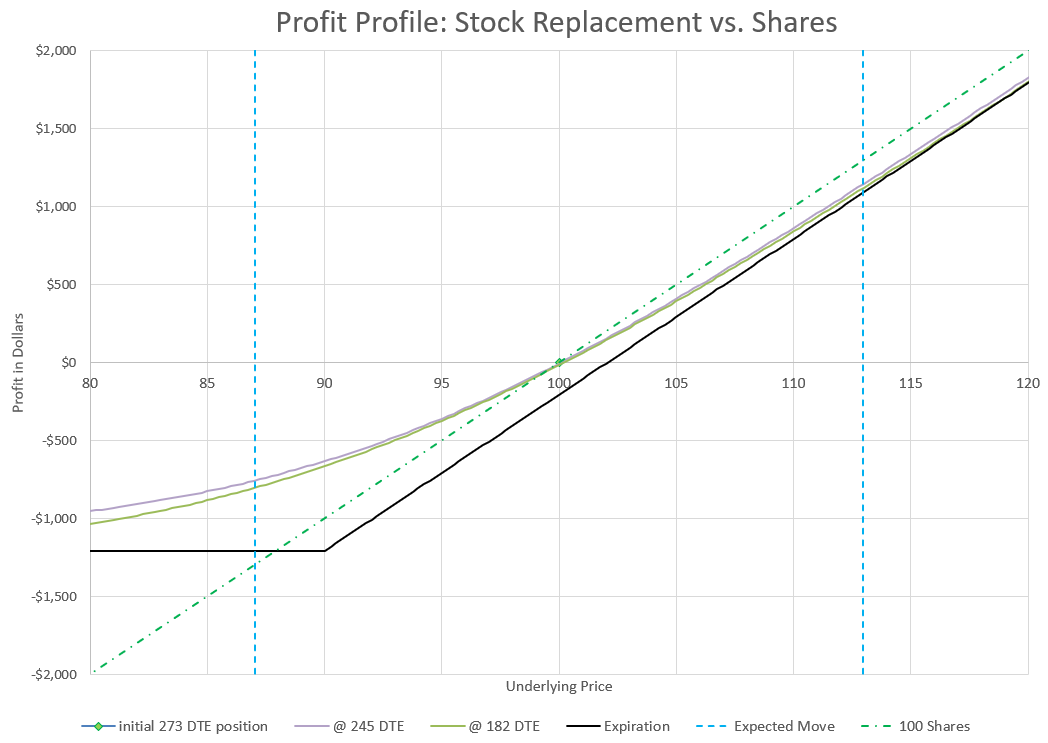
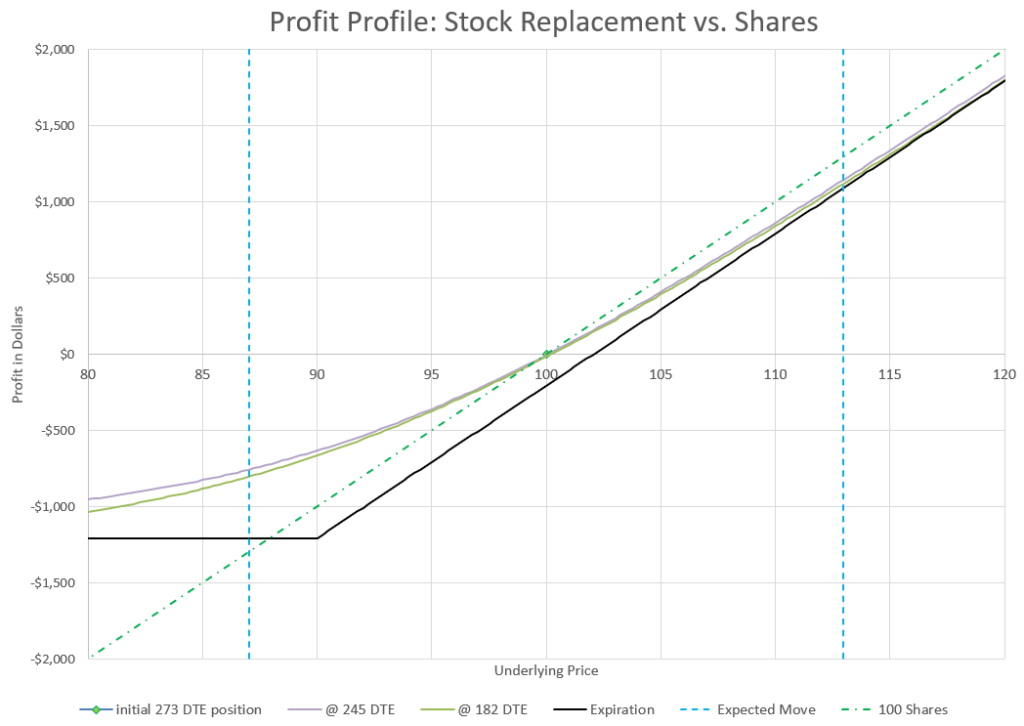
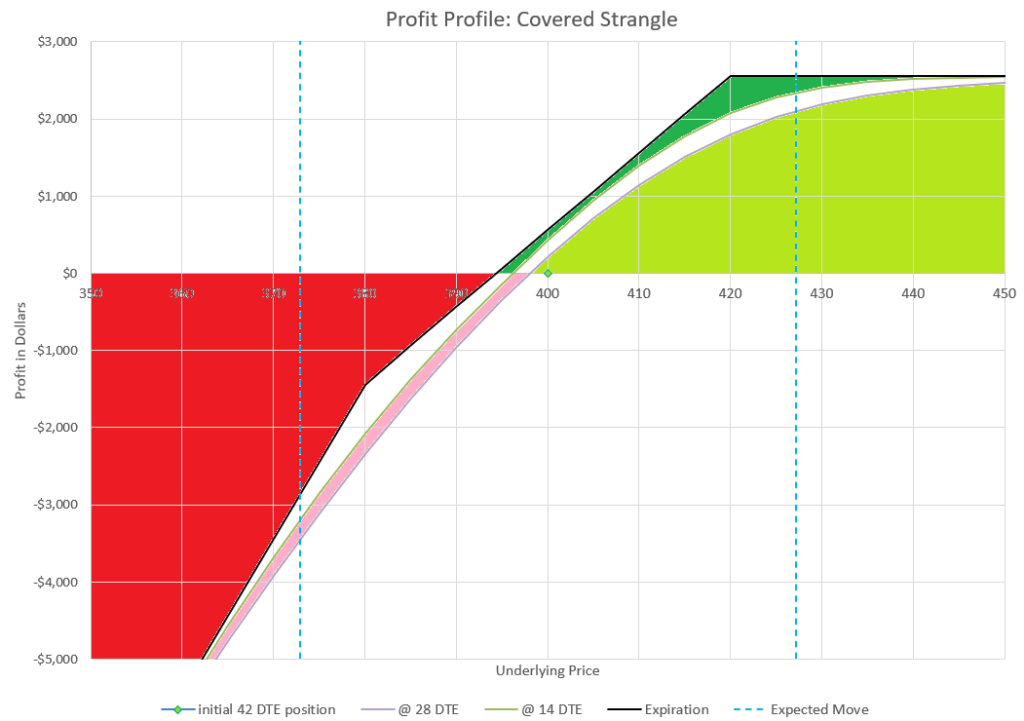
Looking at the profit chart, most analysis of this trade by others would focus on the expiration values, and note that at expiration we need the price to rise to around 103.54 to just break even. That’s true if the trade is held to expiration. But look at the colored curve lines that represent the value at different stock prices in a week or in three weeks. Those lines don’t need much of an increase in price to be profitable, and hold decent value in a small downturn as well. These curves are the secret to succeeding consistently with this trade.
The curved lines also bear out that Delta tells us how much we make or lose based on a dollar change in the underlying stock. We should make or lose about $15 for a dollar move in the stock price, and we can see from the 35 DTE curve that this is about what we’ll get.
Finally, notice that the colored curved lines of profit and loss don’t drop very far below the starting point of zero profit at $100 stock price. This is because there is only a small amount of Theta or time decay at the beginning of the trade compared to the days that come as expiration nears. Our goal will be to avoid the times when time decay kicks in.
We also would like to act based on the part of the curve that is better before expiration than at expiration. If we hold until our position is in the money, Theta switches and moves our profit toward the maximum at expiration. But the probabilities are that we won’t see these positions go into the money and Theta will be taking money from us in ever increasing amounts every day.
Managing the Out of the Money Call Spread
Like most option trades, I like to evaluate the trade with three possible management tactics, hold, fold, or roll. Holding to expiration lowers the probability of success, but might make sense if the market jumps up shortly after entering the trade. Folding or getting out early isn’t a bad strategy to lock in gains or limit losses with this trade by using limit orders. Rolling out regularly is best if the goal is to stay in the trade for the long haul. Let’s take these one at a time in more detail.
Holding a Call Spread to Expiration
Call Spreads are an interesting contradiction in the way Theta decay works. Theta either works for the trade or against the trade, and it can switch depending on whether the trade is in the money or out of the money. Theta is driving the value of the trade toward either zero or maximum value. When we own a Call Spread, Theta works against positions out of the money, but works for positions in the money. Since this particular version of the trade starts with strikes well out of the money, we need the underlying price to go up in a substantial way to make money.
The best time environment to trade this strategy is when IV is low and markets are rising. So, a nice move up can often happen. When it does and the position is in the money, the call premium will be less than maximum profit because the two call options have different levels of extrinsic (time) value left. We can hold the position until expiration to get the last bits of decay and get maximum profit. The risk is that the price can also reverse back out of the money and make the call spread decay toward zero value. For this reason, this is a trade that I don’t like to hold to expiration, I like to get out with a big profit, either with a profitable limit order, or rolling to a longer duration while taking profit.
If the market goes down instead of up, I think it makes even less sense to hold, because the probabilities will have gone down for profit, and the remaining premium will decay even faster. A turnaround to get into the money is needed and there probably isn’t enough time. So, I’d again fold or roll.
Folding with Limits
Many traders like to use limit orders to cash out wins, or limit losses. For traders that are inclined to use limits, this call spread trade set-up has some natural places to get out. Since the upside is higher than the downside, but the probabilities are that the trade loses more often than wins, we need to make sure that wins are much bigger than the losses. One easy natural limit is to take a win when the position doubles in value, or fold for a loss when the position is cut in half. Doing this means we need win better than one out of three trades to make a profit over time on the trades that close on a limit. Let’s look at each scenario, plus the scenario of hitting neither limit.
This trade starts with a long call that has somewhere around a 25% probability of expiring in the money. But it also has about a 50% chance of a touch- the price reaches the strike price sometime before expiration. Depending on exactly which strikes we started with in our call spread, our initial premium is likely 20-25% of the width of the spread, as we discussed earlier, based on the Delta of our two strikes. That means we need the width of the spread to move up to 40-50% of the width of the spread to double in value. Getting our long strike to go in the money, even briefly, should do the trick. Are you with me on the logic and statistics here? Based on all these assumptions, we have somewhere around a 50% chance to double our money on this trade at some point before expiration. But we don’t have a 50% chance to expire in the money. So, if and when it happens, the logical thing to do would be to take the money and run.
Wait, isn’t there some old trading rule that you are supposed to let your winners run and stop your losses? If we close for doubling our money, we give up the chance to get triple or hit max profit. Yes, but with options, time is limited. Markets go up and down, and nobody knows what will happen next. When we get a big win, it makes sense to take profit before it evaporates, and then don’t look back. Usually by the time we hit double our initial premium, a lot of time has passed and there isn’t that much time left in the option, and the probability of making more is still no better than 50/50. We started with a low probability trade, and have a shot to double our money 50% of the time, let’s take that.
A couple of additional factors to consider. Theta decay increases as the trade goes on, so if we can get out early before Theta has a big impact, the big decay at the end can be avoided. Second, one assumption going into the trade in a low Implied Volatility environment is that we are in a bull market, which actually helps our chances of a win.
What about limiting the loss? If we enter a stop limit at half the premium collected, are we giving up too early? Looking at our initial Deltas and how that relates to the width of the spread, our call spread will lose half its value if our Deltas drop in half. Whether that happens due to a downturn or due to time passing, the probabilities of a winning trade or especially doubling the initial value of the trade decline significantly, and the probability of the trade expiring worthless if left alone will have increased significantly. So, the idea is to cut our losses and save some of our capital for another day. Additionally, Theta decay is only going to increase and quickly doom the trade to zero if we don’t exit.
If we enter this stop loss limit order, how often will it execute? Somewhere close to 50% of the time, maybe a little more. But we can’t have a profit limit order executing 50% of the time, and a stop loss limit order executing over 50% of the time. That would be over 100% of the time, and we haven’t even talked about a third possibility. The issue is that if we use a stop limit, some of the occurrences that we are stopped out on are situations where we would have doubled our money if we hadn’t been stopped out. So we actually reduce our odds of doubling to less than 50% with a stop loss, but not a whole lot, because to go from a 50% loss to a 100% gain would take a 4x gain from that low point, a low probability, but not zero.
Let’s look at the math. If our long call Delta falls to the 12-15 range, our chance of that strike being touched would then be 25-30%. But if that situation happened in 50% of our total occurrences, we would be giving up 12-15% of our occurrences that are destined to win, so now our doubles are 35-38% of all occurances.
There’s a third possibility with our fold strategy. We could have neither limit order execute and the trade expire somewhere between losing half and doubling. This is a fairly low probability with the two limit orders in place, because as expiration nears, the trade gets more likely to move toward max loss or max gain. To expire between the long call needs to expire in the money and the short call out of the money. And the position would have to have crept into that position and been very stable especially in the last few days to not trigger either limit order. The probability of this happening are difficult to calculate, but will be well under 10%, maybe less than 5%.
If the trade gets close to expiration and hasn’t triggered a limit, it might be a good time to consider closing early to reduce drama and hopefully collect a profit on the trade. But again, that will change the overall probabilities slightly.
With the bull market on our side, let’s assume we can double our initial premium 40% of the time, stop loss limit out 55% of the time for a 50% loss, and hold on somewhere between to expiration 5% of the time. If these probabilities held up over time, we’d average a 13% gain on this trade.
For these probabilities to play out in actual results, a trader would need to trade the same amount in dollars or in number of contracts each trade. So, set aside the winning amounts to use for making up for losing trades. It’s likely that there would be many winning trades in a row, and many losing trades in a row. Having a variable amount of cash to both compensate for losses and bank winnings would be critical.
Alternatively, letting the size of the trade double or be cut in half based on the result of each previous trade wouldn’t work. Since there are more losses than winners, the account would get cut in half more often than it doubled, and eventually be cut to essentially no value.
Thinking about this way of managing the trade over time and the implications of huge wins and huge losses, this management tactic seems pretty extreme. It provides very extreme volatility, even if a trader consistently trades the same amount of capital trade after trade. As such, this would only make sense as a very small portion of a portfolio.
Continually rolling a credit spread
If you’ve read very many other trading strategies I’ve written about, you’ll know I generally like the concept of rolling my option trades. Rolling is the concept of closing an existing trade and opening a similar trade at a later expiration and/or different strike prices. In most platforms, this can be done in a single simultaneous transaction, so that the net result is clear- is the trade collecting a credit, or paying a debit to re-position?
With a debit call spread (a spread that we are buying), we can still collect a credit to roll from one position to another. This is because we can sell a call spread that has increased in value to buy a cheaper spread that is further out of the money. If we roll to new positions over and over, and the total of our credits are more than the total of our debits, this is a winning management tactic. Both back-testing and my experience show that this tactic works for this trade most of the time, particularly in bull markets.
I like to set up a trade like we’ve used as an example earlier in this post with 42 days to expiration, and then roll after a week. After a week, time decay is relatively small, and a price move up in the underlying of a percent or two makes more than a price move down of a percent or two loses on the trade. The longer the position sits, the more time decay moves the profit curve down, requiring a bigger up move to be profitable. If the market chops up and down, the trade can eke out a profit over time. The reason is that there is much more upside than downside because of the strikes that were chosen to start the trade. But, because the underlying market is bullish, the wins should be more frequent than losers, which really makes this strategy work over time.
Let’s take an example. We buy the call spread in our example for $54 with 42 DTE. After a week the stock is up 2% and our position is worth $80, a $26 gain. We roll this trade by selling our now 35 DTE call spread for $80, and buying a new 42 DTE call spread for $54 again, but now at $2 higher strikes than the week before to have essentially the same Deltas as the position we started with a week earlier. We collect a credit of $26.
A week later, the stock goes down 1% and our call spread is worth $34, a loss of $20. We roll out to 42 DTE again, and this time pay $20 to buy more expensive strikes at $1 lower prices. Now, we have a total of $6 collected from our two rolls.
The next week, the stock jumps 3.5% and our call spread is now worth $110. We roll our position out again to 42 DTE and buy higher strikes for $54, a net credit of $56. Now, we have $62 collected.
The next week, stock drops back 4.5% to our starting price of 100 and our call spread is only worth $3. Ouch- a $51 loss! But, we roll back to 42 DTE and our original strikes paying $54, paying a $51 debit.
After 4 weeks with a stock going up and down and ending in the same place, we have collected $11 total on a $54 use of capital. That’s a 20% return on capital on a stock that didn’t move.
But, we haven’t accounted for broker commissions. At 50 cents a contract, that’s $2 each week, or $8 for 4 weeks, most of our profit. So, we might want to look for stock that has a little higher price where the commission is less of a percentage of the likely profit.
We also expect the market to trend up in a bull market, so that winning weeks outnumber losing weeks.
The advantage of rolling and staying well away from expiration is that we avoid the rapid decay near expiration and we achieve much of the same result as the previous “folding” limit management tactic with constant trade size, but in a more disciplined drum-beat approach. We aren’t tempted to bump up our trade size or cut it way down, because we are just rolling the same number of contracts out week after week, adding or subtracting cash as we go.
From a practical standpoint, each week we have to evaluate what the right strikes to choose are. I try to maintain the same width, but then look for Delta values that meet my criteria. The higher the strike prices, the further out of the money the strikes are, and the lower the cost and the lower the Deltas. I can maneuver around a little to make my new position cheaper than the one I’m closing and collect a credit.
Also, if we have a big move in less than a week, I may choose to roll up my strikes in the same expiration to bank my profit and limit the downside in case of a reversal. In our example, if the stock price went up $4 in a couple of days, I’d roll up my strikes $4 and collect $65 to get my Deltas back to the starting range.
Why this Delta range works
Delta is a very handy measure for options. And for this call spread trade, its many uses really illustrate how this trade works. For call spread, we can take the combination of the Delta value of the two call options to get a net Delta value. In this example, with Deltas of 29 and -16, the net Delta is 13. (Call Deltas are positive. Owning a call is positive Delta, being short is negative Delta.)
If we look at Delta’s definition as a relation of change in price of the stock to change in price of the call spread, we can see that if the stock goes up $1 in price, our call spread premium goes up 13 cents, or $13 for the full contract. As a representation of equivalent stock, 13 Delta means we have the equivalent of 13 shares of stock.
Now, we could have this same price movement and share equivalent with any number of call strike price combinations. We could have bought a 50 Delta and sold a 37 Delta, or bought a 93 Delta and sold an 80 Delta and had the same behavior. 13 Delta is 13 Delta. So, what is the difference?
Remember, Delta is also a measure of probability and value of a spread. Both of these are tied to the individual Deltas more than the net Delta. Probability informs us of what is likely to happen to each option if held to expiration, or how likely it is that the stock price will touch the strike price before expiration. These probabilities inform our management of the option, as we’ve discussed earlier in this write-up. If we chose different strikes, we’d probably want to consider management tactics differently to optimize the trade.
But the real key is the relationship of Delta as a measurement of the value of the spread. Earlier, we mentioned that the average Delta of the two options in a spread roughly approximates the premium when calculated as a percentage of the width of the spread. Sounds complicated, but not really. In our example, our strikes are 103 and 105- the width of the spread is 2. The average of our Deltas is 23.5, so we should expect premium to be around 47 cents (23.5% of $2)- it’s actually 54 cents, but close enough for a rough estimate.
The value of our call spread can vary anywhere from 0 to $2 by expiration, so there is a lot further to go up than to go down. Picking lower delta strikes limits our downside, but gives us lots of upside. That plays out over time with this trade, as long as we don’t plan on holding on too long.
If we chose strikes deep in the money, we’d be virtually guaranteed to expire in the money, but our profit potential would be very limited, while our potential loss would be high. I think there are better ways to use deep in the money calls like a stock substitution strategy using calls, or a poor man’s covered call.
At the beginning of this writing, I mentioned how initially I used to sell call spreads, but realized I was consistently losing money. I looked at a lot of different ways to trade the opposite, to buy call spreads instead of selling. One tool I use for analysis is back-testing. As commercials like to say, “past results is no guarantee of future earnings,” but with big samples back-tests can provide a clue as to what works more often than not. I back-tested a wide variety of call spread values at different Deltas, different expirations, different management strategies, and different market environments before settling on this variation. I’ve traded it a lot myself with good results.
The example I’ve used in this writing is a little closer to the money than I’d ideally prefer. A little further out of the money would get the premium more around 20% of the width, which would cost less to start. The net Delta is fine, but if there were more choices, I might make is slightly less. Wider spreads are good for selling spreads, narrower is better for buying spreads, due to Theta differences.
Can we get too far out of the money, or too narrow? Yes, at some point the premium we pay and the potential profits get too small compared to the commissions and fees required. So, small spreads on cheap stocks may not make enough to pay for trading costs. And for those that might get options trades for free or close to free, there is still the cost of bad fills if an option is not extremely liquid.
This isn’t to say that other variations won’t work. There are pros and cons to every element of this trade. The differences in returns and risk can be adjusted many different ways. I’ve tried to illustrate the trade-offs so each trader can make their own informed choice.
Assignment Risk
One factor we haven’t discussed yet for buying call spreads that can’t be ignored is the risk of having a short call exercised while still holding the long call. As with other strategies that have an element of selling calls, there are some call assignments that can be avoided and some that can’t.
There are three situations that greatly increase the chance of a short call being exercised by the buyer. They are having a call in the money, having a call near expiration, and being short a call when a stock goes ex-dividend. The good news is that the way I execute this trade, these factors should rarely come into play.
First off, the short call is much less likely to end up in the money than the long call. If we start by selling a call with less than 20 Delta, it has less than a 40% chance of having the stock even touch its strike price.
My plan is never to hold until expiration, so that part of the assignment risk is mostly avoided. For those who hold in the money spreads near expiration to try and get max profit, this is a double dare to the buyer of the trader’s short call to exercise early. So, someone who holds a winning trade until expiration shouldn’t be surprised to wake up short 100 shares of stock instead of being short a call option.
Dividend risk is probably the hardest call exercise to avoid, but the key is to have a short call with more extrinsic or time value than the anticipated dividend, and have strikes further out of the money than the dividend. If a trader can do that, there is no reason for a call owner to execute from the other side of the trade. The easiest way to keep a high extrinsic value lines up with the other tactics- get out of positions close to the money and keep expiration away by closing or rolling anything with short duration.
As I’ve explained in other write-ups, having a short option assigned/exercised isn’t that big of a deal to undo, especially when it is part of a spread. A trader may wake up and find a large amount of short stock and a large amount of cash that wasn’t in the account the day before, but that’s what happens when shares that you don’t have get called away. In this case, the intrinsic/in-the-money portion of the long call will always be worth more than the intrinsic value of the short call, so the long call can be sold and the short shares that were assigned can be bought back, all in one transaction, for a tidy overall profit.
Final Thoughts
Buying a call spread like the trade discussed here should not be the core of a portfolio- the trade is simply too volatile for anything other than a way to supplement returns in appropriate market conditions. But, as used as a part of broader portfolio of trades, it can be a way to take advantage of a bullish market with low Implied Volatility. Buying calls out of the money doesn’t have to include a lot of decay. Using a spread reduces the time decay and makes what would seem like a losing trade show profits over the long haul.