The 1-1-2-2 Put Ratio Trade

Like all the front ratio type trades I have shared, this trade is a defined risk version of a very similar front ratio trade featuring naked short puts. My versions hedge the trade with long puts to limit the risk. However, in this trade, I will also discuss the unlimited risk version of the trade, the 1-1-2, because the additional risk isn’t that much from a practical standpoint.

I’m a big fan of front ratio type trades. I’ve written about my success with Broken Wing Butterflies and Broken Wing Put Condors. Another trade that fits in the group is the 1-1-2-2 Put Ratio. I don’t know of a named reference to a bird or insect for this trade, so I’m going with 1-1-2-2. Like all the front ratio type trades I have shared, this trade is a defined risk version of a very similar front ratio trade featuring naked short puts. My versions hedge the trade with long puts to limit the risk. However, in this trade, I will also discuss the unlimited risk version of the trade, the 1-1-2, because the additional risk isn’t that much from a practical standpoint.

I picked up the concept of this trade from one of my favorite traders, “Sweet Bobby” Gaines, who I have mentioned previously in at least one other page on this site. Bobby is a big proponent of the 1-1-2 trade, and has posted numerous videos on it on his YouTube channel, including his recent rising star appearance on Tasty Trade. But really, the trade is the next level of evolution moving from broken wing butterfly to broken wing condor to “one louder” as they say in the mythical group Spinal Tap.

What all these trades have in common is selling an out of the money debit put spread, and financing by selling further out of the money puts or wider credit put spreads. The combination delivers a net credit, but also sets up an interesting dynamic of extra rapid decay of the premium involved. The farther out puts or put spreads decay faster than the closer debit spread, and often lead to the debit spread having more value than the credit spread. These trades take in a credit to open, and often can take in a credit to close. At least that’s how I set them up and manage them.

All these trades are a variation of a front ratio spread, where more options are sold than bought with hedges added to define risk. I’ve also written about back ratio spreads where more options are bought than sold. Front ratios are designed for maximizing decay, while back ratios set up multiple long positions paid for by a costly short position.

The previously discussed broken wing condor could also be called a 1-1-1-1 trade. In that trade we buy a put spread and then sell another put spread further out for more money, collecting a net credit. Four different strikes, 1 contract each. So what is a 1-1-2-2?

1-1-2-2 Basic trade setup

The 1-1-2-2 takes this a step farther, because we use two credit spreads very far out of the money to pay for the debit spread. The 1-1 part is buying a put around 25 delta and selling a put around 20 delta. The 2-2 part is selling two puts at around 5 delta and buying two puts around 1 delta. The goal is for the 2-2 to sell for about twice what the 1-1 cost. I like to set these up with 45-55 days remaining to expiration, quite a bit longer than the other ratio trades I’ve discussed.

What is the advantage of this? Well, because each of the two short strikes are further out, we greatly improve the odds of being profitable, and increase the initial rate of decay of the total position. We end up with a big gap between the debit spread strikes and the two short put strikes. Lots of good things happen with this setup. The biggest upside is that there is no upside risk- if price goes up, the trade makes money. The downside of this trade is that it can consume a lot of capital and has significant tail risk, which we will get into before we are done. Let’s look at a typical example.
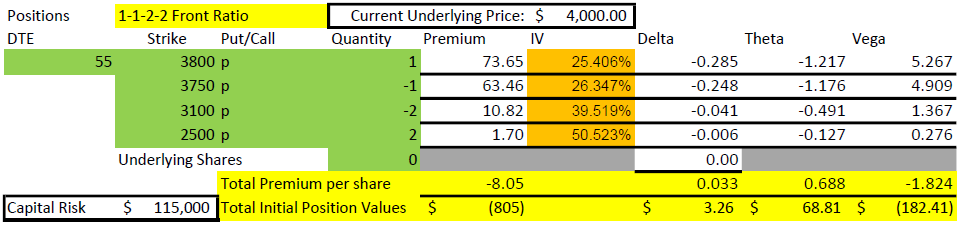
Pricing and Greeks for the 1-1-2-2 position
In this example, each of the two low delta puts collect about what the debit spread costs (~$10).

The first thing I want to point out in this example is that the 3100 short put is 900 points below the current price of $4000. For that strike to get in the money, it would take a 22.5% decline in the market in 55 days. That won’t happen very often. To be fair, this example uses values with VIX at 25, a historically higher than average value, but for the timeframe of 2020-2022, a fairly middle of the road level. The higher that implied volatility is, the farther away the short strikes can be and still collect meaningful premium.

The next thing to point out in the setup numbers is the Greeks. Delta is fairly flat at +3. For a credit trade, that isn’t much and means that the position can handle some movement in price. Theta is $69/day, and we collected $805. So, the position is expected to lose 1/12 of its value each day. But we have 55 days, so how does that work? Quite well, I’d say.

Finally, we can’t ignore the capital risk of $115,000. How can this be? If the price drops below $2500 at expiration, a 47.5% drop, the loss would be $115,000. While extremely unlikely (we didn’t lose that much in the Covid crash of 2020), it is possible in some disastrous scenarios. We’ll discuss this later as it impacts capital requirements and how one perceives risk. At the end of this post, I’ll explain how we can get into this trade for a fraction of this buying power.

Numbers are one thing. A picture or three might help make this all more clear.
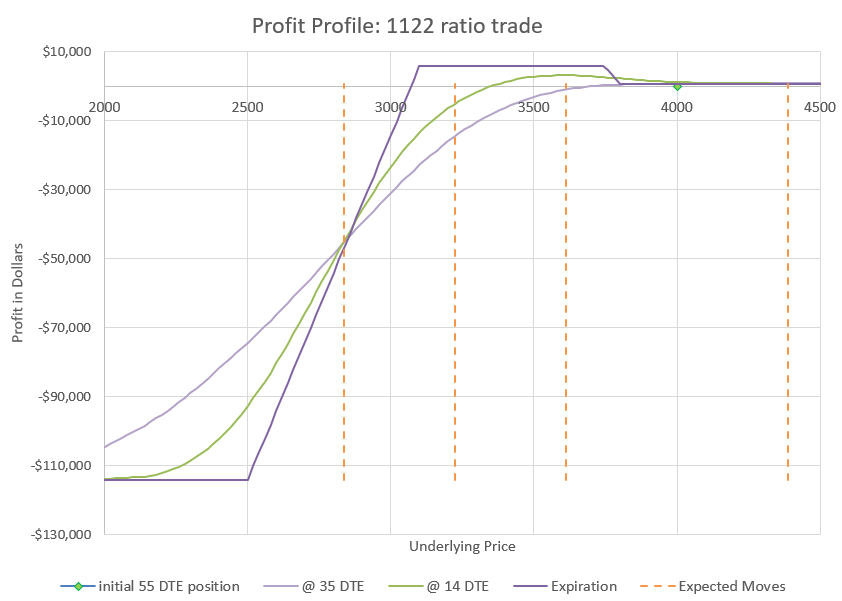
overall profit profile chart
The dotted lines represent expected moves. This trade is profitable at expiration if the market doesn’t go down more than two expected moves.

This chart shows how changes in the underlying price will impact the profit and loss of the trade. We evaluate at four points in time. The green diamond shows our initial position at 55 DTE, underlying price is $4000, and the P/L is zero. The curvy lavender line shows how price would likely impact the position with 35 DTE. The green curve shows the likely profit at 14 DTE, and the sharp purple lines are the expiration values. We know exactly what expiration values will be at any price, but the curves are estimates based on likely impact to implied volatility as time passes and prices change.

I’ve put in dotted lines to show the expected move and multiple expected moves down. If you need a refresher, check my earlier post on expected moves. It is likely that price will end up inside of one expected move, the dotted lines on either side of the current price of $4000. There is approximately a 2% chance that price will move two expected moves to the second dotted line below the current price, which would still be max profit for this trade at expiration. And there is approximately a 0.3% chance of moving three expected moves to the far left dotted line. We can go further, but the odds keep dropping as we go to lower levels. However, as history has shown, moves down tend to have somewhat higher probability than theoretic probabilities once we get beyond two expected moves. The bottom long puts are a final defense to limit losses for going even more extreme in a rapid crash. The point is that this trade is very likely to end up profitable, but there is risk that an extremely big move down could lead to an extremely big loss. We’ll talk about ways to reduce exposure later.

Now that we’ve talked a bit about the very unlikely outcomes, let’s zoom in and discuss the most likely scenarios. Here’s the profit chart showing prices down to 25% below the current price with profit and loss zones highlighted.
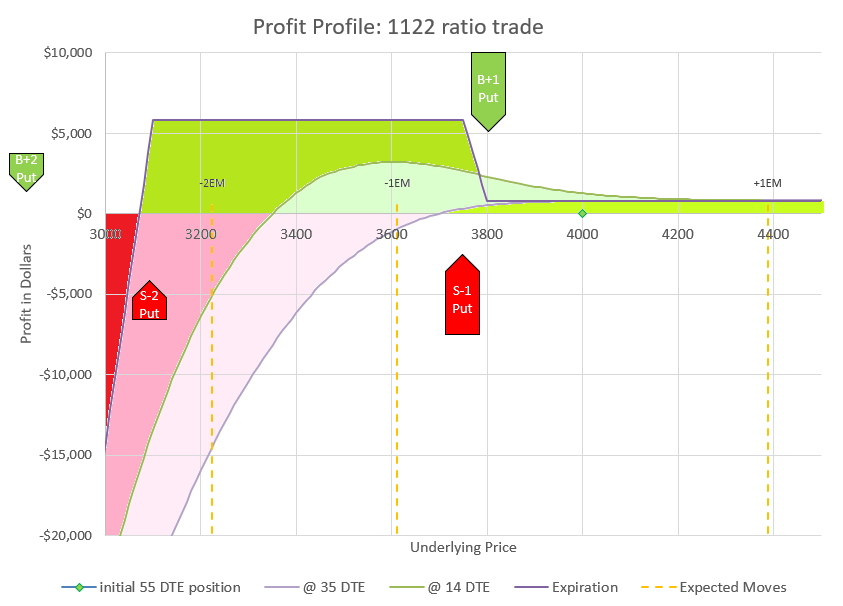
This chart shows the profit and loss compared to most likely underlying price levels.

Zooming in allows us to see the profit levels in the timeframes referenced above. Notice that down moves initially can drive the position to a loss, but if the move doesn’t go below the two short puts at 3100, the position will be highly profitable at expiration. In fact, this trade does best in the very wide range of a price drop between 6 and 22 percent, bringing in up to $5000 additional credit.

If price goes up or drops less than 200 points, we can keep our initial premium at expiration. We may be able to collect more. The profit curve at 14 DTE is actually above the expiration profit if the price remains the same. How is this possible? Because the 1-1 debit put spread decays slower than the 2-2 credit spread, eventually the 1-1 part is worth more than the 2-2 part, even though the 2-2 part started out worth twice as much as the 1-1.

Let’s look at this another way. Prices don’t generally move immediately to a new level, but have probabilities of moves that get bigger over time. Again, going back to expected moves, let’s compare how we might expect price to move during the duration of the trade.
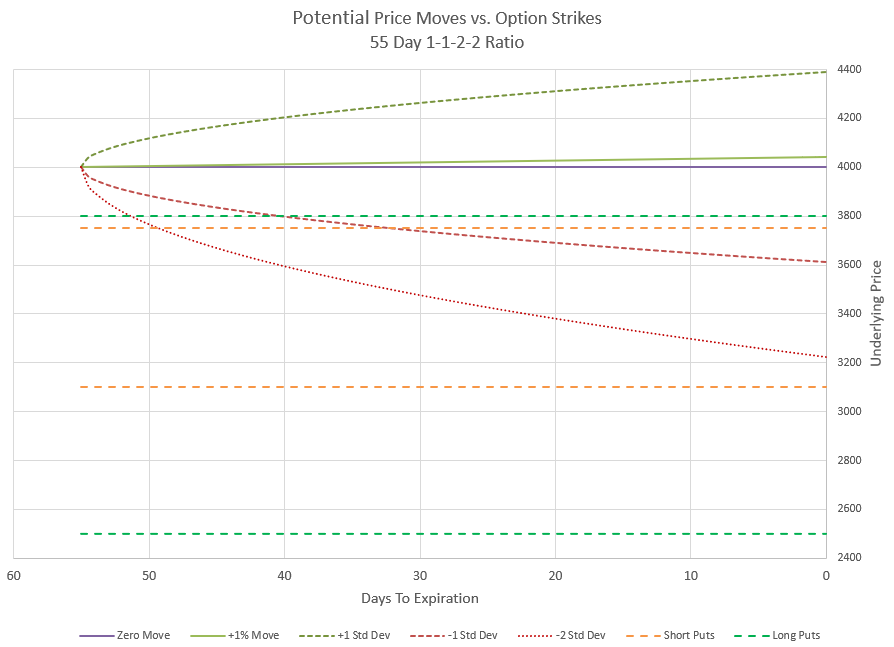
Price expected moves
This chart shows expected moves day by day from initiating the trade until expiration, and compares to the put strike prices.

In this chart I’ve shown several outcomes. The zero move is if price doesn’t change at all, a baseline. I’ve shown a +1% move which is in line with the positive drift of the market. There’s also a line for the positive expected move and the negative expected move, where price is likely to be within at any point in time. And finally I’ve shown a curve for a price move of two times the expected move down. Notice where the strikes are relative to the price curves are. The negative curves take time to get below the upper 1-1 put strikes, and never reach even the short put of the 2-2 credit spread.

Now let’s look at what happens to the value of our premium if price were to follow each of these curves. This is a view that you don’t see much because it is based on lots of assumptions for the pricing models. Since implied volatility is not predictable in the future, the chart makes assumptions for how price and time will most likely impact volatility and premium value.
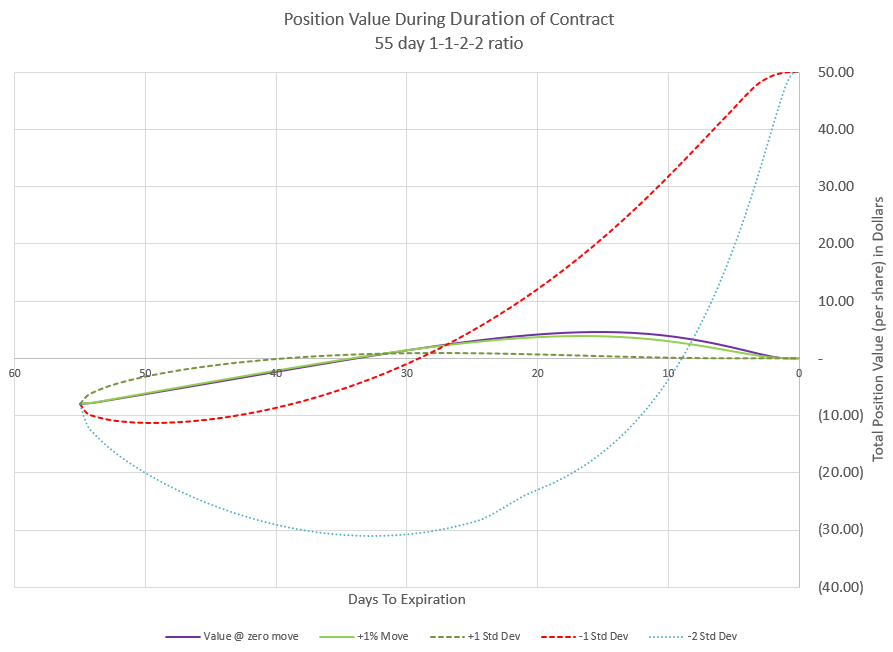
option premium vs time
This chart shows how different underlying price trends would likely impact option premium over time.

Initially, this position collected $8.05 in premium, so we start with a negative or short value of -8.05. From there the price moves shown in the previous chart drive the premium up or down along with time decay. If price is flat or going up, premium decays and moves quickly toward zero premium. If the price goes down, the positive Delta pushes premium to more negative values. The price move of negative two expected moves really does a number on our premium initially, driving it down to below -30.

But, remember our profit chart at expiration? The flat and positive moves end up with a profit of our initial premium (all the puts have zero value at expiration, and the negative expected move and negative double expected move end up at maximum profit. Since our debit spread is 50 points wide, the negative moves would leave it fully in the money for a premium value of +50 points. And that’s in addition to the initial premium collected to open the trade. The challenge is that to get that max profit, we likely will have points in time where our position loses money.

The probability of getting to max profit is low because it would require a price drop between 6 and 22%. Based on our put strike Deltas we can estimate that we have about a 20% chance of that. Most of the other 80% is expiring with all strikes out of the money. So, it might be wise to zoom in and understand what happens with the vast majority of trades.
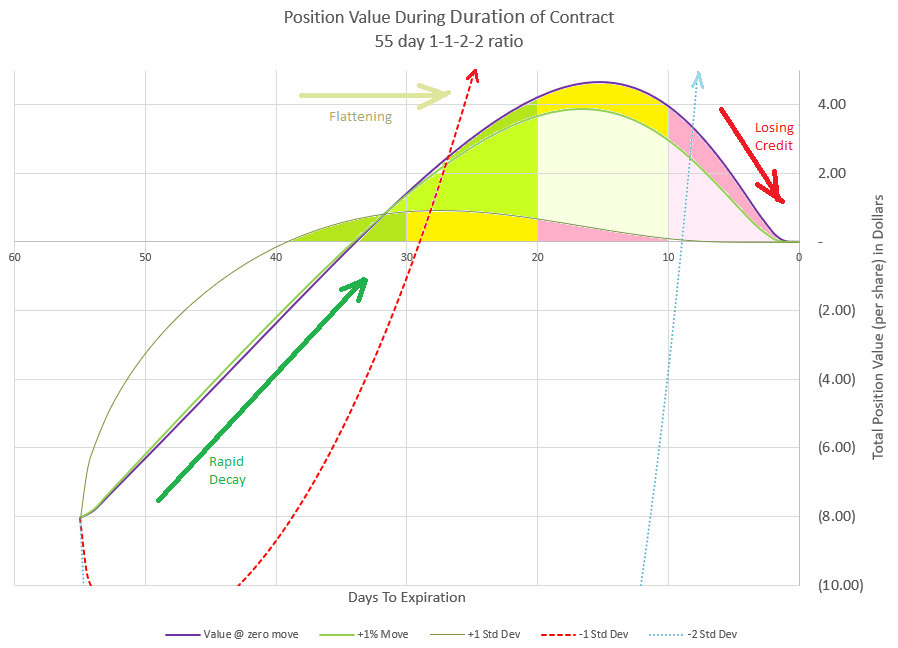
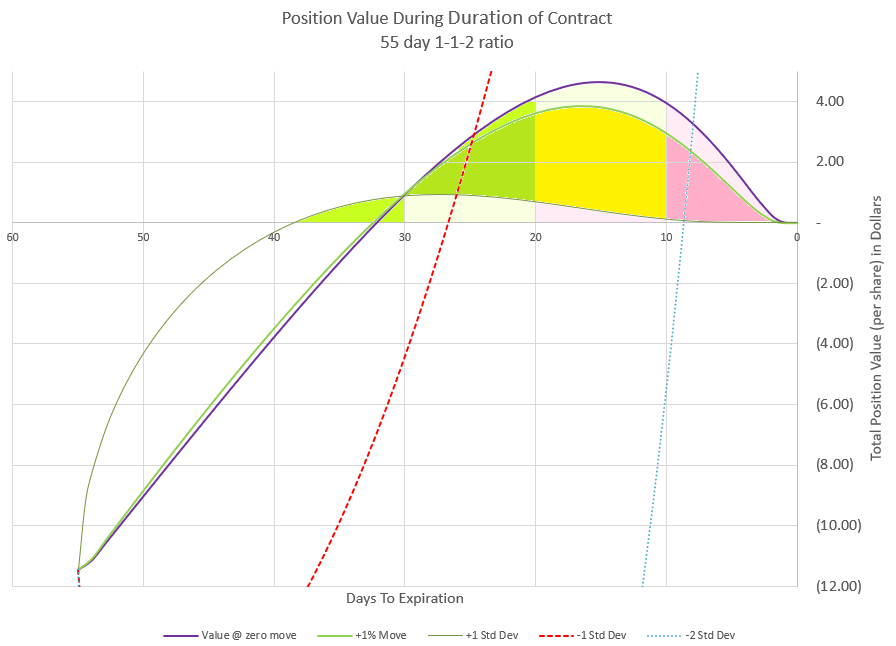
1-1-2-2 value vs. time chart
In most situations, the premium of the 1-1-2-2 front ration decays quickly, maxes out, and then levels off before losing value.

I used this chart as the featured image of this post because I thought it best illustrates how this trade plays out most of the time. If you remember when we discussed the Greeks, I pointed out that Theta is very high compared to the premium. From this chart we see that if price stays the same or is slightly up, premium will decay to zero by 35 DTE, or just 20 days into the trade. This is an example that Theta isn’t 100% accurate by itself as it looked like 12 days of Theta should move us to zero value. It could be that IV modeling is slightly off or the Theta was off, but still we have very rapid decay that I don’t think anyone can complain about.

Like all ratio style trades we have discussed, this trade has the possibility of switching from negative to positive premium. The difference with this trade is that it is actually quite likely, and as such we need to plan for it and manage our profit accordingly.

I’ve colored in the area under our three flat-to-positive curves with three zones each. There is a green zone where positive premium is growing, a yellow zone where premium is topping out, and a red zone where positive premium is being lost. Notice that the curve of the 1% up move and no price move are fairly close together, and that’s because the price movement is relatively close to the same compared to the other moves we are analyzing.

Let’s review how this happens. This trade essentially has two spreads, a slow decaying debit spread (1-1), and a fast decaying credit spread (2-2). The credit spread decays faster because it is farther out from the money, is much wider, and has twice the value to start with. All these factors help decay happen more quickly. As long as the price stays fairly stable, this relationship will hold. Theta will be the primary driver of the premium value, and the wide credit spread will get to be worth less than the narrow debit spread.

The most likely scenario is that we stay inside the expected move and travel somewhere close to the no price move or 1% up move. Let’s realize that the market doesn’t move in equal amounts every day like this chart, so think of it as a smoothed out version of what premium would do. In the real world, premium would bounce up and down with price. However, if our price is close to where we started with 20 days until expiration, we would expect that the premium switch to positive has about maxed out, and it is probably a good time to close out the trade. Hopefully,your trading platform has a analysis feature that lets you look at your position and see how profits are changing day by day to help determine when the position is as high as it can go.

Without a chart, another way to determine how close the trade is to switching direction is to watch the position Theta. At the beginning of this trade, Theta was 0.688, or $68.80 for the full contract per day. As the trade progresses, Theta will decrease and at some point when the premium goes positive, Theta will turn from positive to negative. As it gets close to zero, that is the peak premium value. I generally try to exit the trade a few days before Theta is projected to turn negative. A big up day for the market could quickly change my very positive premium to not as positive premium, so it isn’t a time to get greedy.

So that brings us to the curve for the positive expected move. This is the curve that assumes that the price follows the one standard deviation move up. The good news when this happens is that premium decays very quickly because Delta and Theta team up. The not so good news is because the price move gets so far away from the strikes, the total position won’t get to a very high positive value. This is because all the options will drop in value quickly, approaching zero, and the upper debit spread won’t have much value. A big move up means that the probability of any of the strikes going into the money will be very low, so there is very little premium. As a result, it is likely we won’t be able to get out for much positive premium if any at all, but we will be able to keep most, if not all the premium from the opening trade. This is the least stressful outcome of the trade. If the price moves up faster than the expected move, premium will likely drop to very close to zero and may not ever go positive. So, if price is up a lot and the trade can be closed for a credit, I take the money and run. I’m happy to have a quick, winning trade.

The risky outcomes

Looking at the position vs time value chart, there are two lines that represent what happens if price goes down. One is the move down one expected move and the other is down two expected moves. Interestingly, in this example, both end up at max profit by the end of the trade. So, it would appear that the trade can’t lose, which is far from true. Notice that these premium values may go very negative if prices drop quickly after opening the trade. This is because the narrow debit spread doesn’t pick up as much value from increasing delta as the wide credit spread does in a down move. We know that if price stays above our credit spread short strike at expiration, we will make money, but when price moves quickly down, it isn’t clear that price will level off.

So, as a trader, we are left with a choice when the market drops, We can take a loss and get out of the trade, or wait to see if the market quits dropping before it tests or violates the credit spread strikes. If we are a week or two into the trade, a decent down move will not make a huge impact, but initially the trade can take a big hit from a down move. The longer we are into the trade without a big down move in price, the less the risk is of a loss. On the flip side, a big move down opens the possibility of additional big down moves that can lead to a very big loss. We reviewed the odds earlier- about 4% of the time the trade will lose based on the far short puts having an initial Delta of 4. If this trade is done enough times, there will be some losses. Let’s look at some management actions that could be taken.

1. Set a stop based on premium price. In this example, we collected just over $8 premium to open the trade. So, we could set a stop to avoid losing twice ($16) or maybe even three times ($24) our initial premium. This would mean a stop loss if premium climbs to $24 or $32, given that $8 premium is our starting break-even point. This is the simplest risk mitigation strategy. Using this will lower the overall win rate as many negative scenarios would end up fine if not closed, but this management technique will prevent huge losses that might impact the account dramatically.

2. Close the trade if the underlying price goes below a trigger point. We know this trade has a lot of cushion. We can handle much more than one expected move and be profitable. But if the move is much more than expected, we have to consider that the move is very unusual and dangerous for us. Perhaps our point to get out is when the debit spread is in the money, or when we are half-way between the debit spread and credit spread. Or maybe it is the short strike of the credit spread that is the final trigger to get out. The further down we allow price to go down, the more we stand to lose. Pick the underlying price where it gets too uncomfortable and use that as the trigger point to get out of the trade.

3. Roll out in time if premium or price triggers are hit. If the position is rolled before the credit spread is in the money, it can be rolled out for a credit. This gives more time for the market to turn around. However, it gives more time for a losing trader to lose more, because we likely can’t roll down that far and still get a credit, and we will likely have to pay to roll the debit spread or narrow the distance between spreads, making the trade less attractive. If the price move continues down, there will be much less room to maneuver going forward.

4. Simply hold on and hope the probabilities play out. With 55 days in the trade, we just need to move down less that two expected moves by expiration. If the capital is available, and the conviction is there, holding can bring max profit with a big down move. Note that as time passes and the credit spread stays out of the money, the premium has to go away, so the value can evaporate very quickly with very high Theta as expiration approaches. This can be observed in the value vs time graph for the -2 EM curve. It can also result in max loss. As expiration approaches, the difference between max profit and max loss is just a few percentage points of price movement and max loss is much more than max profit.

In this example we can see that a move down of one expected move really doesn’t challenge our position, while two times the expected move is playing with fire. So, one approach might be to hold as long as the move stays within the expected move to the downside and switch to closing or rolling once the move exceeds that or some other multiple of expected moves. In any case, a trader has to know their risk tolerance and have a management plan for both winning and losing trades.

What about calls?

A logical question might be- if this works so great for puts, why not double up and do it for calls as well? Well, there’s one problem- skew. On indexes implied volatility is higher as strikes go to lower values and declines for higher strike prices. As a result, out of the money puts have higher implied volatility than out of the money calls. More importantly, far out of the money puts have higher implied volatility than puts closer to the money.

Look at our setup for this example. Implied volatility of the single long put is around 25, while the two short puts have implied volatility of 39. This helps two ways. The short puts have more of their premium tied to volatility, bumping up their price compared to the long put. Also, the higher implied volatility pushes the strike price further down to get a matching premium to the debit spread, making the trade a higher probability of success. We are selling more of the higher implied volatility and buying lower implied volatility, a key reason to use front ratio spreads.

A similar setup for a 1-1-2-2 call trade would reverse the dynamics. The long call closest to the money would have the highest implied volatility and the two short calls would have the lowest. To collect similar amounts to the put trade, the call strikes would be much closer between the debit spread and credit spread, and the difference in the deltas of the strikes would also be closer together, meaning a narrower window of max profit, and a higher probability of max loss. While still a trade with positive probability, it generally isn’t as attractive as the put side.

1-1-2 vs 1-1-2-2

I haven’t talked much about the two long puts bought at less than one Delta to open the trade. They are very unlikely to ever be in the money, and most traders would opt to close or adjust the trade well before they came into play. So, why have them? The simple answer is that they define or limit the risk of the trade, potentially reducing the capital required for the trade, and protecting from absolute disaster in the event of a market crash of over 37.5% in under 55 days. It could happen, like it did in February and March of 2020 during the Covid pandemic. We are giving up 20% of our premium to protect for a once or twice in a lifetime super crash.

So, what if we eliminate the long puts and do a naked 1-1-2 ratio spread? Is it different in outcome or probabilities? The answer is that it is very similar in most ways, and we will also see that a lot depends on the type of account you are trading in as to what choices there are. First, let’s start with the setup of the 1-1-2 trade.
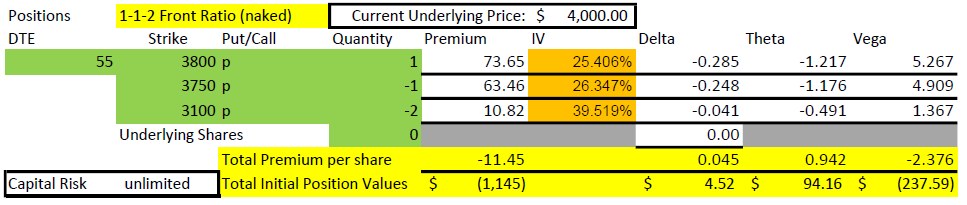
The 1-1-2 setup is similar to the 1-1-2-2
The 1-1-2 trade has two naked puts sold short, but way out of the money.

While this table shows the risk as unlimited, it is actually $618,855, the value of two 3100 puts if SPX went to zero by expiration ($620,000) less the $1,145 collected to start the trade.

Some accounts and some brokers require all trades to be defined in their risk. For example, retirement accounts generally aren’t allowed to use option margin and so any naked put would have to be cash secured. For this trade, eliminating the two long puts would mean the max loss would go up to $618,855, assuming that SPX went to zero, while we are holding two short 3100 puts. SPX will only go to zero if we see modern society end, and in that case, we’ll probably have bigger problems than our option positions. But rules are rules, and so if you want to trade without the long puts in a retirement account, you would need $620,000 capital to make a likely $800-$1200 or less than 0.2% return in 55 days or less. We’ll discuss other alternatives after we review the details of the 1-1-2 trade.
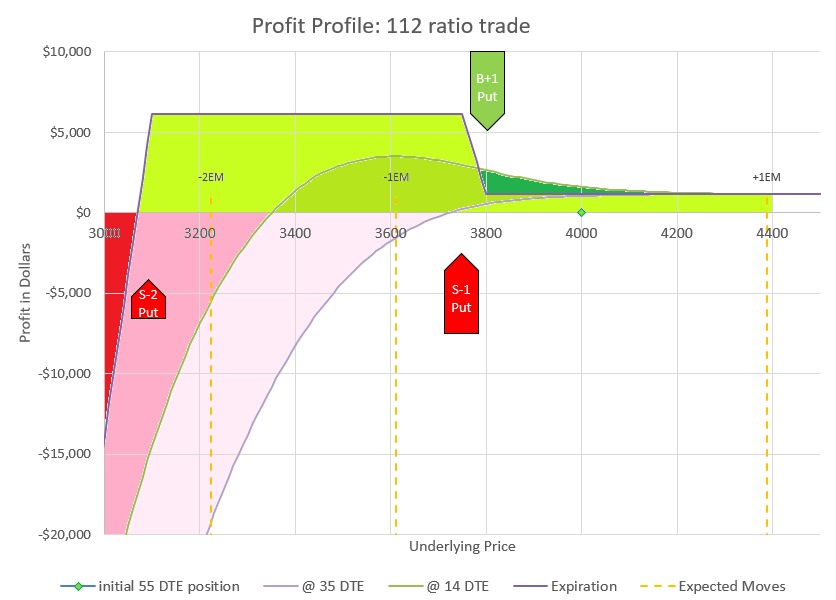
The profit profile for 1-1-2 is similar to 1-1-2-2
The profit profile for the 1-1-2 is very similar to the 1-1-2-2 other than the virtually unlimited loss.

Remember that our starting underlying price is $4000 and the trade is profitable at expiration as long as price is above 3100. The chart above doesn’t show losses all the way down to zero price, but just imagine zero price and -$618,855. Our probability of profit is 96% if held to expiration based on the Delta of 4 for the naked puts.
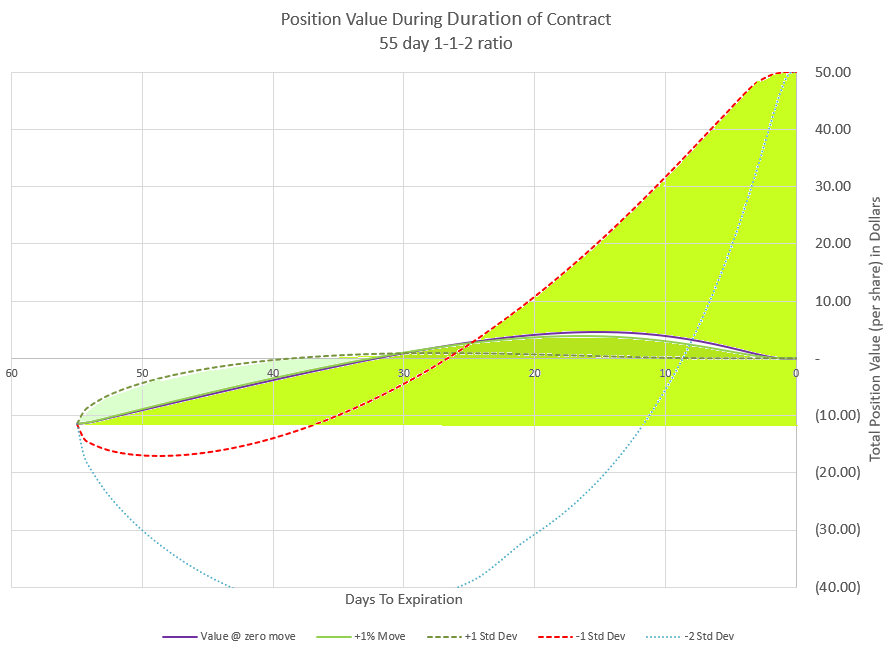
value vs time for 1-1-2
Most scenarios show a profit with 1-1-2

Looking at 1-1-2 values over time at the same price moves that we looked at for the 1-1-2-2 trade, we can see that the premium changes are fairly similar. Staying within one expected move keeps the trade moving in the direction of decay.
zoom in on 1-1-2 value over time
Zooming in on most likely outcome’s value over time

If we zoom in on the likely outcome, we see that premium behaves very similarly to what we saw with the 1-1-2-2 trade setup. We just have more premium collected to start with, taking a bit longer to fully evaporate and have the premium turn to a credit for closing. The concept is the same.

Summarizing the differences between the 1-1-2-2 trade and 1-1-2 trade, the 1-1-2 trade collects about 20% more premium in exchange for more loss if the market drops more than 37.5% in the 55 days of the trade. How likely is it for the market to drop more than 37.5%? Is buying the long puts for protection worth it? That’s up to each trader to decide.

Buying power requirements

I usually don’t spend much time talking about buying power because most trades I do are defined risk credit trades where the amount collected is a significant portion of the capital at risk. This trade is not so much, whether defined risk (1-1-2-2) or a naked ratio spread (1-1-2). In non-margin accounts, we collect 0.7% or 0.2% respectively, which isn’t much.

Below is an analysis of different possible ways to trade. I looked at trading each of these strategies three different ways. First, I looked at a cash secured account, like a retirement account. Next, I looked at an account with margin for naked options. Finally, I looked at a much different approach, trading futures options with span margin. The margin and span margin amounts came from entering this trade into the tastyworks trading platform.
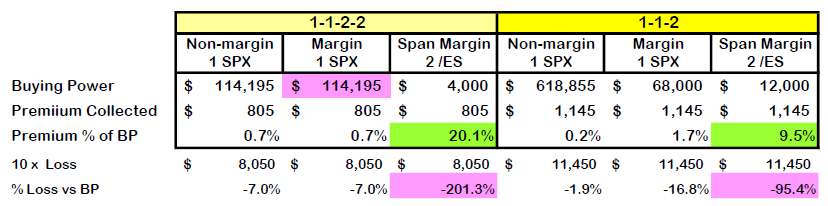
Buying power differences for Margin and Futures
Comparing buying power impact of different account types for the two strategies

I highlighted some key takeaway points. First, is how leveraged span margin with futures options can be for this trade. Our most capital efficient trade would be doing the 1-1-2-2 on futures span margin where we would collect 100 times the premium as a percentage of buying power (20%) than the non-margin account of the 1-1-2 trade (0.2%). Of course, with leverage comes much more risk. I chose to consider a loss of 10 times the initial credit as a practical worst-case scenario. The span margin would end up costing huge amounts more in a disaster and could potentially wipe out an account if the trade used a high percentage of the account’s capital.

A couple of weird margin anomalies to point out. In my margin account, the defined risk 1-1-2-2 trade required almost twice the buying power as the undefined 1-1-2, which is weird because clearly there is more risk in the naked 1-1-2. I think it may be that the calculation for defined risk is normally much less than undefined and the software may just assume that margin is not useful in defined risk. On the other hand, defining the risk on the futures version cut the buying power by 1/3. Different brokers may calculate their margin requirements differently, so don’t take this as universal truth. Similarly, remember that while defining risk usually increases the return on capital, it makes outsize losses more likely, especially when scaling up. Notice that the highly leveraged futures 1-1-2-2 would lose twice as much as a percentage of capital that the futures 1-1-2 setup in a 10x loss. I discussed this phenomenon in detail in my post on comparing risk.

Remember that margin and span margin change as the trade progresses depending on the market behavior. Span margin is subject to big swings when prices go against a position. A broker may force a position to close much earlier than a trader would want to get out due to expanding capital requirements. So, while initially the position is cheap to enter, a trader needs to limit each position to a fraction of the overall account size.

But the good side of this is that this trade can be entered for a very small cost. The trade is very high probability. We can also make more than the premium collected. I didn’t include it in the chart, but maximum profit for the most leveraged choice above would be $5,805 profit on $4,000 buying power, a return on capital of 145%. And there is over a 20% probability of that happening.

One final note on the buying power analysis table. To keep the quantities an apples-to-apples comparison, I used double the number of /ES futures options because futures options only control half as much value as SPX index options. So, technically, those futures options trades listed are 2-2-4-4 and 2-2-4 because they use twice the number of contracts to get the same notional exposure. I reviewed differences between index options and futures options in detail in my post about different ways to trade options on the S&P 500 index.

What about small accounts?

Readers looking at this may be thinking, “Gee, this is great for multi-millionaires, but what if the account is too small to consider any of these buying powers?” Great question- there are other alternatives. First off, a trader could use half the buying power listed by just trading options on one contract of the Mini S&P 500 futures (/ES). The 1-1-2-2 example would only take $2,000 buying power for $402 premium received. But, if that is still too much, we can make it a lot less.

Many traders are more familiar with options on the SPY exchange traded fund, which trades at approximately 1/10 the value of the S&P 500 index. For futures options, there is also options on the Micro S&P 500 futures contract (/MES), equal to 1/10 of the /ES contract size, or 1/20 of the size of an SPX option. By using SPY or /MES, we cut the size of the trade down by 1/10 compared to the above table. If the account is taxable, another choice would be the $XSP index, a 1/10 value index of the S&P 500 with favorable tax treatment, but lower liquidity. Again, all these alternative versions of S&P 500 options are discussed in my post on different S&P 500 choices.

So, for an account with futures trading capability, this trade could use /MES futures options and get into the 1-1-2-2 trade for just $200 buying power. An account with options margin could use SPY or $XSP and get into the 1-1-2 trade for $6,800 buying power. A trader doesn’t need a million dollar amount to trade this.

Concluding thoughts

I know a number of people who have traded versions of this trade during the bear market of 2022 without any issues. In fact, it could be argued that this trade, like most trades that collect credits from selling puts, works best if entering when the market is already down and implied volatility is high. Bad scenarios are already priced into option premium and there is a lot of cushion between strikes. This trade is most dangerous when volatility is low and prices are high- the probabilities are not as good, because a move of more than two times the expected move down is not nearly as far.

While not for everyone, the 1-1-2-2 and 1-1-2 trades provide a very high probability of success with a nice payout when used with leverage. The trade requires monitoring to maximize profit and to prevent catastrophic loss, so it really is not a set it and forget it trade. The key is to have a plan to manage the position if the market goes against the trade and stick to the plan.
The power of rolling Iron Condors

In the bear market of early 2022, I re-discovered a strategy that I had mostly discarded during the bull market of the preceding years, the Iron Condor. The Iron Condor is primarily a neutral trade that when managed with aggressive rolls can provide good returns in choppy, down-trending markets. My goal is to maintain a position that can tolerate fairly big market moves up or down, while benefiting from time decay.

I had discarded the Iron Condor trade because I found I was always losing on the call side of the Iron Condor. Initially, I liked the idea of making money on both sides, but I found in a constant up market, I often lost more money from calls than I made from puts. So, I switched to mainly put spreads and other short put strategies, which did great. But then 2022 came along, and it was clear that the market was no longer going up, and that we were heading for a bear market. I started adding credit call spreads to my credit put spreads to balance risk and have a neutral strategy. Over time I saw that some of my set ups and management strategies were working better than others, so I investigated and came up with a process that now works well in the current bear market environment.

The basic setup of an Iron Condor

Selling Iron Condors is an extremely common option trading strategy. The strategy is a combination of two calls and two puts, four separate options working together. Usually, an out of the money put and out of the money call are sold, and then a further out of the money put and call are purchased to define the risk and reduce cost. The trade wins at expiration if the price ends up between the short strikes, and hits max loss if the price moves beyond one of the long strikes. However, I rarely if ever hold to expiration and roll my position way before expiration is a concern.

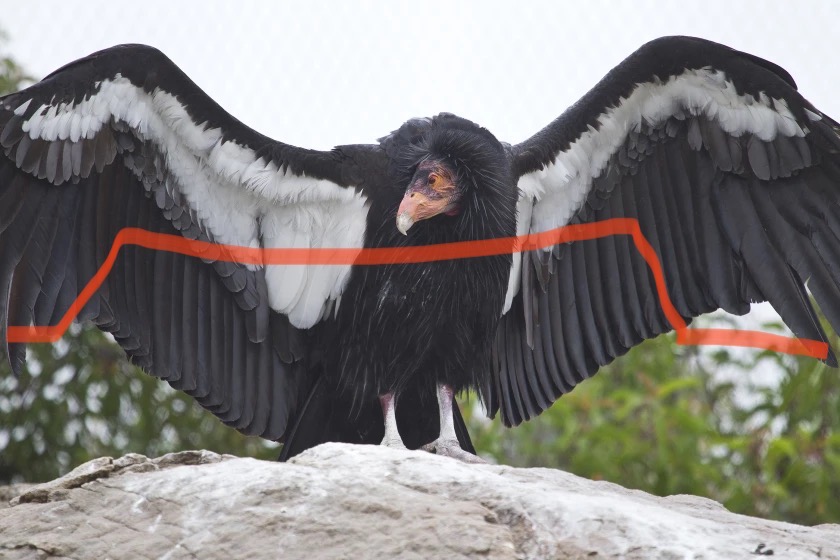
California Condor
Here is an actual California Condor with a profit curve of an Iron Condor option trade drawn over it.

An Iron Condor is named after the shape of the profit curve at expiration, which kind of looks like a condor with a bit of imagination, kind of like how star constellations are named. The iron part of the name designates that it is made up of a combination of puts and calls, as opposed to a put condor, or call condor which has four legs of the same type of contract. An example of a put condor is the broken wing put condor strategy I have described in a separate post.

To build on the condor metaphor, the difference in option strikes are often referred to as the body and wings of the combination trade. The body is the difference between the short put strike and the short call strike. The wings are difference between the call strikes or between the put strikes. The wings on the puts may be equal in width to the wings on the call, or they may be different. Wings that are different widths might be call unbalanced, or broken wings, as the profit profile will no longer be equal levels each end of the price ranges of the trade.

My preferred Iron Condor setup

What I have determined works best for my management strategy is to use the S&P 500 index options (SPX), targeting a starting point 28-35 days from expiration, with option Delta values of 30 for the short strikes and around 20 for the long strikes. I like equal width for the put side and call side, so the Delta values for calls will be a bit wider than the put side, and the net Delta of the Iron Condor will be slightly negative. With implied volatility between 20 and 30%, I generally target 100 wide wings, with the body between the short put and short call of around 15o points on SPX.

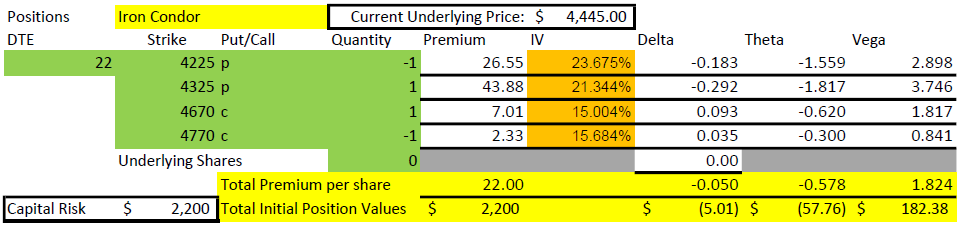
Premium and Greeks for Iron Condor
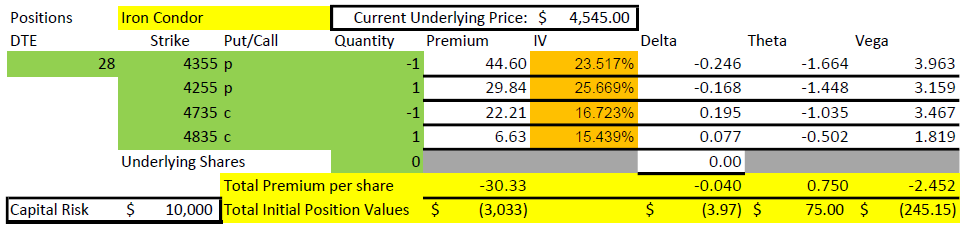
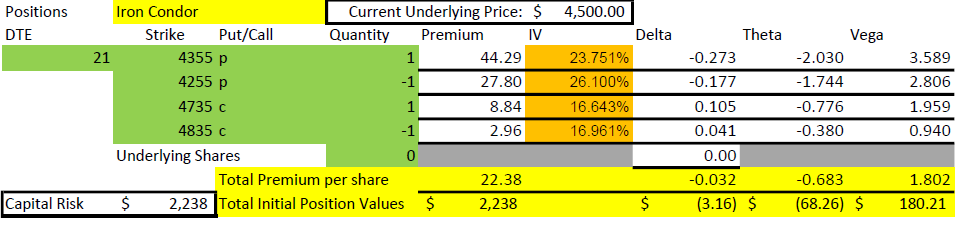
Here is the setup of an actual trade from early 2022 on SPX using the criteria from this post. In this example 30% of the wing width was collected, and a little lower deltas were used.
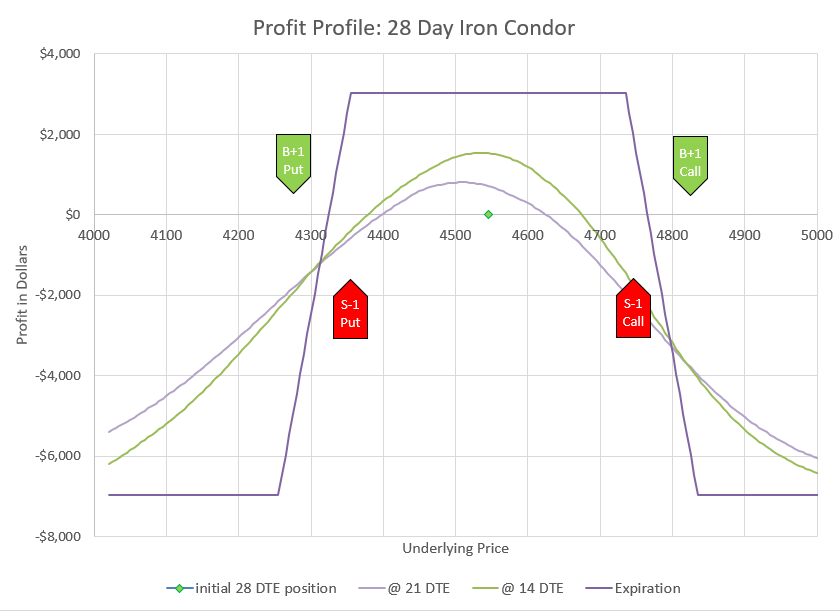
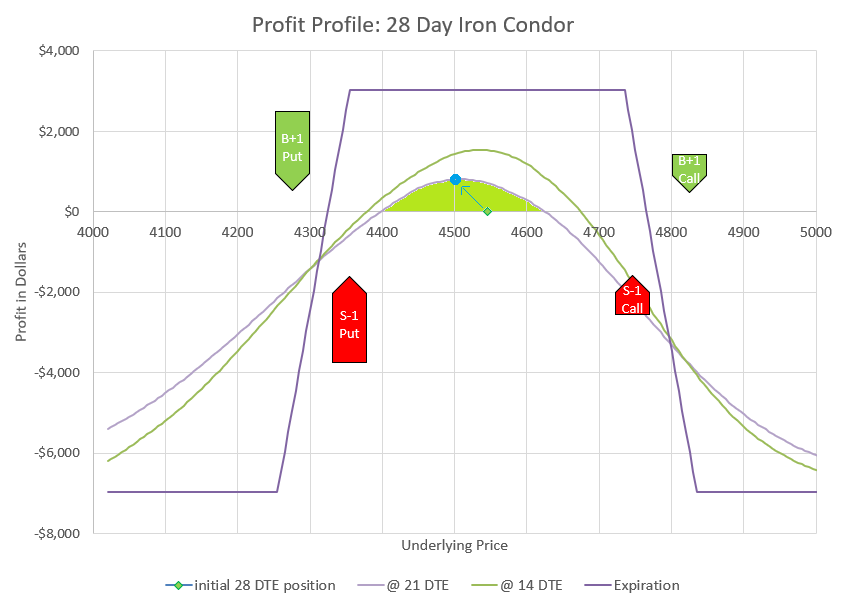
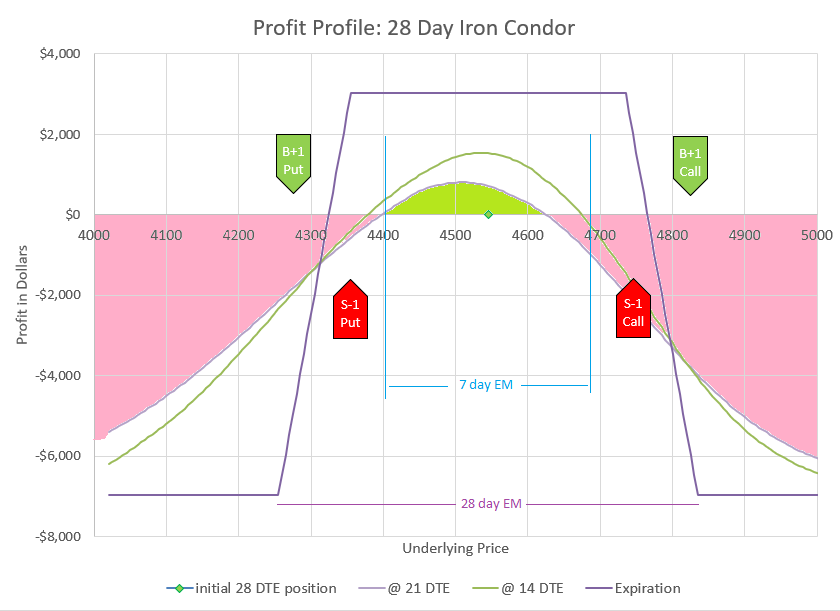
Profit Curve
For the above example trade, the goal is to keep in the profit zone for the first several days of the trade- the positive area under the 21 DTE curve.

I use SPX because it is the least likely underlying to have outsized moves. It is also very liquid to trade, has tax advantages in taxable accounts, and has expirations multiple times per week in the timeframes I trade. Depending on account size or type, other option products for the S&P 500 may be appropriate and can be used instead with essentially the same strategy. Other indexes or even individual stocks can be used, but managing can tougher with bigger moves, less expirations, and less liquidity.

I use 28-35 days to expiration (DTE) because my position can tolerate most reasonable moves while still having decent decay. I’ve used timeframes as low as 7 DTE, but find that many one day moves can push a position out of the profit zone, and I find myself fighting a losing battle too often. Longer durations of up to up to or over 100 DTE can work, but decay is slower, and there are very few expiration choices to roll to for the way I like to manage. All that said, my plan can vary to different timeframes, with the goal that I will only hold the position for somewhere between 1/10 and 1/5 of the time left to expiration- for example, a 30 DTE would be held 3-6 days before rolling, while a 100 DTE position would be held 10-20 days.

I choose 30 delta for short strikes and 20 delta for long strikes because they are the most forgiving in a move, while still offering reasonable decay as a spread. Higher deltas allow for more premium to be collected, and price movement will often be well tolerated as the long strike of the tested side will increase and the short strike of the untested side will decrease in value, compensating for much of the increase in value of the tested short strike. The goal of my management strategy is to keep this relationship intact, so that price movement has little impact on my option position value. I think of the area where deltas of the four options balance each other out as the profit zone. Staying in the profit zone allows Theta, or time decay, to do its work and deliver profits. I have used strikes with a bit higher delta values, but if too high, the two sides will get tested more often and then require more management. In the past, I often used lower delta spreads for safety and better percentage decay. However, I have discovered that low delta positions don’t actually tolerate price movement well because the untested side of an Iron Condor quickly runs out of premium to offset any of the movement of tested side. This observation has been a game changer for my use of Iron Condors.

I use equal width wings on the Iron Condor for a couple of reasons. Equal width seems to tolerate price movement, both up and down. Equal width also leads to a net negative Delta position, decreasing the total position profit when prices go up and increasing profit when prices go down, which is good in a bear market where downturns are frequent. Negative delta actually is somewhat neutral if the value is only slightly negative- Iron condors also have negative Vega, or decrease profit when implied volatility goes up. So, typically when prices go down, implied volatility goes up, and impacts of the negative Delta and negative Vega cancel each other out.

My Iron Condors are opening somewhere around 50% of the width of the wings. For example, if I have 100 wide wings, I would expect to collect $50 premium. I initially resisted this, thinking that the probabilities would be too low. However, since the time in the trade is so short, and I plan to actively manage moves against my position, I find that the risk reward ratio becomes favorable. However, the example trade that I’ve used is a little wider body and collected only 30% of the width.

Strikes compared to EM
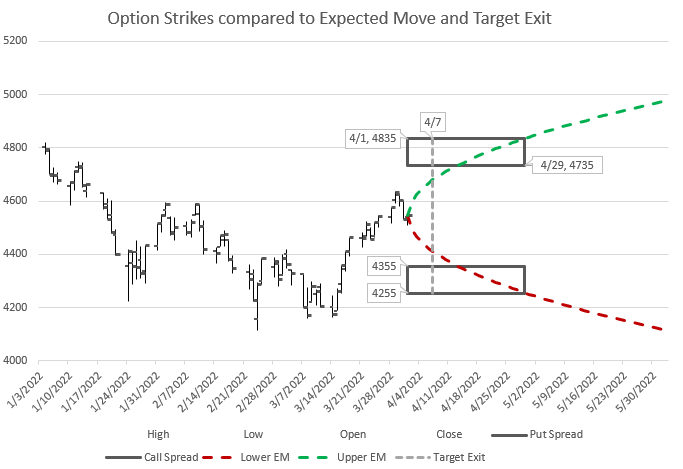
This chart shows previous market movement at the time of entering a trade, along with the expected move based on implied volatility and boxes to illustrate the strikes of the Iron Condor. The dates are the opening date, the expiration date, and the planned target date to close. This trade used long strikes that were at the expected move at expiration.

I have devised a graphic that may help to visualize this setup in regards to the expected move and time frame of the trade. The graph has several components- a historic rendering of what the index has done for the past several weeks, a curve showing the expected move for the next several weeks based on current implied volatility, and two boxes to represent the put and call strikes shown from the time of opening until expiration, and the target date to take action. My point with this chart is to show that while the strikes chosen are within the expected move at expiration, they are outside the expected move through the time I expect to be in the trade before I manage it. Said another way, if the position were held to expiration, it is very likely it would be breached on one side, but because the plan is to manage early, a breach is not likely- it would take an outsized move beyond the one standard deviation expected move.

Managing the trade with rolls

I manage my Iron Condor with what I think is a fairly unique rolling strategy. I roll my positions out in time and change all strikes in the direction that price has moved. If price goes up, I roll all the strikes up. If price goes down, I roll all the strikes down. I just roll whichever way the market goes. Here’s the interesting part- if I keep in the “profit zone,” I can roll up or down for a net credit with each roll, and my existing position will have a net profit. Usually, one side will be sitting with a profit and one side with a loss. The losing side is being tested- its strikes have higher deltas than when the trade started. The profitable side will have lower deltas than when the trade started. My profitable side should have a bigger profit than the loss of losing side. When I roll, I will likely have to pay a debit to get my losing tested side back to a good set of strikes at the new expiration. However, I should be able to collect a bigger credit on the profitable untested side than my tested side cost. Ideally, every roll is closing a profitable trade and collecting a net credit to open its replacement. All of this sounds great, too good to be true, but there are a number of details to unpack.

The first challenge is to stay in the profit zone. My general rule is that if I keep my untested short strike must never drop to a Delta value below 15. The reason is that when the Delta of the untested side gets below this point, it quickly stops being able to meaningfully contribute to offsetting price movement in the tested direction. For example, if the price drops, the short call will get further out of the money and drop in value, while the puts will go up in value. For a while the Deltas will mostly balance each other out, but as the Delta of the short call drops below 15, the put spread will start increasing much faster and the calls decreasing less. If this happens, it is time to act and roll all the puts and all the calls down to where there is again premium on both the put and call side. If price has gone up too much, it’s time to roll up all the puts and calls.

Actually, I try not to wait until the untested side gets to 15. I think of my position of having three possible states, green, yellow, or red. Green is when both short strike’s Deltas are above 20- everything is great and there is nothing to do. Yellow is caution, one of the short strikes are between 20 and 15, and probably will need to roll soon. Red is stop and take action, one of the short strikes is 15 or below, so it is time to roll immediately. So, my choice is clear for Green or Red, but I need to use some judgement in the Yellow state. If the day starts in the Yellow, I am more likely to let it ride for a while and watch to see if it recovers or gets worse. If the market has trended throughout the day and moved into the Yellow, I am likely to roll before the end of trading so I don’t end up deep in the Red overnight. If there is a strong trend pulling the position quickly toward Red, that may also be a good indication to act. Yellow is a judgement call.

I find that it is harder to have a profitable, credit roll when tested on a quick up movement. As mentioned earlier, equal width wings means that there will be a negative delta overall, and while volatility reduction can help, big up moves can be hard to stay on top of. That’s why this strategy works best in a bear environment, when the market is trending down.

Don’t over manage. Markets bounce around a lot, and it can be tempting to want to act on each little trend that happens. If I have the right strikes- the right body width and wing width for the market conditions, my position should be able to tolerate price movement. If I’m trading at 30 DTE, I want to wait 3-6 days between rolls, so I need to be choiceful about not rolling too often. If the market moves a huge amount in a couple of days, I may need to roll early, but then I’ll want to try to go longer before the next roll. The other thing to consider is that often the markets overshoot in one direction or the other, so I try not to move too far to chase moves that go on for days, and stay patient that the market will counter the trend.

If a position isn’t winning regularly and isn’t holding its premium in control, that’s a sign that the strikes aren’t right for the market and the duration. For a while I was trading 7 DTE Iron Condors on SPX with around 100 wide bodies and 50 wide wings. I would adjust nearly every day, but I couldn’t keep the position in the profit zone, and I often took losses. There wasn’t enough space in the body and the wings weren’t helping enough. By widening out the body and wings and adding more time, I found the position much easier to manage, and more likely to be profitable, and much less likely to take a big loss.

One way I can tell if I have a forgiving position is to compare my premium to the premium of the same position a few strikes higher or lower. For example, with Schwab StreetSmart Edge, I can pick Iron Condor as a strategy, pick an expiration date, pick a body width and a wing width. The application will then give me a list of strike combinations and premiums for those parameters. If all the choices around my preferred strikes have similar premium, then I know that price movement will have minimal impact on my chosen position. If there is a rapid change in premium for other strikes above or below my choice, it means my Iron Condor parameters are not very forgiving, and I should adjust time or widths or both. Other brokers will have similar ways to compare prices by shifting up or down all the strikes.

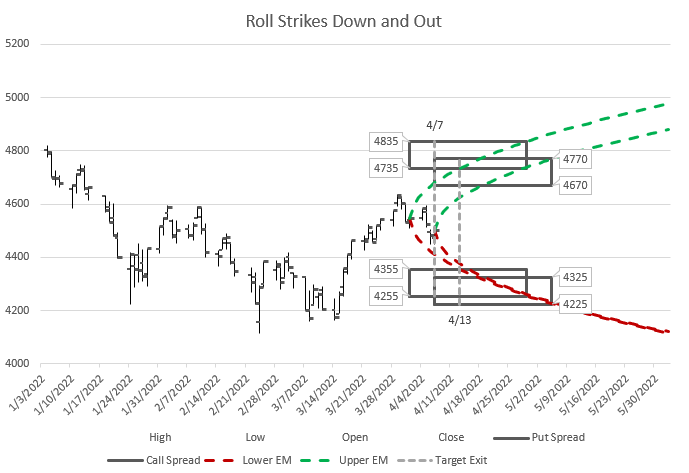
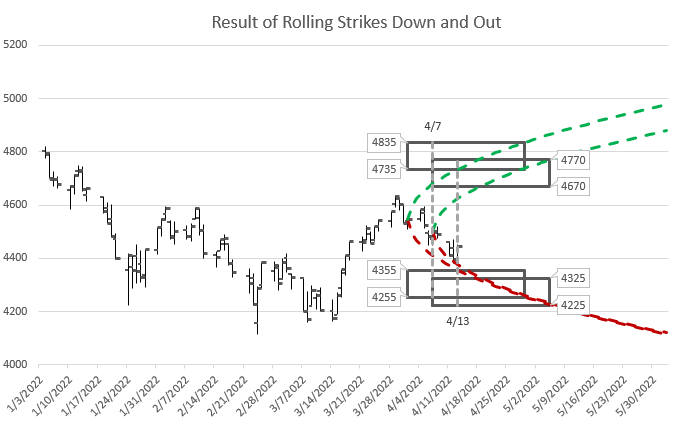
I have updated the earlier graphic to illustrate how a change in price over time will dictate the choice of a new position to roll to. The new price now dictates a new expected move, and new ideal strikes and expirations. Hopefully, this chart will help those that are fond of graphical illustrations.

roll down and out
After 7 days of mostly down moves, I decided to roll down my positions and roll out to a later expiration. In this image, the old position and expected move are there along with an updated expected move and new strikes.

Eight legs in the Roll

Since an Iron Condor has four legs, rolling involves closing four legs and opening four new ones. I don’t think any broker or exchange allows a eight-legged trade, so at a minimum this will take two trades to complete the roll. My preference is to roll the puts as a trade, and roll the calls as a trade. I usually start with the side that is being tested and might need a debit to roll to a new expiration and strikes. Then I do the other side, usually moving the same amount and keeping the same width, expecting to collect more to roll the untested side than I pay to roll the tested side.

At times, I may have a situation where I don’t have enough buying power to roll one side while the other side remains in place. If that happens, I’m probably using more of my buying power than I should, or the position is just too big for my account. It isn’t that big of a deal to manage the situation, however, I just close the untested side out and roll the tested side, then open a new position on the untested side. Worst case scenario, I can close the whole Iron Condor at once- freeing up its buying power, and then open a new one with the same buying power. As long as the wing widths are the same and the new Iron Condor collects more to open than the old Iron Condor cost to close, there should be a net gain in buying power. But again, any time buying power restricts a trade, it is probably time to pare down some positions in the account.

How Iron Condors tolerate price movement

Probably the best way to explain how an Iron Condor tolerates price movement is with an example. Earlier in this post I showed an opening trade from April 1, 2022. Let’s look at it again and look at how it fared after 7 days.

Premium and Greeks for Iron Condor
Here is the setup of an actual trade from early 2022 on SPX using the criteria from this post.

Notice that the premium collected is approximately $15 each on the put side and the call side.

Closing position
After a week, price has dropped to 4500, but the premium has dropped for a profit.

The premium on the put side has gone up to around 16.50, while the call side has dropped to just under $6.

After 7 days
After 7 days the premium increased on the put side but decreased on the call side, as illustrated by the larger and smaller strike position arrows, and the result is a net profit.

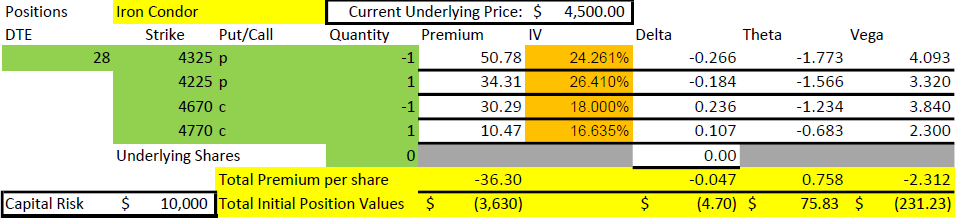
So, after 7 days, the trade made about $800 on $10,000 risk, an 8% return. But, that’s just the start- the plan is to roll, and so the closing trade above was combined with the following opening trade:

new roll position
On April 7, this trade was opened while closing the old position for a net credit and strikes that are back at the edge of the expiration expected move.

The combination of closing the old trade and opening the new trade is a net credit of just under $14 premium. This is the result we are looking for- a profit on the trade being closed, and a credit to move out in time and get to better strikes for the latest situation.

And just to finish the example trade, let’s look out another week and see what happened to the market and the trade that was rolled to.

roll result
After rolling down, the market kept going down, but stayed within the new strikes with plenty of space to spare.

By April 13, the market had dropped even further, approaching where the puts from the original position had been. However, the roll down gave the new position plenty of space and the trade was sitting at a profit, and ready to roll again.

Closing the rolled position
After 6 days, the rolled position had decayed even after a market move. Again, puts lost money, but the calls made the position profitable.

This trade made $1430 in 6 days, a 14% return on capital. Since the market went down, the put side of this trade lost money, although not that much since the price didn’t end up that close to the put strikes since our new strikes were lower than the old ones. Time decay helped counter the price movement against the puts. The money was made on the call side through both price movement and time decay. In the end time decay, represented by Theta, eats away premium as long as price doesn’t get too close to the strikes.

These are examples of trades I did during the Spring of 2022 in the face of a bear market. Not every trade faired this well. Some market moves were too fast and too far for me to be able to roll before the position went too far to one side. But more often than not, this rolling methodology has kept me from having positions blown out, and keeps day to day portfolio value from varying out of control.

You may notice that the example trades shown here don’t exactly follow all the mechanics I’ve described. Since those trades I’ve become a little more likely to intervene early, although it’s a balance with avoiding over-adjusting.

Finally, I don’t always get my rolled positions re-centered, like I did in the example I presented here. Often, I’m happy to just move in the direction of the market and make sure my new strikes are a bit out of the money on the tested side. In this crazy bouncy market, we get lots of reversals, so I let my positions stay a little off when the market has moved a long way and technical indicators suggest the last several days move may be about finished. However, these choices come down to individual trader preference and market outlook. No one knows what is happening tomorrow or next week, so we each have to decide what trade is best based on the information available. For a real life example of this type of decision making in action, see my post on the Goals of Rolling an Iron Condor.

Good luck trading and rolling Iron Condors!

Roll for 6% per Week- Really!

The basic 7 DTE trade is that I sell a 40-50 wide spread one week out at 10-12 delta for the short strike.  I usually collect over $1.50 in premium, and I try to buy it back 2-3 days later as part of a roll for something under $1.00, usually by collecting around a dollar in a roll.  For the most part, I roll the position every Monday, Wednesday, and Friday.

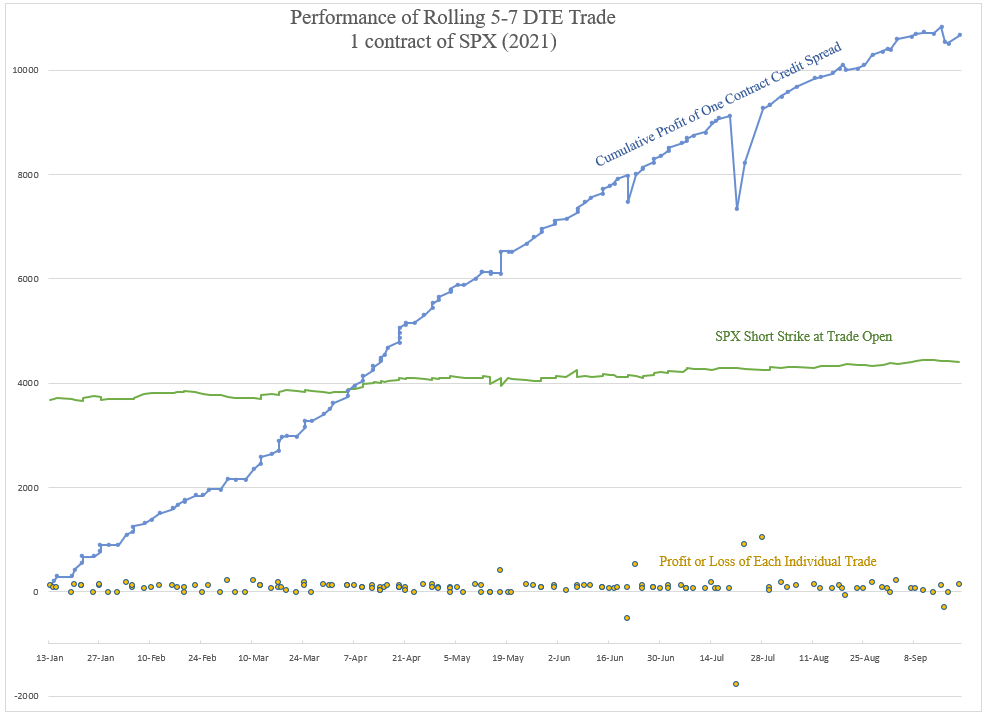
Since early January 2021, I have been trading a continuously rolling 7 DTE put spread on SPX.  I finally took time to separate the data for this trade from my other trades to show how well it has worked. I’m averaging greater than 6% per week return on capital.  The basic 7 DTE trade is that I sell a 40-50 wide spread one week out at 10-12 Delta for the short strike.  I usually collect over $1.50 in premium, and I try to buy it back 2-3 days later as part of a roll for something under $1.00, usually by collecting around a dollar.  For the most part, I roll the position every Monday, Wednesday, and Friday. No matter what happens, I roll and try to collect additional credit.

Said another way, I’m in a trade for a couple of days and collect about 2% on average for the effort.  For example, a 50 wide spread collecting a net $1 on a roll has collected 2%.  The profit comes mostly from time decay (Theta) and somewhat from upward price drift.

What is a roll?

For those not familiar with rolling, it is a trade where one position is closed while a similar trade with better profit probabilities is opened all in the same trade.  In this case, I might buy back a position with 5 days left to expire for $0.75 and sell a similar position with 7 days to expire for $1.75, a net credit of $1.00.

Managing when the market goes down

Most of the time (76%), the trade wins outright and I close for less than what I sold the spread for.  When the market goes against my position, I roll down and out as much as possible while collecting more premium. 

In the few events where I end up in the money, I use debit rolls to reposition out in time at lower strikes.  In this situation, I may pay more to close my 5 DTE position than I receive for opening a new 7 DTE position. The idea is that SPX will eventually turn around and the roll won’t cost that much if I stay within a reasonable distance.  I’ve used this technique on many put positions last year during the Covid crash and now on this trade.  Since the trade should generate lots of credit most of the time, I’ll take the risk of a total blow-up, and use profits to protect the position however far is needed.  Probably not everyone’s cup of tea, but it’s my plan- roll, roll, roll, no matter what.  I don’t know where I would want to set a stop for this trade- it’s defined risk, and rolling gives me the possibility and probability of full recovery, eventually. 

Historically, 98% of my rolls with this strategy are for net credit, and only 2% are a debit.  That’s a lot more cash coming in than going out.

Why does this work?

The general concept is that this trade is selling a spread that starts with about a 90% chance of expiring worthless.  Essentially, it would take two expected moves in the full time-frame of the trade to put the short strike in the money. It also decays quickly and approaches zero well before expiration in the majority of the time.  So, my expectation is that most of the time I can get around 1/2 of the premium collected to decay in about 1/3 of the time to expiration, then get out and do it again. By always being in the trade, I take advantage of the fact that time is always passing, which is the only sure thing with options. Being two expected moves away to start allows the position to filter out a lot of noise and still make money without a lot of stress over where the market is going.  When we get the expected move down, the position is still in good shape because that’s only half-way to the short strike.  By rolling down and out, we can re-establish further away from the money and still collect a credit.  Even several down days in a row can be absorbed, as this happens somewhat regularly.  My experience is that defensive rolls work out back to a full win without getting in the money 80-90% of the time. To be really problematic, it takes a move of over 5% down in less than a week that doesn’t recover at all to move the position into the money.  I’ve been in survival mode several times with this trade and recovered fully each time.  I expect that there will someday be a scenario where I can’t roll enough to recover, but I have saved back cash reserves to allow starting over if that time ever comes.

On the other hand, this trade generates 4-6% return on capital per week most of the time, so it should double its value in about a five-month time frame if there is not a major drawdown and even with no compounding re-investment.  I’m not sure how to calculate the probability of a winning week, but I’m pretty sure it is well above 90%.  The probability of an in the money scenario is likely in the 2% range, and I expect this scenario a few times a year, with a position that drags out without recovering for over a month happening in the once every few years timeframe.

I’ve adjusted my mechanics a few times during the time I’ve been trading it.  I started this the second week in January, at 100 wide and switched to 50 wide contracts when I realized that the extra width wasn’t gaining much, and was extra risk and extra buying power.  I’m now trading 40 wide. I’ve gradually gotten more methodical in my approach, although I’m still not that rigid.  Originally, I was selling 4-5 DTE and rolling 3-5 times a week. Since I switched to 7 DTE, I’ve found the trade much less time consuming with more premium and time cushion, but slightly less decay. However, the concept is the same- sell way out of the money put spreads and roll out every two days or more often to collect additional premium.

Why SPX?

I trade SPX only for this, and I think it is perfect because it has less price swings that almost any other underlying, and it is big enough that the commissions/fees are negligible.  I tested RUT and NDX and found them to be too volatile for my taste. I’ve tried SPY, but I find it hard to get filled near the mid-price on my rolls, and commissions are a much higher percentage of the trade.  I got the original idea from a post in a Facebook group last December, and tweaked it until it fit with my style.  There are a lot of ways to vary this, but this strikes me as a nice way to trade fairly near to expiration options with a high probability of success without a lot of drama.  I know several people who now also do their version of this trade, some using stops, some getting in and out based on the market, some using technical indicators to inform their decisions.

Results summary

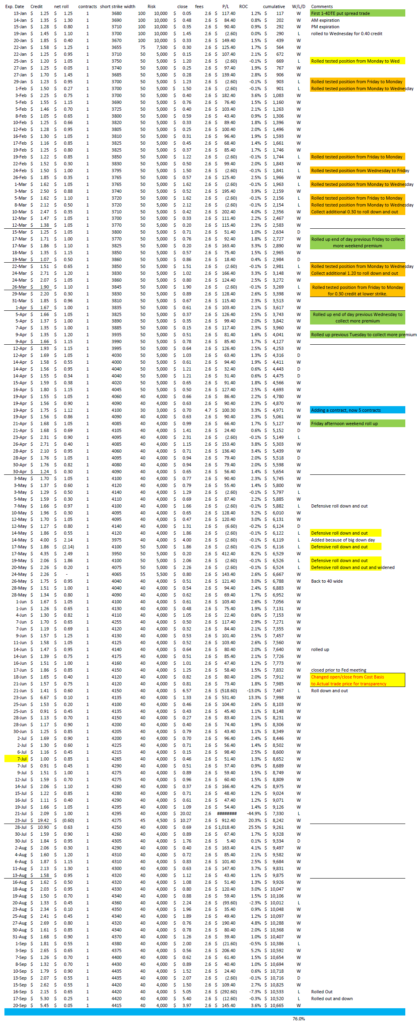
The sheet at the end of this post shows each individual trade.  At the first of the year, I showed trades that I rolled out that were losing by their cost basis to me.  So, if I sold a spread for $1.50, bought it back for $2.10 and sold the new position for $2.50, I would show closing at 1.50 and opening the next trade at $1.90, my adjusted new cost basis.  In June, I decided that this wasn’t very transparent, so I switched to showing the actual closing cost and opening sales price when I have to roll out on a tested position. Either way, these were my actual trades. I think that is easier to see how the trade works when the market is challenging.  I’ve scaled up the number of contracts I trade, but for simplicity, I’m showing just one contract.  The dates are the expiration date of the position- I don’t track which date I actually roll. 

When I charted this out, I was surprised to see how consistent this trade has been in accumulating profits.  Keep in mind that my results are just for the trade, and don’t take into account having cash on the sidelines to use for defense if the trade goes into the money.  My goal in this trade is to consistently generate cash as time passes by, and for the most part that is what has happened.

My results for this trade are in line with these expectations so far. In over 8 months, I have made money every single week on this trade except three, which is amazing to me, considering that the market had a few weeks where it really trended down.  In the first four months of this trade I doubled my money.  While this is the most consistently profitable trade I regularly do, I only use a small portion of my capital with this trade due to the tail risk from a major crash.

I hope this explanation and the data attached helps you understand this trade a little better.  As you all know, this is one of several trades I do. I thought this would be of particular interest, especially considering how well it has worked.  I’m very aware that there is considerable risk in this trade, despite its high probability of success, and that even in the majority of times significant volatility to the position can be expected.

I’ve shared this trade in a number of other forums and received a lot of questions. Here are some common ones:

How does this compare to 0 DTE?

One reason I started this trade was that I wanted an alternative to the 0 DTE or expiration day trades that I see a lot of people doing.  I tried my hand at these using stops, and I would have long strings of wins followed by a big loss that I couldn’t get out of in time.  It was very stressful to me, and most importantly, I wasn’t making money for all my effort.  When I came across this concept, I saw that I could use many of the same management techniques, namely rolling, that I use in longer duration trades, and avoid expiration day stress.

Where does 4-6% return on capital per week calculation come from?

A couple of ways to think about this.  I’m making at least three trades a week with this strategy.  Each trade has an average profit of around $0.80 per share, or $80 per contract.  The capital at risk is the width of the spread, $40 per share, or $4000 per contract.  Either way, that’s 2% profit for the capital at risk.  With three trades a week, I total up to 6%.  I could just as easily say 25% per month, or 100% per quarter, but that is less intuitive.

Why not use stops?

I know a lot of people are big fans of stops.  They prevent losses from getting out of hand, which in many situations is an absolute necessity.  Stops also eliminate the possibility of a position recovering.  My view is that market movement is mostly random up and down, and my experience with stops is that I often get stopped out right before the market reverses, locking in a loss that would have been much less if I had stayed in the trade. As a result, I prefer to find ways to extend out the trade on positions where I have a reasonable expectation that the position will recover in a reasonable amount of time.  With the S&P 500, this has been a very reasonable expectation, especially if I can re-position my strikes down while collecting more credits in the process.

Advantage of defined risk over naked puts

I know that many people are big proponents of selling naked puts because there is more premium per contract than with a spread.  However, naked puts take more capital in most situations, and have undefined risk.  Because a spread requires less capital, the return on capital can be much higher.  Having defined risk through a spread, provides a floor for the trade that prevents the possibility of completely blowing up an account with an outsized black swan type loss event.  For those reasons, I avoid selling naked puts, and instead sell credit spreads.  One caveat is that if a naked put is sold cash secured, the risk is reduced to market risk and can never blow up an account- however, returns will be a small fraction of trading a spread.  It’s all trade-offs and a matter of strategy preference.

Are these three trades at once or one?

I trade this with just one position, opened and closed three times a week or more with a roll.  For example, each Monday I close the following Friday position 4 days out and open a position for the following Monday 7 days out.  Then, on Wednesday I close the Monday position 5 days out and open a new position for the following Wednesday 7 days out.  Then, on Friday I close the Wednesday position 5 days out and open a position the following Friday 7 days out.  I just repeat over and over.  If the market jumps up somewhere in between rolls, I may choose to roll to higher strikes in the same expiration for an extra credit.

Why not hold to expiration if the odds are so high? 

The strikes I pick decay quickly, and I expect the position I roll into to decay more than if I had held the position I closed.  This is why I can make $3 in a week with a position that sells for $1.50 to $2.00 to open on average.  By rolling to a new position, I make better use of my capital.  Also, rolling early gives more flexibility to manage compared to positions that are closer to expiration.

What time of day is best for the roll?

I’m still trying to determine when the most profitable time to roll is.  I don’t believe time of day is as critical as the action of the market.  Ideally, the IV of the strikes at 7 DTE are much higher than those at 5 DTE to maximize the difference in premium.  But when is that most true?  What triggers that situation?  It appears to be a mix of variables that I haven’t yet been able to model or pin down.  My tactic is to monitor the net credit available throughout the day and trade when I can get what seems high based on my previous experience.  So, it is more art than science, which is never my preference.  Alternatively, I just put in the trade when I have time, knowing that time decay generally works out so that no matter what credit I get to roll, it will average out in profits in the end.  I’m not convinced this is optimal, and I may be leaving some return on the table.  This is an area I continue to study.

What strike do you roll to?  Always to 10-12 delta?

Ideally, I’d always roll to 10-12 delta strikes if the market were constantly grinding higher.  However, the market varies and sometimes goes down and rolling to 10-12 delta would require paying a debit to achieve.  My strategy is to collect a credit to roll whenever possible.  So, if I can roll to an ideal short strike in the 10-12 delta range for a credit, then I do it. If I can’t, then I roll to the lowest strikes I can while still collecting a credit.  This causes the delta value to drift when the market is in a downturn with an expectation that eventually the position will work its way back to the ideal delta values.  Because we work from values so far away from the current price, we can afford to drift closer from time to time, knowing that the probabilities still favor the position decaying.

What about bear markets?

I don’t know when we will have a bear market.  Obviously, if I did, I’d get out of this trade to avoid losses and get back in at the bottom.  Lots of people predict crashes, and if you predict a crash enough times, you’ll eventually be correct.  I’m not naïve, I know a bear market will come some time.  But since I can’t predict it, I’ll deal with it when it or a significant correction comes.  I’ll use the mechanics I’ve described for this trade, and fight to make a profit with defensive and survival rolls.  Remember, in down markets the strategy is to aggressively roll down strikes, improving the probability that even a modest recovery will lead to a profit.

Is there a scenario where this trade could be a total loss?

Sure, this is a highly leverage trade, and as such a fairly small correction could put this position deep in the money and marked for a near total loss.  Any number of events could trigger a sudden drop in the market- for example: a surprise Fed announcement, another unexpected financial crisis, a natural disaster, a military or terrorist action against the US or US interest, or another pandemic. Most situations would progress slowly enough to allow this trade to be adjusted and rolled out and down, but some could be so sudden that there would be no action that could be taken.  After 9/11 the market was closed for several days, and opened way down when it did open.  Is it possible that the market could be closed for the life of a contract?  Absolutely.  I’m sure there are numerous scenarios for total loss that I can’t anticipate with this strategy.  The only thing I can do is be prepared that a total loss won’t ruin me financially because I keep cash on hand as an ultimate hedge.

How much do you scale up your position to compound profits?

This trade can provide a lot of cash.  I see three ways to use the cash that is generated.  One is to take it as income.  Another is to save it as a buffer for when the market requires a survival roll for a debit, or even a total loss.  And finally, cash profits can be plowed back in to increase the amount of contracts traded.  So, how much to use for each purpose?  It depends mostly on how much income you need from the position.  I know that taking income distributions means that money can’t be used to build the size of the account.  But, I take out what I need to.  With what’s left over, I have a simple rule.  I want as much cash available in the account as is required for the strategy.  For example, in a $40,000 account, if I have $20,000 capital required for five 40-wide spreads, then I want to have $20,000 cash buying power available and not used.  If the account grows to $48,000 balance, I can add another contract- that’s another $4,000 at risk and another $4,000 cash buying power sitting in the account.  Effectively, this cuts my portfolio return in half, but with compounding from scaling up, the portfolio would theoretically

These returns seem unbelievably crazy. Are you making this up?

These results are actual trades I’ve done.  I don’t know what will happen in the future, but this trade has worked well so far. There’s no guarantees, and past performance does not predict future results.  This trade has substantial risk, and potential for big rewards.

Can I see a log of this trade over time?

Sure, here’s eight months of raw data:

2022 Update-

As we moved into 2022, the market changed dramatically. 2021 was a very calm year with no downturns in the S&P 500 of over 5%. However, with inflation growing and the Federal Reserve taking action to tackle inflation, the market became much more two-sided and essentially bearish.

So, for this trade, I have adjusted to sell both sides of the trade, puts and calls. Instead of a credit put spread, I now sell an Iron Condor. I aggressively adjust my strikes up and down with each roll now, using credits from moving the untested side rolling toward the current price to pay for debits if needed to roll the tested side away from the current price. This has reduced volatility of my positions and made the trade manageable in this near bearish environment.

The other change that I have made is taking advantage of Tuesday and Thursday expirations. With expirations every day, I can move my positions out to 7 DTE every day, allowing regular adjustment of my strikes while rolling out each day.

Combined, I feel like I have more control managing my 7 DTE positions in a volatile market. Results are looking positive with these changes and I will update when I have enough data to show. Once the Federal Reserve is done tightening the economy and switches back to stimulating, I will likely switch back to puts only or some hybrid that goes in and out of calls.

error

Enjoy this blog? Please spread the word :)